Asymmetric Variations in the Tropical Ascending Branches of Hadley Circulations and the Associated Mechanisms and Effects
2018-01-29BoSUN
Bo SUN
1Collaborative Innovation Center on Forecast and Evaluation of Meteorological Disasters,Nanjing University of Information Science and Technology,Nanjing 210044,China
2International Pacific Research Center and Department of Atmospheric Sciences,University of Hawaii at Manoa,Honolulu,HI 96822,USA
3Nansen-Zhu International Research Centre,Institute of Atmospheric Physics,Chinese Academy of Sciences,Beijing 100029,China
1.Introduction
The Hadley circulation(HC)transports energy and momentum from the tropics to extratropical regions and exerts important impact on global climate(Diaz and Bradley,2004).Observations indicate that the HC has been polewardexpanded and intensified during past decades(Quan et al.,2004;Hu and Fu,2007;Lu et al.,2007;Nguyen et al.,2013).The underlying mechanisms for the poleward expansion and intensification of the HC have been widely explored with respect to the influences of anthropogenic forcing(e.g.,greenhouse gases(GHGs)]and natural variability(e.g.,ENSO)(Quan et al.,2004;Hu and Fu,2007;Adam et al.,2014;Lau and Kim,2015;Tao et al.,2016;Kim et al.,2017;Singh et al.,2017).Under the global warming in response to increased GHGs,the tropical convective zone was projected to be deepened and the subsidence over the midlatitudes was projected to be widened,indicating a strengthened and broadened HC that would cause increased droughts worldwide(Lau and Kim,2015).In addition,stratospheric ozone depletion was also suggested to be an important influential factor for the expansion of the Southern Hemisphere(SH)HC(Polvani et al.,2011;Kim et al.,2017).However,there is a large uncertainty in the change of the HC strength under global warming(Kang et al.,2013;Ma and Xie,2013).As for the interannual variability,it was proposed that ENSO can influence the HC extent via modulating the meridional temperature gradient and momentumflux,with the HC extent shrinking(expanding)during El Ni˜no(La Ni˜na)events(Nguyen et al.,2013;Guo and Li,2016).
During the past 60 years,the inhomogeneous emissions of anthropogenic aerosols have tended to cause an energy imbalance between the Northern Hemisphere(NH)and the SH,with a larger(smaller)aerosol forcing in the NH(SH)(Yoshimori and Broccoli,2009;Hwang et al.,2013;Wang et al.,2016b).Consequently,an anomalous cross-equatorial HC has been induced,transporting energy from the SH to the NH to maintain the interhemispheric energy balance(Hwang et al.,2013;Wang et al.,2016b).Wang et al.(2016b)advised that the climate has a fast and slow response to the anthropogenic aerosol forcing,and the SST-mediated slow response dominates the anomalous interhemispheric HC(Xu and Xie,2015).The equatorially asymmetric changes in the tropical SST resulting from the anthropogenic GHG and aerosol forcing,which is related to asymmetric trade wind changes,might cause equatorially asymmetric changes in the tropical components of HC,and thus induce this anomalous cross-equatorial HC(Xie et al.,2010;Friedman et al.,2013;Feng et al.,2016).Moreover,Feng et al.(2016)suggested that the response of meridional circulation to an asymmetric SST change is much stronger than its response to a samemagnitude symmetric SST change,indicating the importance of equatorially asymmetric SST changes to the anomalous interhemispheric HC.
However,most of the above studies considered the anomalous cross-equatorial HC mode as a whole,but gave little insight into the spatiotemporal features of the northern tropical ascending branch(NTAB,defined as the ascending branch of the NH HC)and southern tropical ascending branch(STAB,defined as the ascending branch of the SH HC),which are not only key components of the HC but also important influential factors of tropical and extratropical climate(Huang,1992;Sun and Wang,2015).The tropical circulation was projected to be weakened under global warming because the larger increasing rate of atmospheric moisture than precipitation requires a decreased convection massflux(Held and Soden,2006;Vecchi and Soden,2007;He and Soden,2015).Nevertheless,the projected weakening primarily occurs to the Walker circulation but not the HC(Vecchi and Soden,2007;Tokinaga et al.,2012a,2012b;Ma and Xie,2013;Lau and Kim,2015).An insight into the changes of the NTAB and STAB during past decades is conducive to a better understanding of the changes in NH HC and SH HC,as well as the anomalous cross-equatorial HC.
Thus,this study aims to answer the following questions:How were the NTAB and STAB changed during past decades?How are the trends in NTAB and STAB related to the trends in tropical SSTs?How is the interannual and decadal-to multidecadal variability of NTAB and STAB related to tropical SSTs? What effects did the NTAB and STABexertonthetropicalprecipitationandHC’supper-level meridional winds?
The rest of this paper is organized as follows:Section 2 describesthedataandmethodusedinthisstudy.InSection3,the trends and the asymmetric variations in NTAB and STAB are examined using three reanalysis datasets,and the influence of tropical SST trends is discussed.The relationship between NTAB/STAB and tropical SSTs is further analyzed in section 4 regarding the interannual and decadal-to multidecadal variability.The effects of the asymmetric variations in NTAB and STAB on tropical precipitation and the HC’s upper-level poleward air transport are discussed in section 5.Section 6 provides a conclusion and discussion.
2.Data and method
The reanalysis data employed in this study include three datasets:(1)the NCEP reanalysis dataset,which has a spatial resolution of 2.5◦×2.5◦,17 vertical levels from 1000 hPa to 10 hPa,and a time span from 1948 to present(Kalnay et al.,1996);(2)ERA-40,which has a spatial resolution of 2.5◦×2.5◦,23 vertical levels from 1000 hPa to 1 hPa,and a time span from 1957 to 2002(Uppala et al.,2005);and(3)JRA-55,which has a spatial resolution of 2.5◦×2.5◦,27 vertical levels from 1000 hPa to 100 hPa,and a time span from 1958 to 2012(Kobayashi et al.,2015).
The SST data used in this study include:(1)ERSST.v4,which has a resolution of 2◦×2◦and a time span from 1854 to present(Huang et al.,2015);(2)HadISST,which has a resolution of 0.5◦×0.5◦and a time span from 1870 to present(Rayner et al.,2003);and(3)the Centennial in situ Observation-Based Estimates(COBE)SST dataset,which has a resolution of 0.5◦×0.5◦and a time span from 1891 to present(https://www.esrl.noaa.gov/psd/data/gridded/data.cobe.html).
The precipitation data used in this study include:(1)20CR,version 2,which covers global oceans and lands(https://www.esrl.noaa.gov/psd/data/gridded/data.20thC Rean V2c.html);(2)CRUTS3.24(http://badc.nerc.ac.uk/data/cru/);and(3)GPCC(https://www.esrl.noaa.gov/psd/data/gridded/data.gpcc.html).
The latitude of the intersection of NH HC and SH HC is given by the average latitude of the 850–200 hPa zero line of global zonal mean meridional stream function ψ:
where p is pressure,psis the surface pressure,ϕ is latitude,g is the gravitational acceleration,a is the radius of the Earth,and v is the meridional wind(Nguyen et al.,2013).
Moreover, an index denoting the intensity of NTAB/STAB is defined to illustrate the temporal variation of the NTAB/STAB intensity.This index is defined as the 850–200 hPa averaged w × (−1)over the range of NTAB/STAB,where a large index denotes a large intensity of the NTAB/STAB and vice versa.The vertical velocity w is given by

where p is pressure and t is time.According to Fig.1,the latitudinal ranges of the NTAB and STAB are defined as 3.4◦–15◦N and 12◦S–3.4◦N for the NCEP data,5.3◦–15◦N and 10◦S–5.3◦N for the ERA-40 data,and 6.2◦–15◦N and 10◦S–6.2◦N for the JRA-55 data,respectively.The longitudinal ranges for calculating the NTAB and STAB indices are 0◦–360◦E.
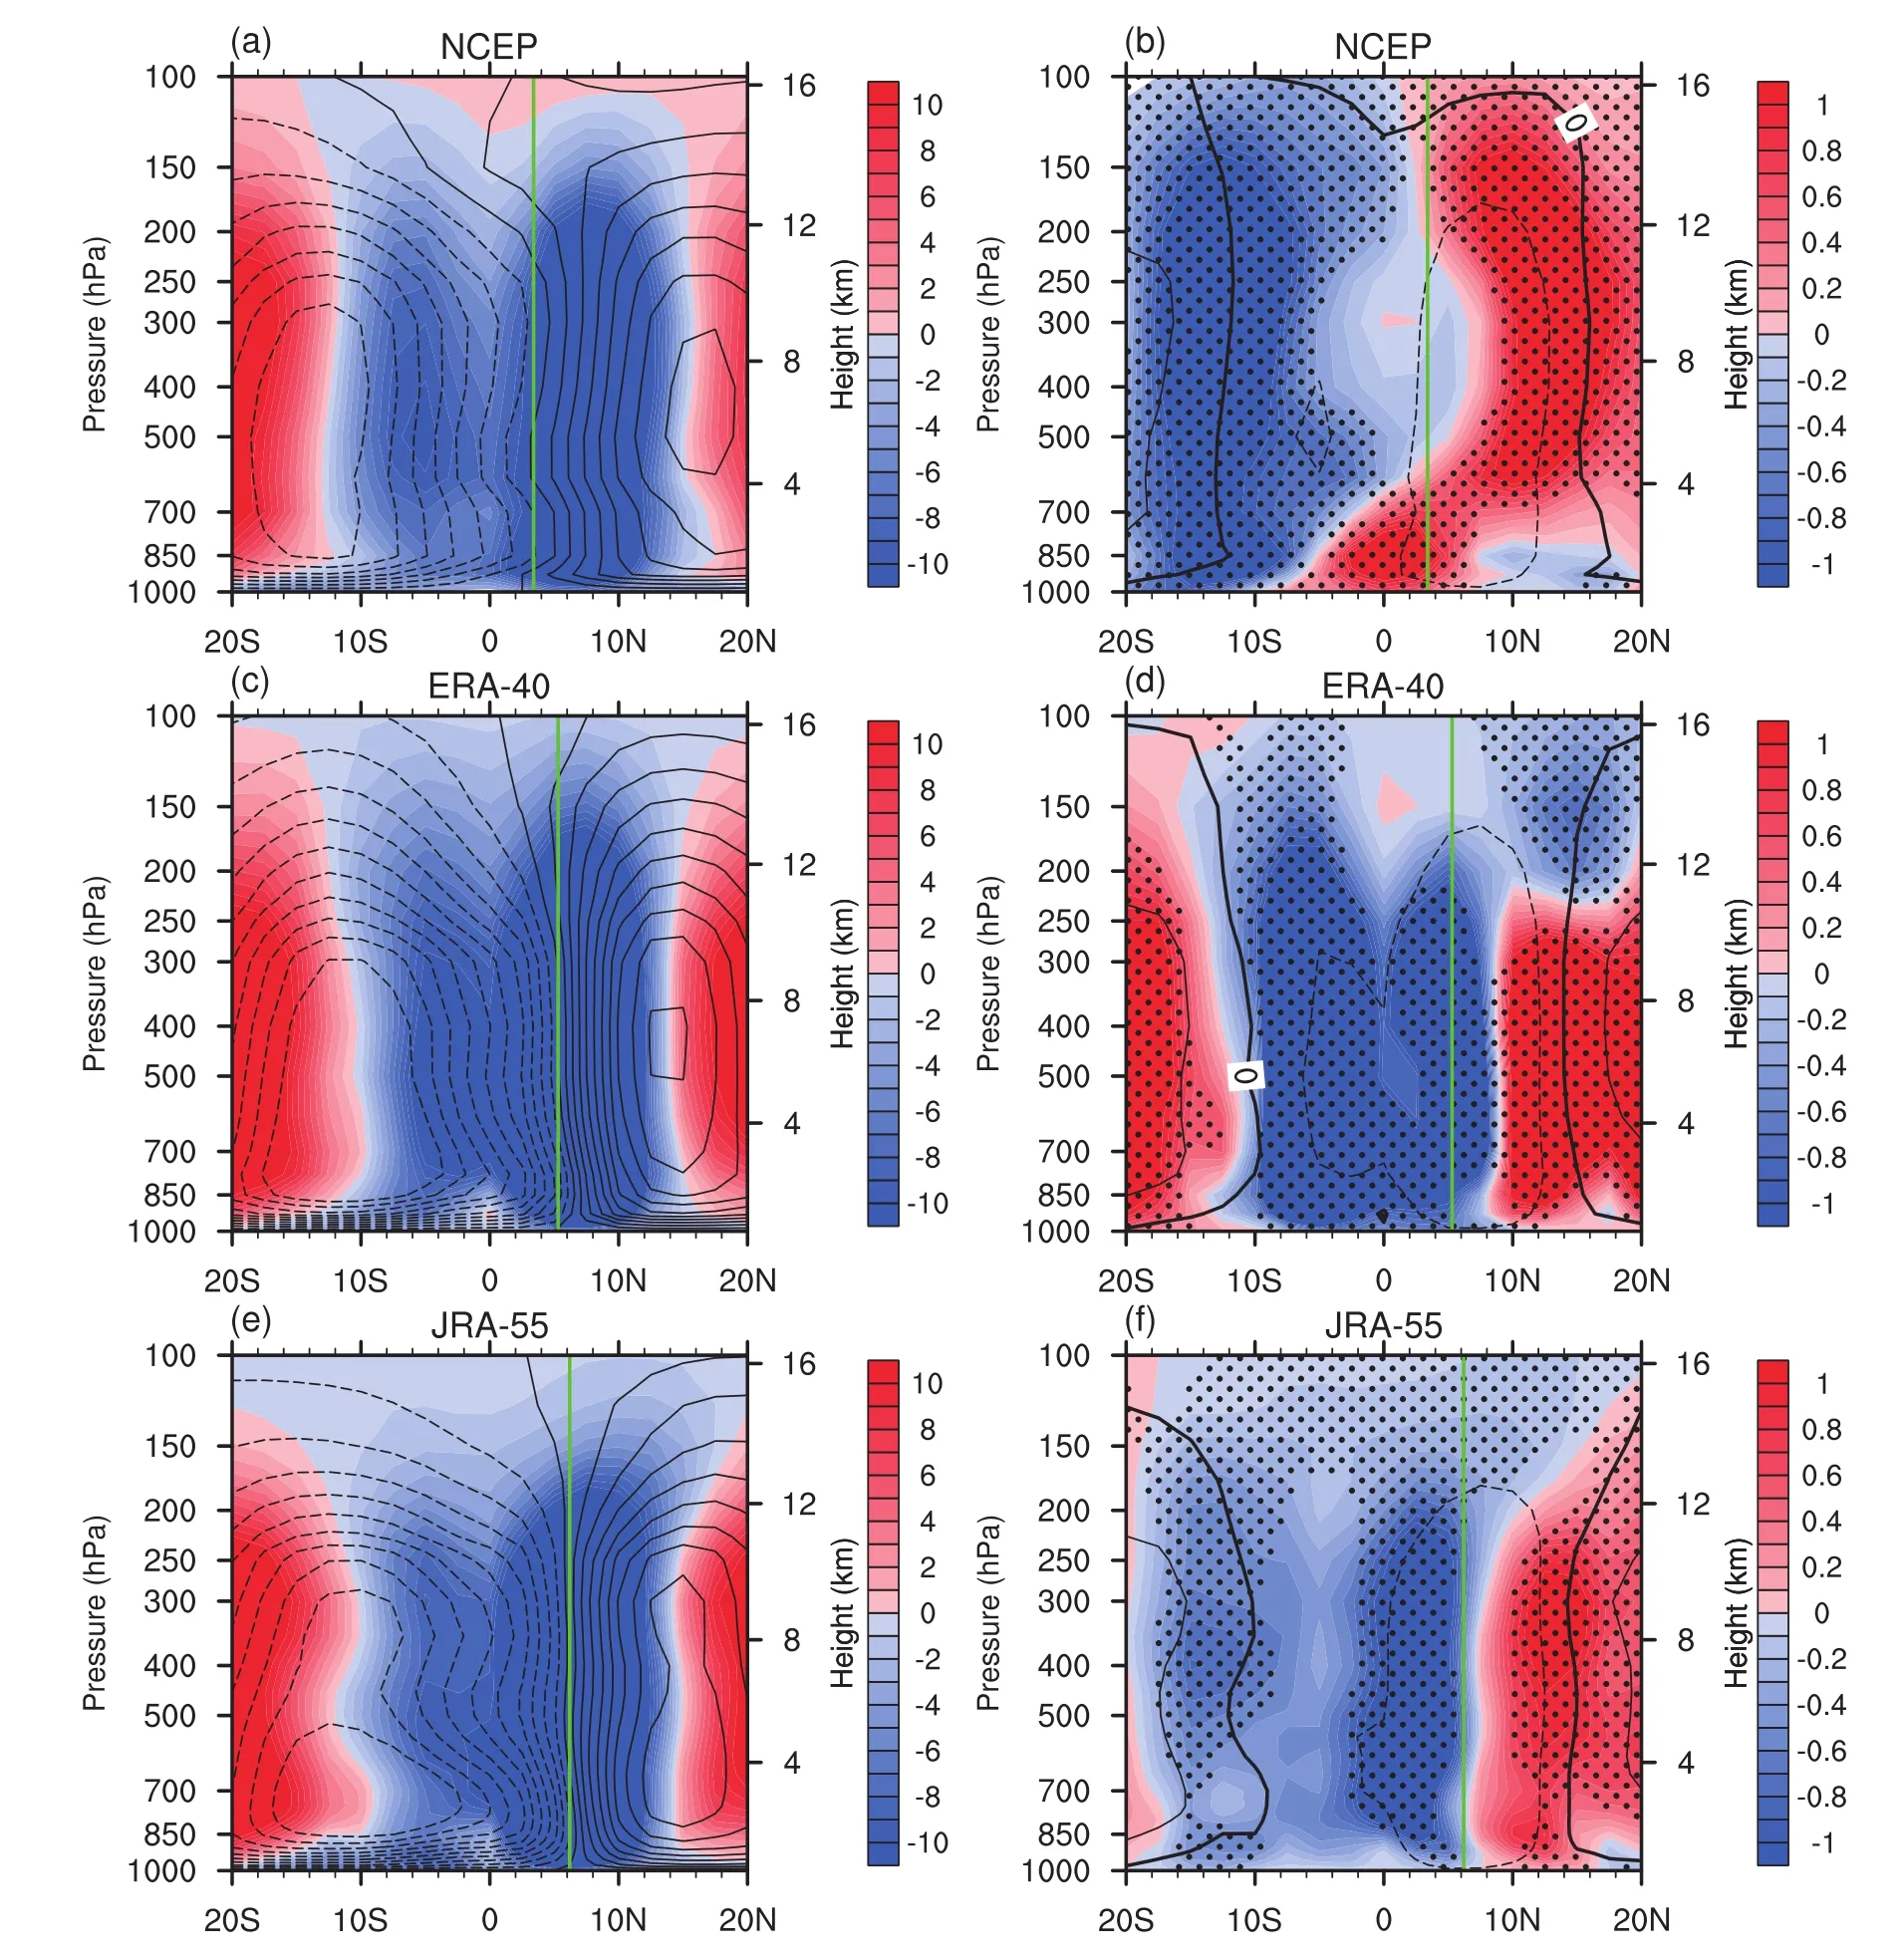
Fig.1.(a,c,e)Climatology of the global zonal mean w(color shading;units:10−3Pa s−1)and meridional stream function(contours;units:109kg s−1)for the period 1958–2001.(b,d,f)Linear trends in the global zonal mean w[color shading;units:10−3Pa s−1(10 yr)−1]for the period 1958–2001.Stippling in(b,d,f)denotes the 95%confidence level.Black contours in(b,d,f)denote the climatology of global zonal mean w(units:10−3Pa s−1),with thick lines denoting the zero line,dashed lines denoting negative values,and solid lines denoting positive values(interval:10).Vertical green lines denote the climatology of annual mean HC intersections.(a,b)NCEP data;(c,d)ERA-40 data;(e,f)JRA-55 data.
3.Asymmetric changes in tropical ascending branches
To compare the climatology of HC in different reanalysis datasets,the climatology of annual mean HC is computed in terms of the meridional stream function and vertical velocity(w)for the overlapped period of the three reanalysis datasets,1958–2001.As shown in Figs.1a,c and e,the STAB has a wider range(approximately from 10◦S to 5◦N)than the NTAB(approximately from 5◦N to 15◦N).The HC intersection being north of the equator is primarily because the Atlantic meridional overturning circulation implements a northward cross-equatorial energy transport that makes the NH warmer than the SH(Quan et al.,2004;Schneider et al.,2014).The climatic HC intersection in the NCEP data is at 3.4◦N,ERA-40dataat5.3◦N,andJRA-55dataat6.2◦N.This difference in the location of the HC intersection may be asso-ciated with a series of discrepancies in the tropical and extratropical dynamic processes involving cloud,radiation,precipitation,and monsoon(Yancheva et al.,2007;Stanfield et al.,2016).Thus,a comprehensive examination over a variety of reanalysis datasets is essential for studies on tropical climate change.
By and large,the trend in vertical velocity(w)indicates a strengthening of the STAB and a weakening of the NTAB during 1958–2001 for all three reanalysis datasets(Figs.1b,d and f).These contrasting changes in the tropical ascending branch(TAB)exhibit an asymmetry with respect to the HC intersection rather than the equator.Thus,it seems more reasonable to use the HC intersection as a demarcation line in this study than to use the equator as many previous studies did(Dima and Wallace,2003;Friedman et al.,2013;Feng et al.,2016;Guo et al.,2016).Notwithstanding the consistency in the strengthening(weakening)of STAB(NTAB),conspicuous differences exist among the three reanalysis datasets in the changes of STAB/NTAB.For the NCEP data,the strengthening of STAB is most significant around 10◦S and less significant near the equator(Fig.1b).For the ERA-40 data,the strengthening of STAB is relatively homogeneous,but the southern part of NTAB also exhibits a feature of strengthening,which is different from the other two datasets(Fig.1d).In contrast,for the JRA-55 data,the strengthening ofSTABis significantto the north of the equator andinsignificant to the south of the equator(Fig.1f).These results reflect an overall consistency among the reanalysis datasets in representing tropical climate changes,which demonstrates a generally good confidence of the three datasets,but meanwhile reflects noticeable discrepancies among them that suggest an uncertainty of the results in this study.
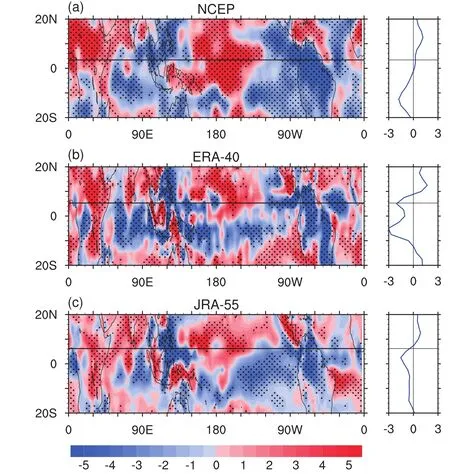
Fig.2.Trends(color shading)and global zonal mean trends(profiles)in 850–200 hPa averaged w during the period 1958–2001 for the(a)NCEP,(b)ERA-40,and(c)JRA-55 datasets[units:10−3Pa s−1(10 yr)−1].Horizontal lines denote the climatology of the HC intersection.Stippling denotes the 95%confidence level.
Figure 2 shows the spatial features of the trends in 850–200 hPa averaged w.The three datasets exhibit similar features,albeit with several regional disparities.For all three datasets,an increasing trend in ascending motion is detected over the tropical Indian Ocean,tropical eastern Pacific,and tropical South America,while a decreasing trend in ascend-ing motion is detected over northern Africa,northern Indian Ocean,and tropical central Pacific.These contrasting trends over these areas engender the asymmetric changes in STAB and NTAB.The main disparities among the three datasets in this respect are that the ERA-40 data have a trend of decreasing ascending motion over a part of the tropical eastern Pacific and the southern tropical Atlantic(Fig.2b);the JRA-55 data also have a trend of decreasing ascending motion over the southern tropical Atlantic(Fig.2c);whereas the NCEP data do not exhibit these features(Fig.2a).Moreover,the decreasing trend in ascending motion over the tropical central Pacific is of larger magnitude and extent for the NCEP data(Fig.2a).
To elucidate the abovementioned asymmetric changes in NTAB and STAB,the trends in tropical SSTs are correspondingly computed.Considering that both the NCEP and ERA-40 datasets use a combination of the ERSST.v4 and HadISST datafortheirboundaryforcing(Kalnayetal.,1996;Uppalaet al.,2005)while JRA-55 uses COBE(Kobayashi et al.,2015),we examine the trends in the three SST datasets for the period 1958–2001.As shown in Fig.3,the trends in tropical SSTs also demonstrate a meridional asymmetry,characterized by a relatively large(small)warming trend to the south(north)of the HC intersection.Specifically,in contrast to the overall warming trend in tropical SSTs,there is a cooling trend and/or relatively small warming trend in the northern central Pacific(NCP)and northern tropical Atlantic,which contributes to the meridional asymmetry in tropical SST trends.This cooling trend and/or small warming trend in the NCP and northern tropical Atlantic is consistent with the decreasing ascending motion over these areas as mentioned previously(Fig.2),suggesting an influence of the asymmetric warming trends in tropical SSTs on the asymmetric changes in TABs.Furthermore,the pattern correlations between the trends in w(Fig.2)and the trends in SST(Fig.3)are computed.For the NCEP data,the correlation between the w trends and the ERSST.v4(HadISST)trends has a correlation coefficient of−0.39(−0.45);for the ERA-40 data,the correlation between the w trends and the ERSST.v4(HadISST)trends has a correlation coefficient of−0.14(−0.32);for the JRA-55 data,the correlation between the w trends and the COBE trends has a correlation coefficient of−0.30.All the abovementioned correlation coefficients are significant at the 99%confidence level.It should be noted that there are approximately 2000 grids used for the computation of the pattern correlation for the region(20◦S–20◦N,0◦–360◦E).Hence,the relatively small correlation coefficient of−0.14 is also significant due to the large sample size of grids.Thus,in consideration of the significant correlation between the pattern of w trends and the pattern of SST trends,the asymmetric changes in NTAB and STAB may be substantively attributed to the asymmetric warming trends in tropical SSTs.
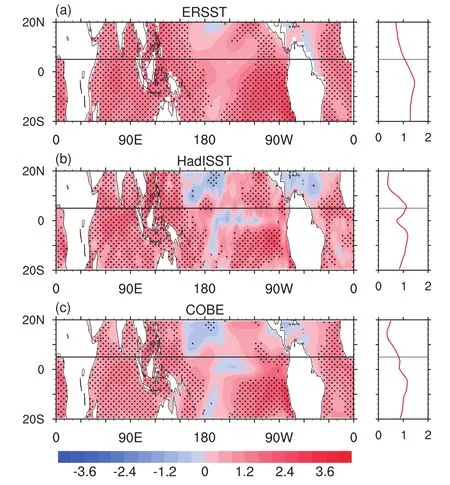
Fig.3.Trends(color shading)and global zonal mean trends(profiles)in SST during the period 1958–2001 for the(a)ERSST.v4,(b)HadISST,and(c)COBE datasets[units:◦C(100 yr)−1].Horizontal lines denote the climatology of the HC intersection.The HC intersection(5◦N)is calculated by an average of the NCEP,ERA-40,and JRA-55 data.Stippling denotes the 95%confidence level.
The temporal variations of the NTAB and STAB indices are depicted in Fig.4,indicating quite different trends and decadal-to multidecadal variability.The three reanalysis datasets show consistency in the interannual variability of NTAB/STAB,and show better consistency in STAB than NTAB regarding their linear trends and/or decadal-to multidecadal variability.Specifically,for NTAB(Fig.4a),there is a common feature among the reanalysis datasets that the NTAB decreases during the period 1958–83;meanwhile,there is a diversity among the reanalysis datasets in that the NTAB in the ERA-40 data increases during 1983–2001,whereas the NTAB intensity in the other two datasets remains stable during this period and increases after 2000.By contrast,the STAB in the three reanalysis datasets shows a persistent increase during the past several decades(Fig.4b).The correlation between the NTAB and STAB indices is examined,the results suggesting that the NTAB and STAB have an out-of-phase relationship on the interannual and decadal time scales.As shown in Table 1,the original,detrended and nine-year running mean time series of the NTAB and STAB indices all indicate a significant negative correlation,except for the nine-year running mean time series of the JRA-55 data.Hypothetically,this out-of-phase relationship might be partially or largely due to a compensatory effect that when the STAB(NTAB)is strengthened,the NTAB(STAB)would be weakened to compensate the increased mass convergence in the lower levels and the increased mass divergence in the upper levels of STAB(NTAB).However,what role do tropical SSTs play in this relationship?The following section endeavors to clarify this question.
4.Tropical SST–NTAB/STAB relationship on the interannual and decadal-to multidecadal scales
4.1.Interannual scale
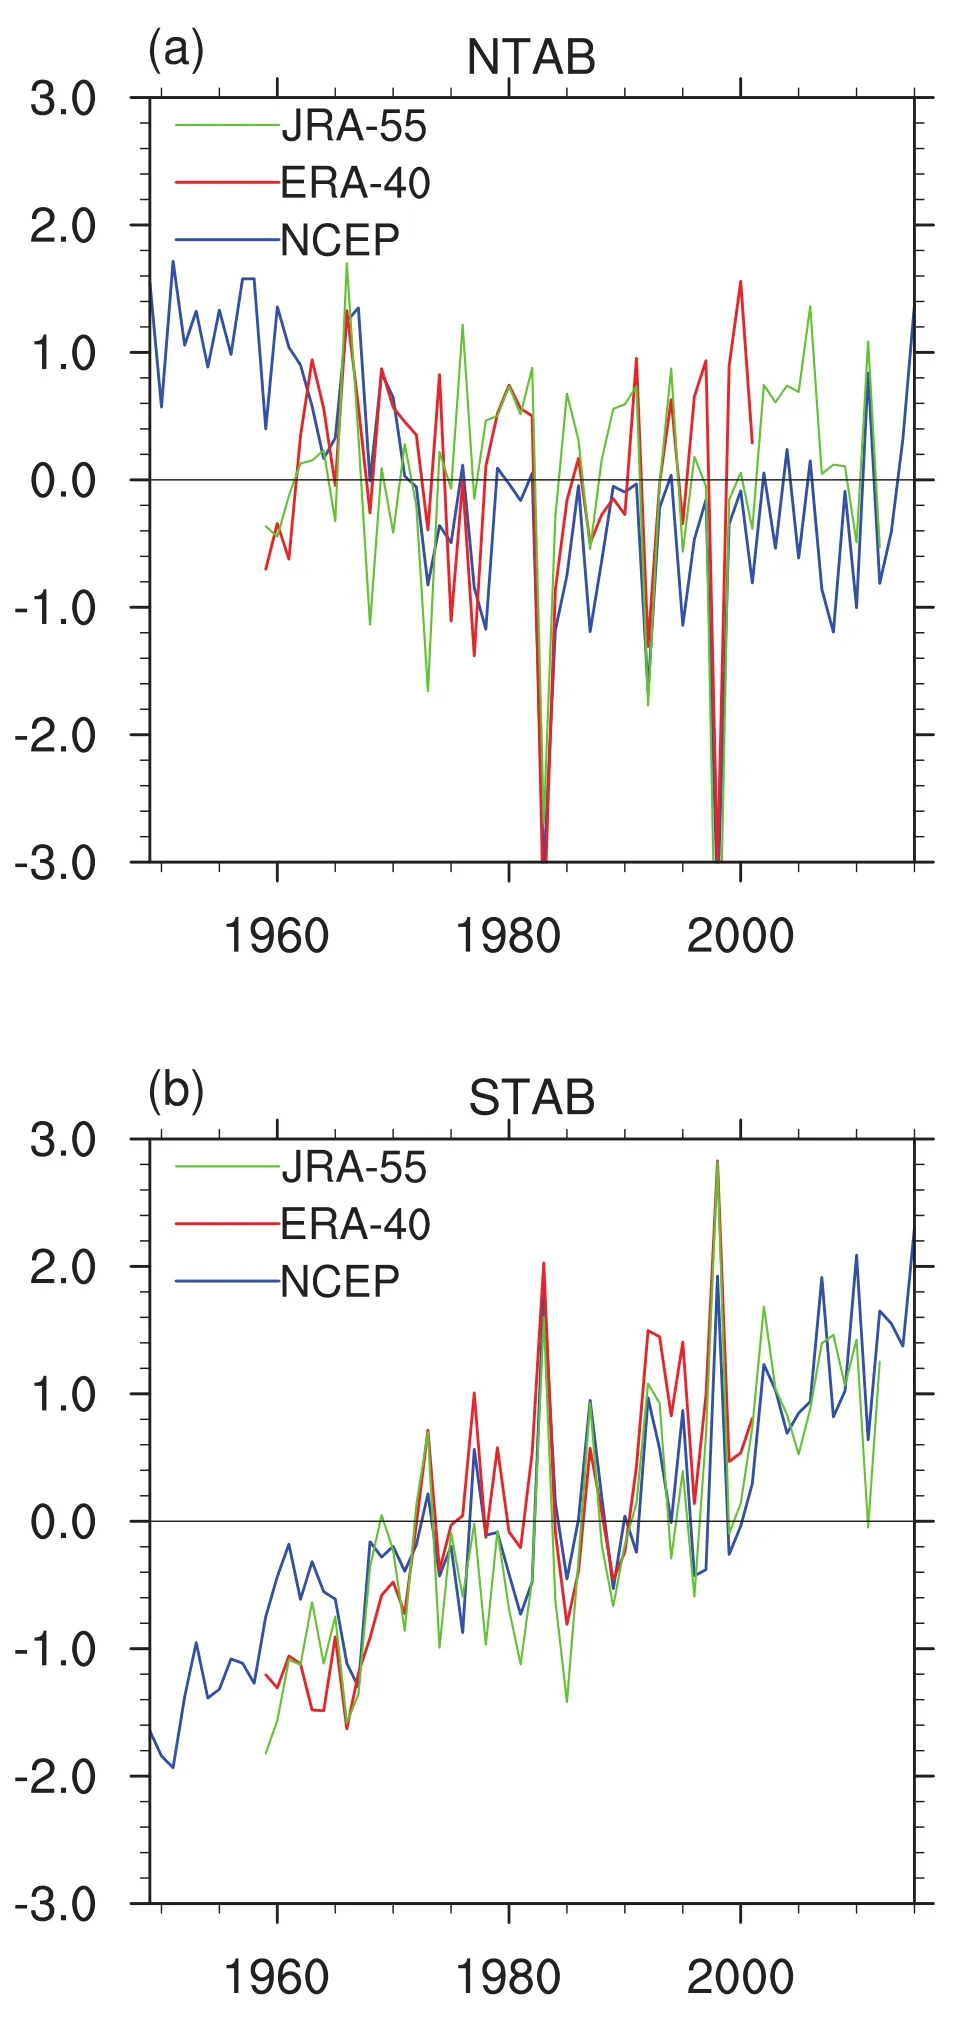
Fig.4.Normalized time series of the(a)NTAB and(b)STAB indices.Horizontal axis represents time.

Table 1.Correlation coefficients between the NTAB and the STAB time series.Numbers in bold are significant at the 95%confidence level.
To illuminate the tropical SST–NTAB/STAB relationship regarding their interannual variability,wefirst examine the 850–200 hPa averaged w and the SST patterns regressed on the detrended NTAB and STAB indices to illustrate the key regions influencing the interannual variability of NTAB and STAB.As shown in Fig.5,the w anomalies associated with NTAB are mainly characterized by negative(positive)anomalies over the Pacific region north(south)of the HC intersection(Figs.5a,c and e),while it is opposite for the w anomalies associated with STAB(Figs.5b,d and f).The w anomalies over the tropical Indian Ocean and tropical Atlantic are mostly insignificant.Thus,the interannual variability of NTAB and STAB is essentially modulated by the vertical motion over the tropical Pacific.Correspondingly,the SST anomalies associated with NTAB feature positive(negative)anomalies in the central(eastern)Pacific region north(south)of the HC intersection(Figs.6a,c and e),while it is opposite for the SST anomalies associated with STAB(Figs.6b,d and f).These SST anomalies are reminiscent of the El Ni˜no/La Ni˜na pattern,which dominates the interannual variability of tropical and extratropical climate(Wang,2002;Wang et al.,2000,2013,2016a;Wang and He,2012;He and Wang,2013;Ward et al.,2014).To compare with the ENSO-related SST anomalies,we further compute the SST anomalies regressed on the detrended Ni˜no3.4,Ni˜no4 and Ni˜no1+2 indices(figures not shown),which are defined as the(5◦S–5◦N,170◦–120◦W),(5◦S–5◦N,160◦E–150◦W)and(10◦S–0◦,90◦–80◦W)areal mean SST,respectively.The results indicate that the SST anomalies regressed on the Ni˜no1+2 index mimic the SST anomalies associated with NTAB/STAB,suggesting a close relationship between the eastern-Pacific type of ENSO and the interannual variability of NTAB/STAB.The SST anomalies regressed on the Ni˜no3.4 and Ni˜no4 indices show an east–west contrasting structure and present no meridional asymmetry with respect to the HC intersection.
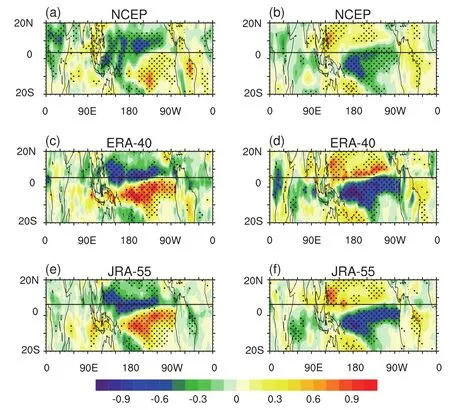
Fig.5.w anomalies regressed on the detrended and normalized time series of the(a,c,e)NTAB and(b,d,f)STAB indices(units:10−2Pa s−1):(a,b)NCEP data;(c,d)ERA-40 data;(e,f)JRA-55 data.Stippling denotes the 95%confidence level.Horizontal lines denote the climatology of the HC intersection.
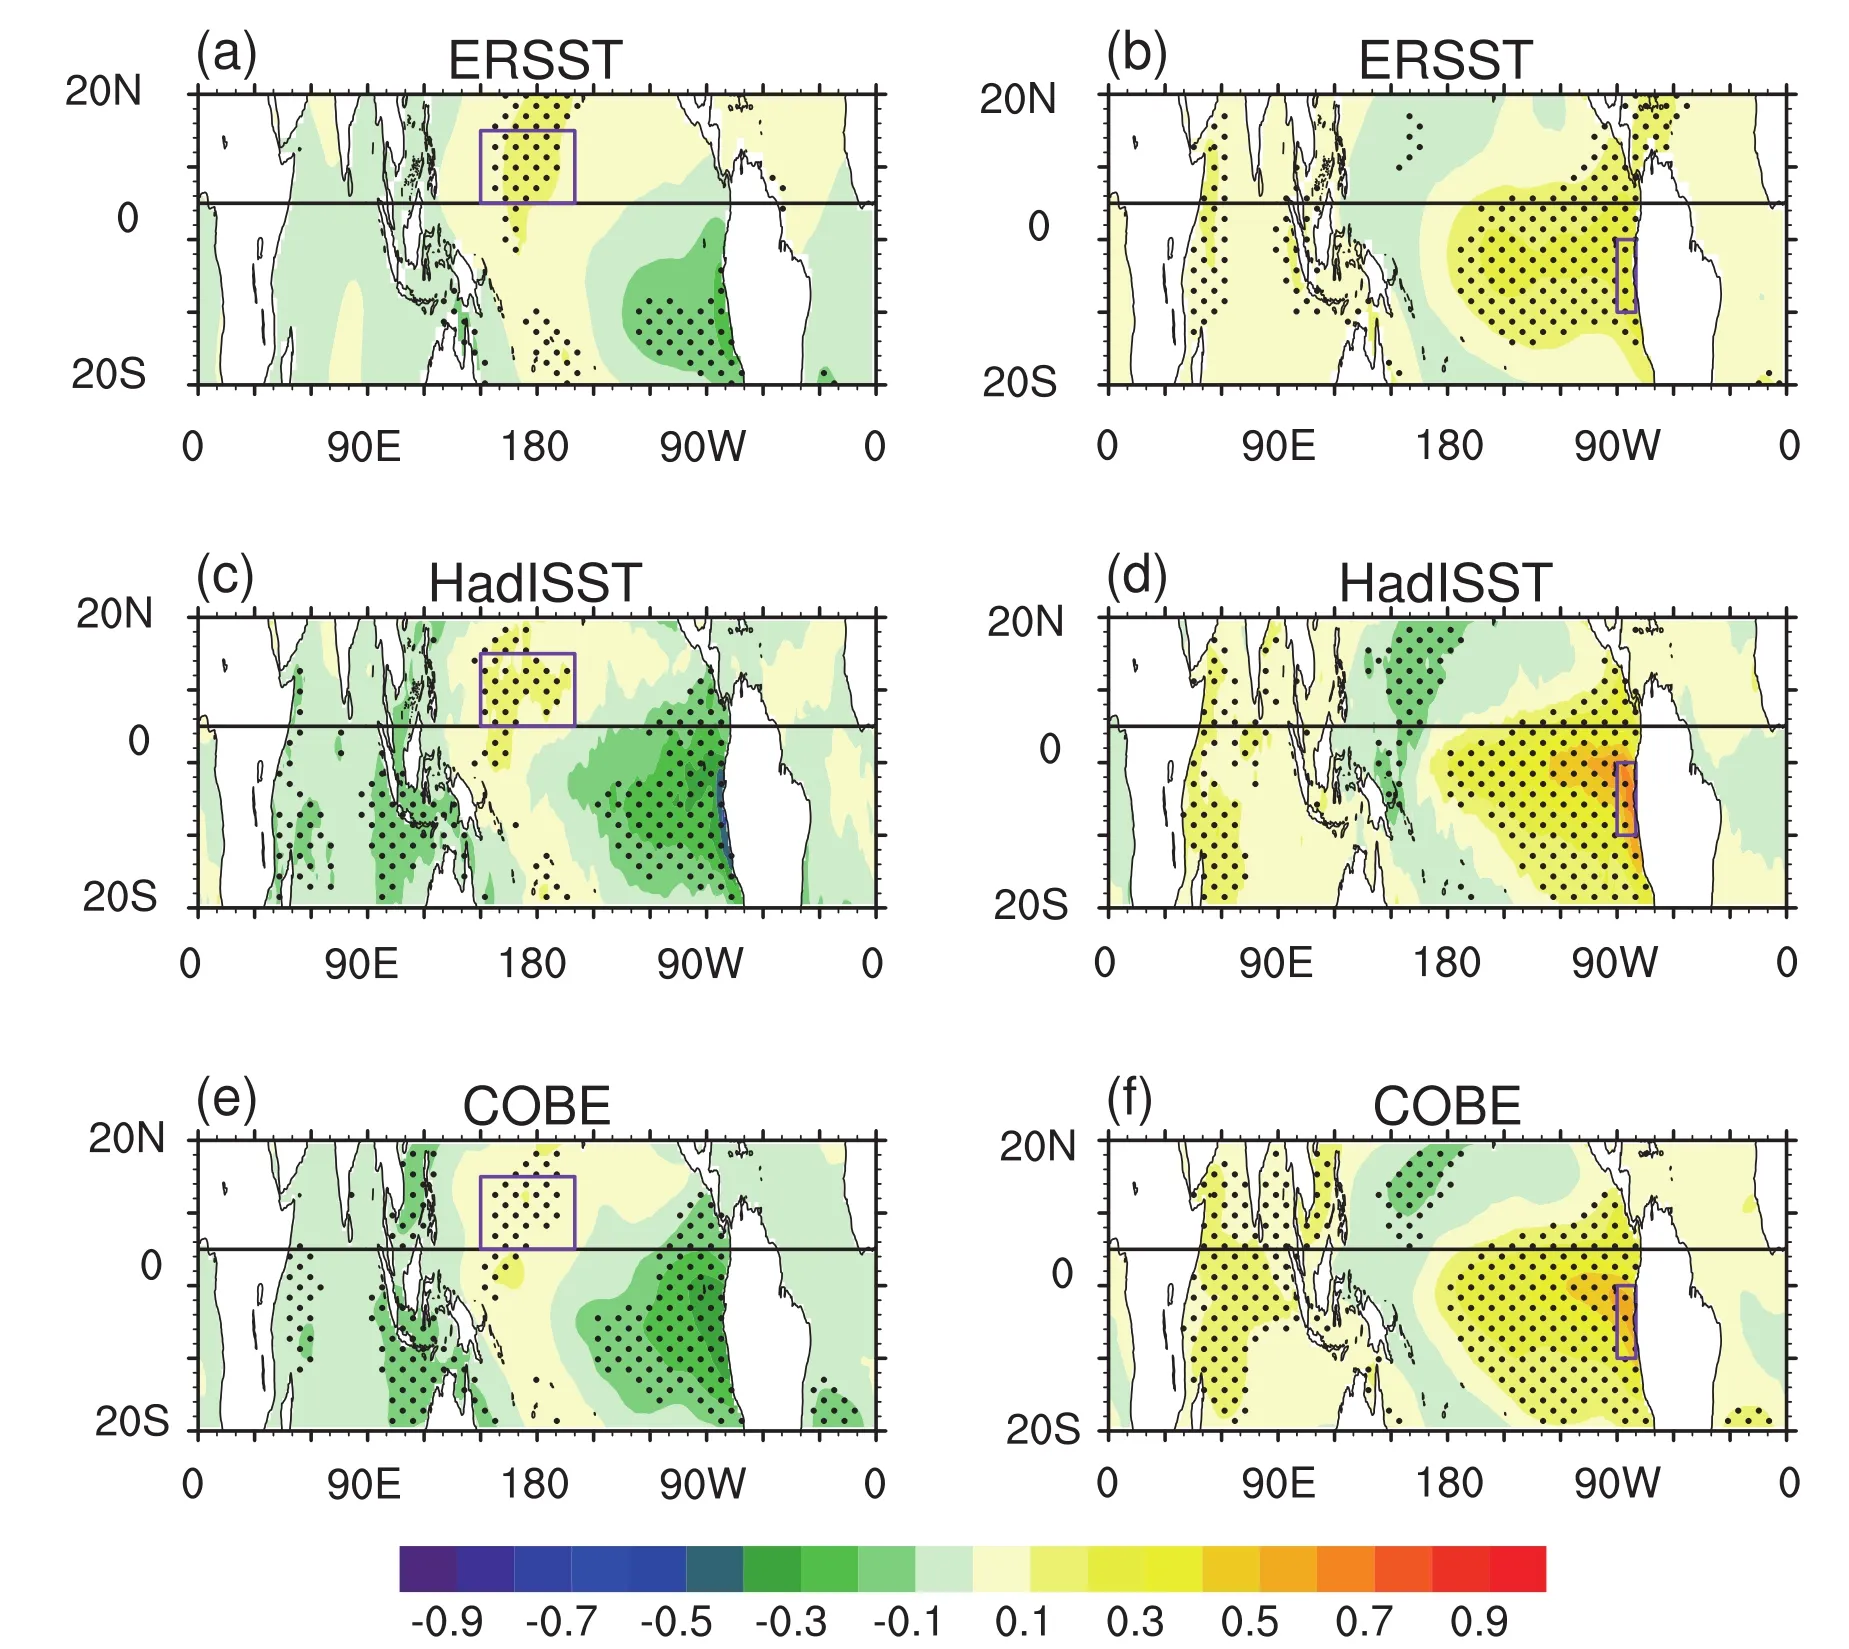
Fig.6.SST anomalies regressed on the detrended and normalized time series of the(a,c,e)NTAB and(b,d,f)STAB indices(units:◦C):(a,b)ERSST.v4 regressed on the NCEP time series;(c,d)HadISST regressed on the ERA-40 time series;(e,f)COBE regressed on the JRA-55 time series.Purple rectangles in(a,c,e)denote the NCP region,and purple rectangles in(b,d,f)denote the Ni˜no1+2 region.Stippling denotes the 95%confidence level.Horizontal lines denote the climatology of the HC intersection.

Table 2.Correlation coefficients among the NTAB/STAB time series,the Ni˜no1+2 index,and the NCP(5◦–15◦N,150◦E–160◦W)regional mean SST time series.Numbers not in brackets are for NTAB.Numbers in brackets are for STAB.Numbers in bold are significant at the 95%confidence level.
Although the SSTs in the NCP(5◦–15◦N,150◦E–160◦W)may have an impact on the NTAB(Figs.6a,c and e),our results suggest that the NCP SSTs play a role inferior to the eastern Pacific SSTs in modulating the variability of NTAB and STAB.Table 2 shows the correlation coefficients among the time series of the NTAB/STAB index,the time series of the Ni˜no1+2 index,and the time series of the NCP regional mean SST for different datasets.By and large,the Ni˜no1+2 index has a more significant relationship with both the STAB and NTAB than the NCP SST regarding different datasets and regarding the original,detrended,and nine-year running mean time series.Figure 7 shows the synthesized results calculated by averaging the corresponding numbers of different datasets in Tables 1 and 2.For the detrended time series,the correlation between NTAB and STAB is larger than the correlation between NTAB and the Ni˜no1+2 index,and is also larger than the correlation between NTAB and the NCP SST(Fig.7a),implying that the interannual variability of NTAB is essentially linked to the STAB–NTAB compensatory effect.On the other hand,the correlation between STAB and NTAB approximates the correlation between STAB and the Ni˜no1+2 index(Fig.7b),indicating equally close relationships of STAB with the two factors,i.e.,NTAB and the tropical eastern Pacific SSTs.
Hence,it is proposed that the main mechanism underlying the tropical SST–NTAB/STAB relationship regarding their interannual variability is“tropical eastern Pacific warming(cooling)→strengthened(weakened)STAB→weakened(strengthened)NTAB”,wherein the tropical eastern Pacific SSTs are the dominant factor while the NTAB is a passive factor. In this mechanism,the STAB is equally closelyrelatedtothetropicaleasternPacificSSTsandNTAB,whereas the NTAB is closely related to STAB solely,consistent with the above analysis.The dominant(passive)role of the tropical eastern Pacific SSTs(NTAB)can be attributed to an asymmetry in the interannual variability of tropical SSTs with respect to the HC intersection.Figure 8 shows the standard deviation of the detrended SSTs to denote the interannual variability of tropical SSTs.It can be seen that the tropical eastern Pacific SSTs south of the HC intersection have a noticeably larger interannual variability than the SSTs in other regions.This large interannual variability demonstrates an active role of the tropical eastern Pacific SSTs as well as the overlying STAB in the tropical SST–NTAB/STAB relationship.The SSTs north of the HC intersection have a relatively small interannual variability and thus exert less impact on the interannual variability of TABs.Therefore,the meridional asymmetry in the interannual variability of tropical SSTs(see the profiles in Fig.8)causes this active–passive relationship.
4.2.Decadal-to multidecadal scale
Asforthedecadal-tomulti-decadalvariability,theresults of nine-year running mean time series also suggest a significant relationship between the NTAB/STAB and the tropical eastern Pacific SSTs(Fig.7).However,as shown in Figs.9a and b,the NCEP and ERA-40 datasets exhibit a noticeable decrease(increase)in NTAB(STAB)during the periods 1948–80 and 1958–80,respectively,whereas the Ni˜no1+2 indices of the three SST datasets do not exhibit significant trends during these periods but have a sudden increase in the late 1970s.In addition,the STAB of the NCEP and JRA-55 datasets continues to increase after 2000,whereas the Ni˜no1+2 indices of the three SST datasets all fall after 2000(Fig.9b).These inconsistencies suggest that the decadal-to multidecadal variability of NTAB/STAB is not primarily modulated by the tropical eastern Pacific SSTs or ENSO,but by other factors.We further compute the temporal variations of the areal mean SSTs underlying the NTAB and STAB,which are termed the northern tropical SSTs(NT-SSTs;range:5◦–15◦N,0◦–360◦E)and southern tropical SSTs(ST-SSTs;range:10◦S–5◦N,0◦–360◦E),respectively.Intriguingly,the temporal variation in the difference between NT-SSTs and ST-SSTs[NT-SSTs minus ST-SSTs,hereinafter referred to as(NT-ST)SSTs],which denotes the asymmetry in the tropical SSTs with respect to the HC in-tersection,is largely consistent with the temporal variation in NTAB on the decadal-to multidecadal time scale(Fig.9c).Moreover,the ST-SSTs persistently increase during 1948–2015,which is consistent with the evolution of STAB(Fig.9d).The above results suggest that the decadal-to multidecadal variability of STAB and NTAB is closely related to the ST-SSTs and the asymmetry between NT-SSTs and STSSTs,respectively.
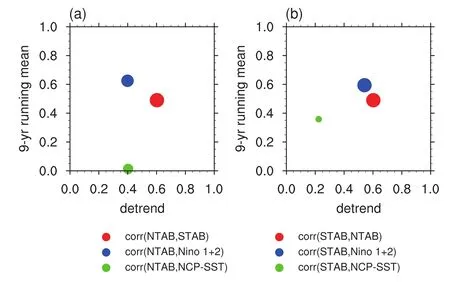
Fig.7.Synthesized results of Table 2.(a)Absolute values of the correlation coefficients among the NTAB index and the STAB,Ni˜no1+2,and NCP-SST indices.(b)Absolute values of the correlation coefficients among the STAB index and the NTAB,Ni˜no1+2,and NCP-SST indices.Horizontal axis is for detrended time series,and vertical axis is for nine-year running mean time series.The sizes of dots are proportional to the absolute values of the correlation coefficients for original time series.
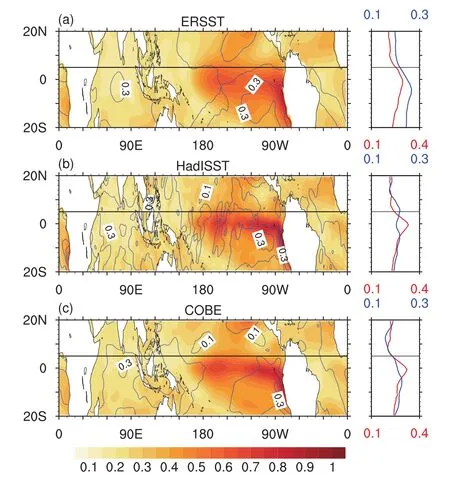
Fig.8.Standard deviation of detrended SSTs(color shading)and nine-year running mean SSTs(blue contours)for(a)ERSST.v4,(b)HadISST,and(c)COBE during the period 1948–2015.Profiles denote the corresponding global zonal mean standard deviation–red profiles for detrended SSTs;blue profiles for nine-year running mean SSTs.Horizontal lines denote the climatology of the HC intersection.
The correlation between NTAB/STAB and SSTs is examined using the three reanalysis datasets and the three SST datasets.The average correlation between STAB and the STSSTs is larger than the average correlation between STAB and the Ni˜no1+2 index(Figs.9b and d),indicating a close relationship between STAB and the ST-SSTs on the decadalto multidecadal scale.On the other hand,the average correlation between NTAB and the(NT-ST)SSTs is equal to the average correlation between NTAB and the Ni˜no1+2 index(Figs.9a and c).This result is uncertain considering that the decadal-to multidecadal variability in the NTAB of JRA-55 data is quite different from that of the NCEP and ERA-40 data during the period 1960–90(Fig.9a).If only considering the NCEP and ERA-40 data,the average correlation between NTAB and the(NT-ST)SSTs is larger than the average correlation between NTAB and the Ni˜no1+2 index(Figs.9a and b).Thus,the decadal-to multidecadal variability of NTAB/STAB is more related to the global tropical SSTs as well as their meridional asymmetry than the tropical eastern Pacific SSTs,which is different from the tropical SSTNTAB/STAB relationship of interannual variability.
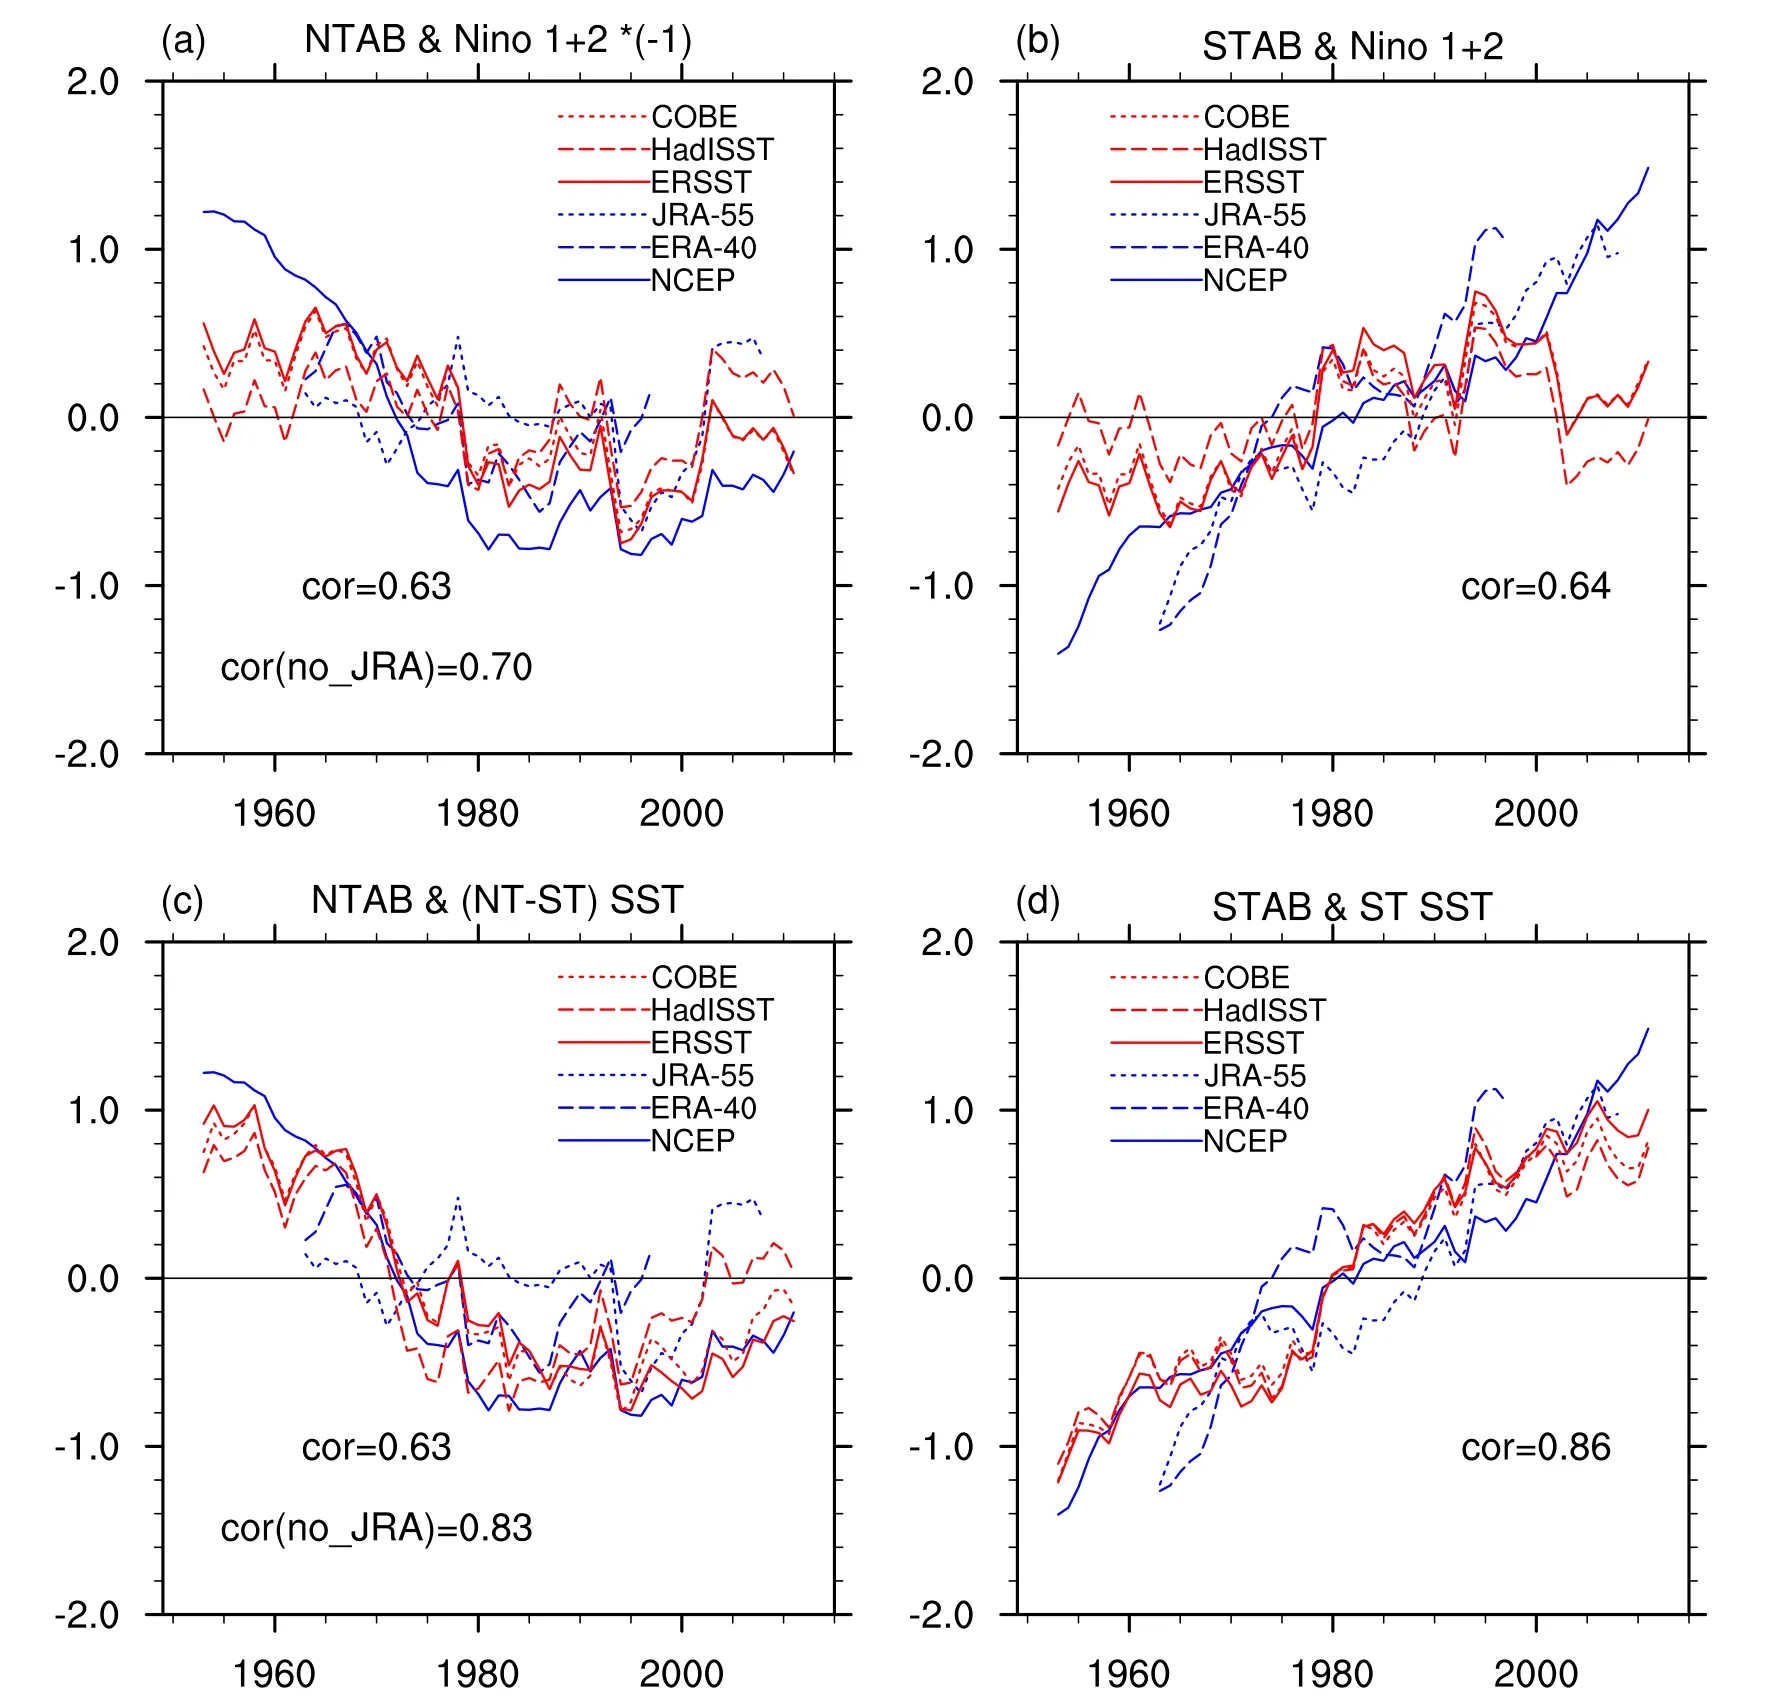
Fig.9.Nine-year running mean time series of the(a)NTAB and(Ni˜no1+2)×(−1)indices,the(b)STAB and Ni˜no1+2 indices,the(c)NTAB and(NT-ST)SST indices,and the(d)STAB and ST-SST indices.All time series are normalized.Blue lines represent the NTAB/STAB indices in reanalysis data.Red lines represent the SST indices.Horizontal axis represents time.The average correlation coefficients between NTAB/STAB and the SST indices are labeled in corresponding subplots.The average correlation coefficients excluding the JRA-55 data are additionally labeled in(a)and(c).
The reason why the decadal-to multidecadal variability of NTAB/STAB is closely related to global tropical SSTs rather than tropical eastern Pacific SSTs is because the decadal-to multidecadal variability of the SSTs in the tropical Indian Ocean,tropical western Pacific,and tropical eastern Atlantic is as large as the decadal-to multidecadal variability of the SSTs in tropical eastern Pacific(Fig.8),which means that the global tropical SSTs all have an important impact on the decadal-to multidecadal variability of tropical climate.As shown in Fig.8,the standard deviation of nineyear running mean SSTs have similar values over the tropical Pacific and tropical Indian Ocean,indicating equivalent amplitudes of the decadal-to multidecadal variability in global tropical SSTs,which is distinct from the SST standard deviation distribution for interannual variability.
Another question is why the STAB is closely related to the ST-SSTs while the NTAB is closely related to the(NTST)SSTs regarding their decadal-to multidecadal variability?Similar to the tropical SST–NTAB/STAB relationship of interannual variability,this tropical SST–NTAB/STAB relationship of decadal-to multidecadal variability may also be attributable to a meridional asymmetry of the decadal-to multidecadal variability in tropical SSTs.As shown in Fig.8,the zonal mean standard deviation of nine-year running mean SSTs exhibits a meridional asymmetry with respect to the HC intersection,which features a relatively large(small)standard deviation of the ST-SSTs(NT-SSTs).This asymmetry is significant in ERSST.v4 and COBE and less significant in HadISST(profiles in Fig.8).The larger(smaller)standard deviation of the ST-SSTs(NT-SSTs)indicates a dominant(minor)role of the ST-SSTs(NT-SSTs)in the tropical SST–NTAB/STAB relationship on the decadal-to multidecadal scale.Hence,the STAB is essentially dominated by the underlying ST-SSTs,whereas the NTAB is influenced by the direct but minor forcing of underlying NT-SSTs and the indirect but large forcing of ST-SSTs mediated by the STAB,i.e.,the compensatory effect.Therefore,the decadalto multidecadal variability of NTAB is a consequence of the net forcing of NT-SSTs and ST-SSTs.
5. Associated effects
5.1.Southward shift of the HC intersection
The strengthening(weakening)of STAB(NTAB)led to a southward shift of the HC intersection during past decades.As shown in Fig.10,the NCEP data exhibit a remarkable southward shift of the HC intersection,while the ERA-40 and JRA-55 data exhibit an observable but less remarkable southward shift of the HC intersection.The southernmost positions of the HC intersection occur in two very strong El Ni˜no years of 1982/83 and 1997/98,which are concurrent with the two strongest(weakest)STAB(NTAB)years(Fig.4),demonstrating the influence of ENSO on the interannual variability of the HC intersection and NTAB/STAB intensity.
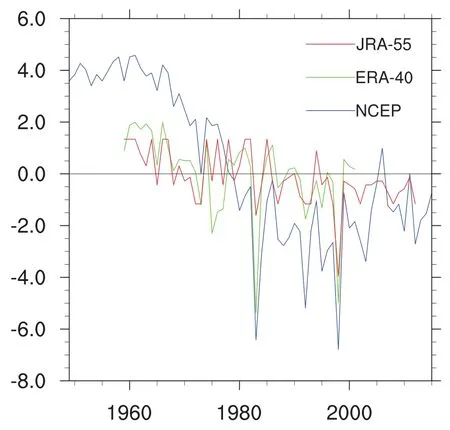
Fig.10.Time series of the anomalies of the HC intersection in reanalysis data(units:degrees latitude).The anomalies are calculated with respect to the 1958–2001 climatology.Horizontal axis represents time.Vertical axis represents anomalies in degrees of latitude.
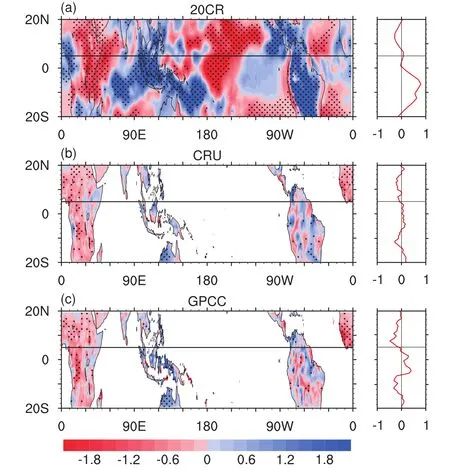
Fig.11.Trends(color shading)and global zonal mean trends(profiles)in precipitation during the period 1951–2013 for the(a)20CR,(b)CRU TS3.24,and(c)GPCC datasets[units:mm d−1(100 yr)−1].Stippling denotes the 95%confidence level.
The southward shift of the HC intersection implies a southward shift of the ITCZ,which represents tropical deep convection as well as tropical maximal rainfall.Hwang et al.(2013)documented a perceptible southward shift of the tropical rain belt during 1930–2000.Here,the trends of precipitation in 20CR(global ocean and land),CRU TS3.24(global land),and GPCC(global land)during the period 1951–2013 are shown.As shown in Fig.11a,the 20CR data present an increasing(decreasing)trend of precipitation over most of the regions south(north)of the HC intersection,including the Maritime Continent,Indian Ocean,and South America(North Africa,NCP,and northern tropical Atlantic).The trends in the CRU TS3.24 and GPCC data have less signifi-canceovermostareas,resemblingthetrendsinthe20CRdata over Africa and the Maritime Continent in terms of the signs of trends(Figs.11b and c).Overall,the profiles of the zonal mean trends in these three precipitation datasets all indicate a meridional asymmetry with respect to the HC intersection,due to the asymmetric changes in NTAB and STAB,although this asymmetry in the CRU TS3.24 data is very small(Fig.11b).
5.2.Effects on the upper-level poleward air transport of HC
The HC plays an important role in transporting momentum and energy to the extratropical regions in both hemispheres,which exert considerable impact on global climate(Schneider et al.,2010;Feng et al.,2016).The upper-level poleward branches of the HC dominate the energy transport of the HC due to the large potential energy of the upperlevel air masses(Schneider et al.,2014).As shown in Fig.1,the upper-level poleward air transport of the HC mainly occurs between the 300 hPa and the 100 hPa pressure levels.Hence,the 300–100 hPa averaged meridional winds are computed to denote the upper-level meridional air transport of HC.Figure 12 shows the temporal evolution of the 300–100 hPa averaged meridional winds in the reanalysis data.It can be seen that the upper-level poleward air transport of the NH(SH)HC resides within 5◦–30◦N(30◦S–5◦N).The three reanalysis datasets consistently exhibit a continuous increase in the NH HC upper-level meridional winds,whereas they show less consistency in the decadal-to multidecadal variation of the SH HC upper-level meridional winds.This reflects the persistent increase in STAB and the less consistency in the decadal-to multidecadal variability of NTAB among the three reanalysis datasets,respectively(Fig.4).
Hence,the time series of the NH and SH HCs’upperlevel meridional winds are computed and compared with the STAB/NTAB time series.As shown in Fig.13,for all three reanalysis datasets,the NTAB(STBA)is significantly correlated with the SH(NH)HC’s upper-level meridional winds on both the interannual and decadal-to multidecadal time scales.The results of 300–100 hPa vertically integrated meridional air massflux are nearly the same as the results of the 300–100 hPa averaged meridional winds.It is somewhat unexpected to see that the NH HC’s upper-level meridional winds are closely related to the SH HC’s ascending branch instead of the NH HC’s ascending branch,and vice versa.This cross-hemispheric relationship suggests an important effect of the HC on its counterpart hemisphere’s climate.A possible mechanism for this cross-hemispheric relationship is that over the tropics,when the NTAB is strengthened and the STAB is weakened,the tropopause height over the NTAB would be correspondingly increased while the tropopause height over the STAB would be decreased,which would result in an anomalous slope of pressure/temperature in the upper levels that leads to an increased pressure/temperature gradient towards the South Pole;consequently,the upperlevel southward winds of the SH HC would be enhanced as a result of this anomalous pressure/temperature gradient.The opposite is true of a weakened NTAB and a strengthened STAB.As such,a strengthened NTAB(STAB)would cause an enhanced upper-level poleward air transport of the SH(NH)HC.However,this mechanism needs further examination and further studies are warranted to understand this cross-hemispheric relationship.

Fig.12.Evolution of the global zonal mean 300–100 hPa averaged meridional winds(units:m s−1)in the(a)NCEP,(b)ERA-40,and(c)JRA-55 datasets.Black contours denote zero lines.Contours are smoothened by a three-year running mean to more clearly show the decadal-to multidecadal variability.
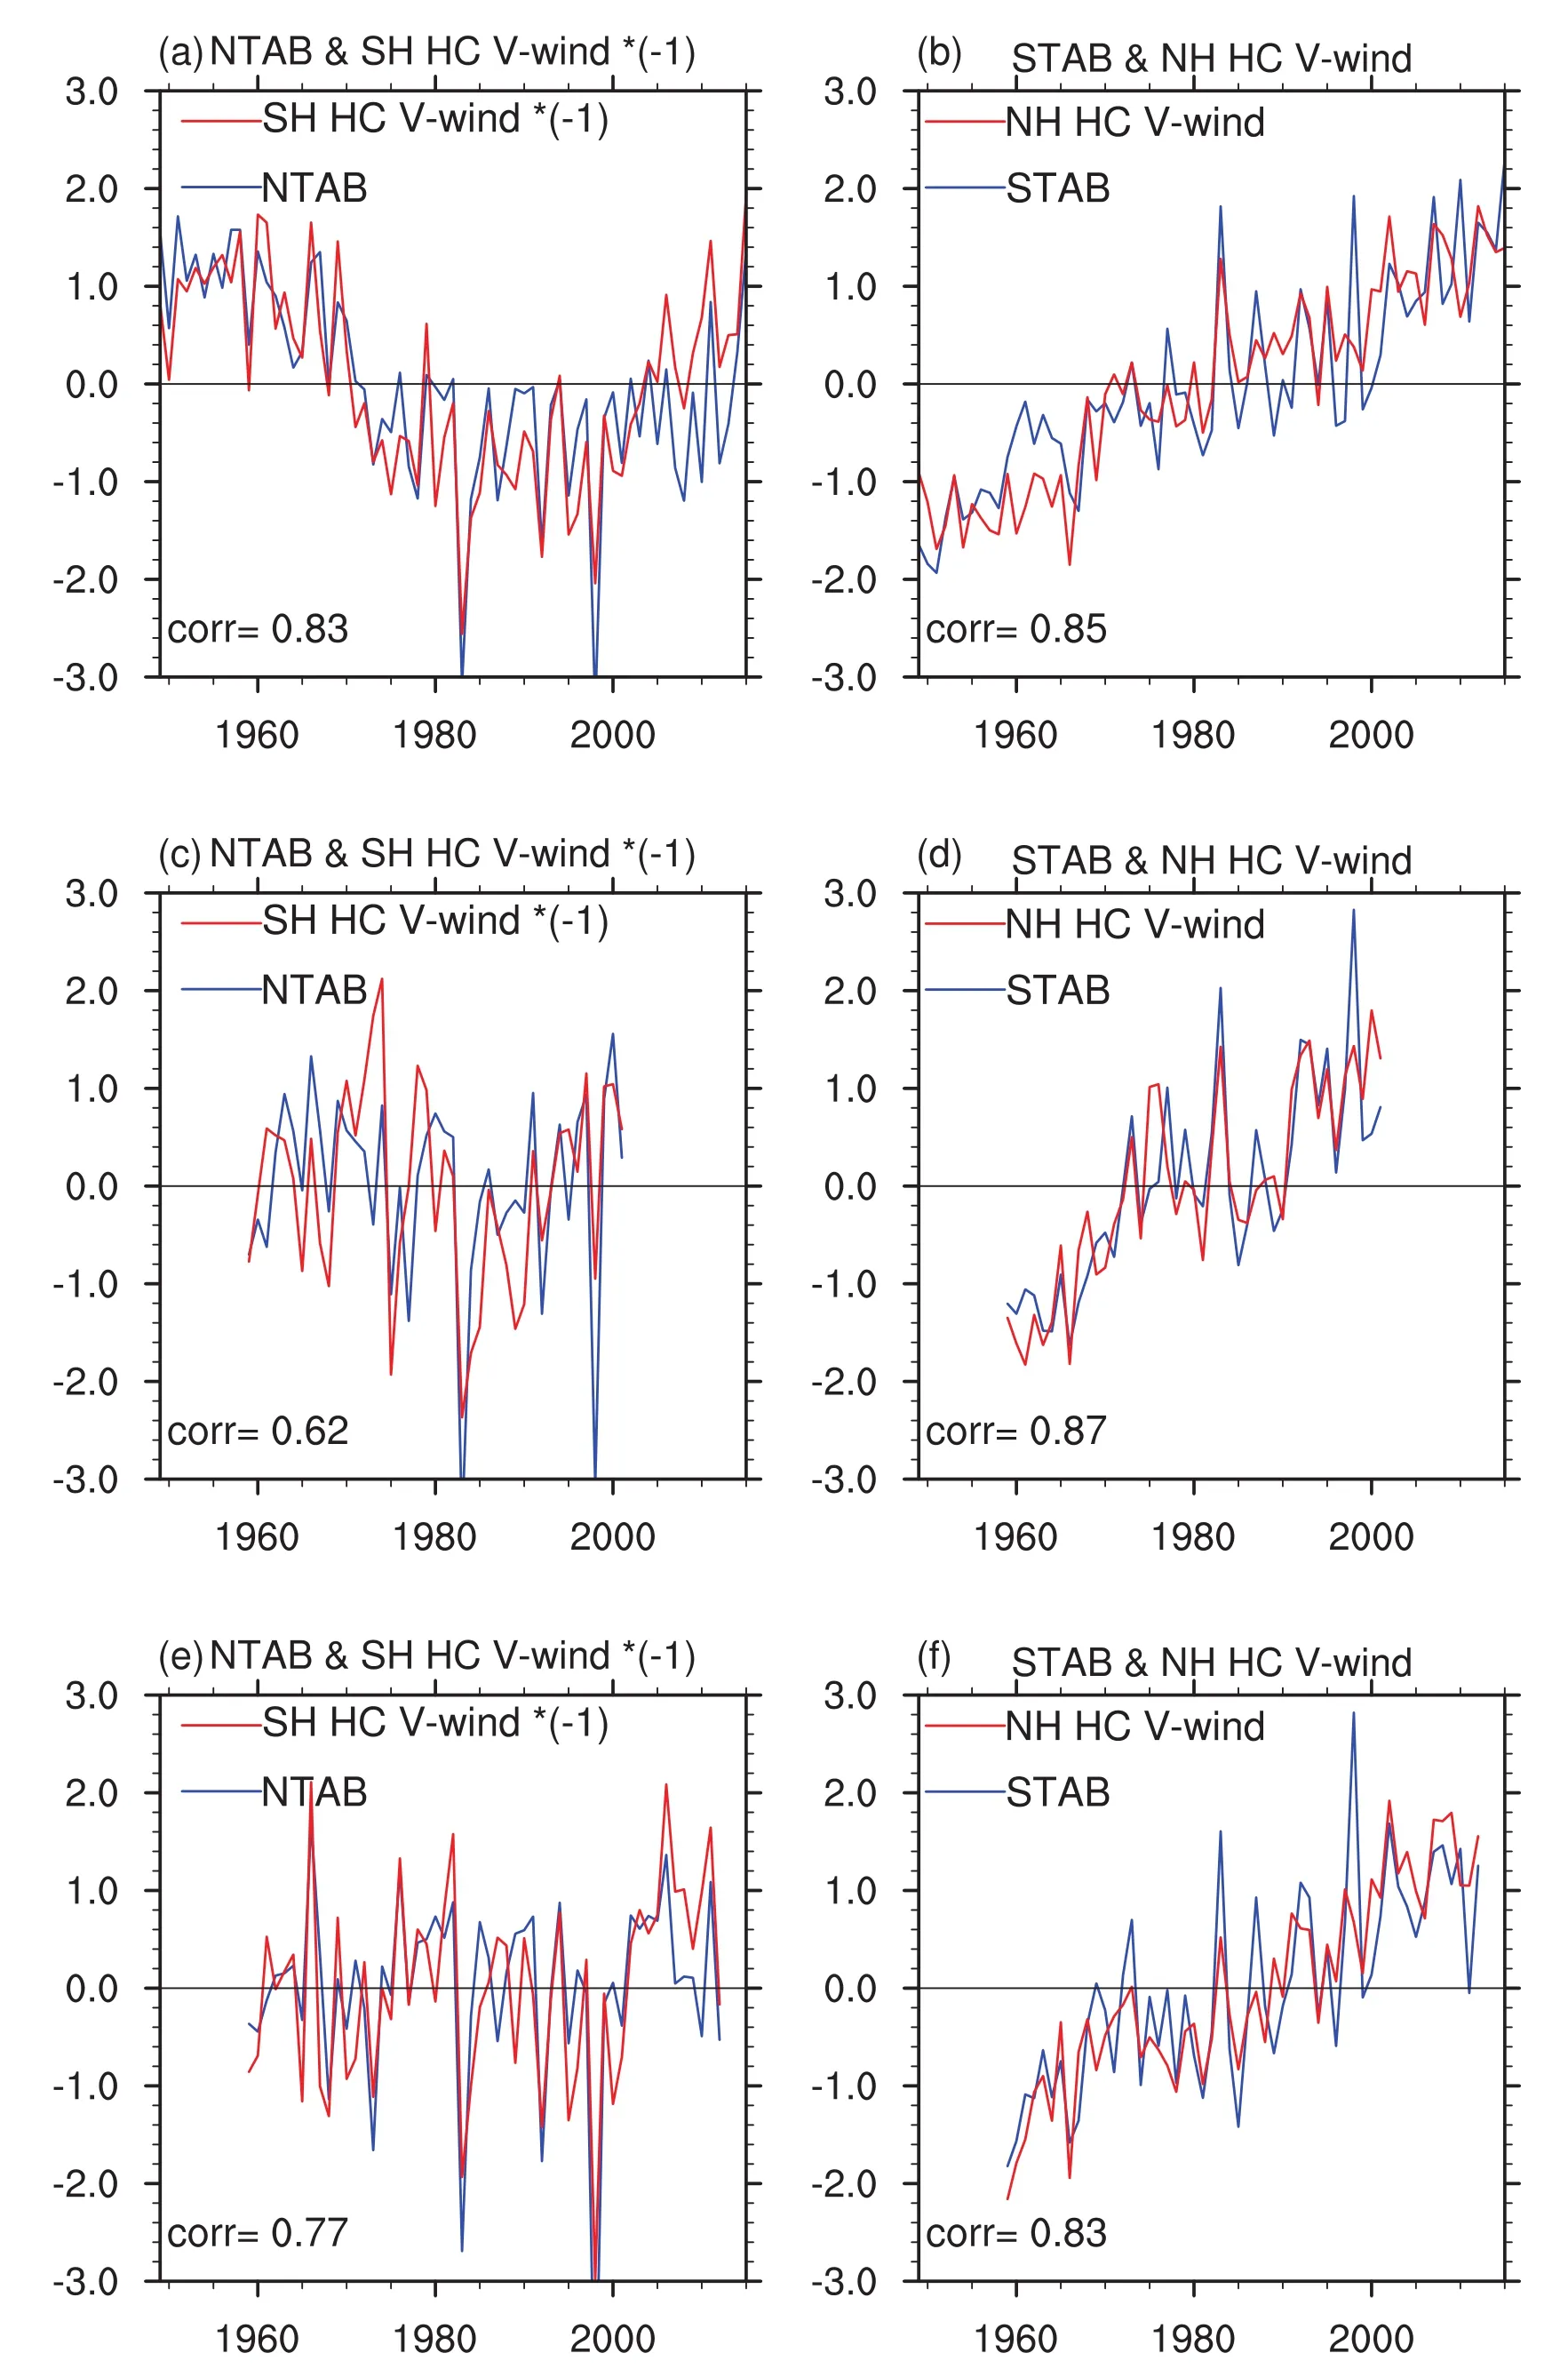
Fig.13.Time series of the(a,c,e)NTAB index and SH HC 300–100 hPa averaged southward winds[i.e.,v-wind × (−1)]and the(b,d,f)STAB index and NH HC 300–100 hPa averaged northward winds.All time series are normalized.Corresponding correlation coefficient is labeled in the bottom-left corner.(a,b)NCEP data;(c,d)ERA-40 data;(e,f)JRA-55 data.
6.Conclusion and discussion
The current study reveals asymmetric variations in the NTAB and STAB during past decades and their relationship with tropical SSTs based on a variety of datasets.The mainfindings of this study are:
(1)The NCEP,ERA-40 and JRA-55 datasets consistently showapersistentincreaseinSTABfromthe1950stopresent,whereas they show less consistency in the decadal-to multidecadal variability of NTAB,which exhibits a declining trend during 1958–2001.
(2)On the interannual time scale,the variability of NTBA/STAB is essentially modulated by the eastern-Pacific type of ENSO,with a strengthened(weakened)STAB(NTAB)under an El Ni˜no condition;the tropical eastern Pacific SSTs dominate the tropical SST–NTAB/STAB relationship due to their larger interannual variability than the SSTs in other regions.
(3)On the decadal-to multidecadal time scale,the variability of STAB and NTAB is closely related to ST-SSTs and(NT-ST)SSTs,respectively;the ST-SSTs dominate the tropical SST–NTAB/STAB relationship due to their larger decadal-to multidecadal variability than the NT-SSTs.
(4)The asymmetric variations in NTAB and STAB have several effects,including a southward shift of the HC intersection as well as tropical rainbelt over land and oceans and asymmetric variations in the upper-level poleward air transport of HCs,which is associated with a cross-hemispheric relationship between the NTAB/STAB and the upper-level meridional winds of HCs.
Thesefindings are conducive to a better understanding of tropical air–sea interactions as well as the related global climate changes.
This study focuses on the changes in NTAB/STAB and their relationship with tropical SSTs,with little discussion on other influential factors of the TABs.For instance,the mean advection of stratification change(MASC)may also contribute to the weakening of NTAB(Ma et al.,2012).Under the condition that the tropical troposphere warms following the moist adiabat the MASC tends to cause cooling and warming over the climatological convective and subsidence regions,respectively(Ma et al.,2012).This cooling effect on tropical convection regions might partially explain the weakening of NTAB.Essentially,the asymmetric variations in the TABs and poleward mass/energy transport of HCs may be caused by an imbalance of radiative forcing between the NH and the SH during the 20th century(Yoshimori and Broccoli,2009;Friedman et al.,2013;Hwang et al.,2013;Wang et al.,2016b).Thus,further investigation on the variations of radiative forcing in the NH and SH will shed more light on the issues discussed in this study.
This study pays little attention to the variability in seasonal NTAB/STAB.These preliminary results suggest that the trends of tropical SSTs in all seasons present a meridional asymmetry similar to that of the trends of annual mean SST,as do the TABs.These changes may exert different impacts on seasonal HCs and their associated dynamic processes because the location of the HC varies with the seasons.Further studies are needed to clarify these questions.
Acknowledgements.This study was supported by the National Natural Science Foundation of China(Grant Nos.41421004 and 41210007),the Atmosphere–Ocean Research Center(AORC)and International Pacific Research Center(IPRC)at the University of Hawaii,and the General Program of Natural Science Foundation of Higher Education of Jiangsu Province(Grant No.3KJB170012).
Adam,O.,T.Schneider,and N.Harnik,2014:Role of changes in mean temperatures versus temperature gradients in the recentwideningoftheHadleycirculation.J.Climate,27,7450–7461,https://doi.org/10.1175/JCLI-D-14-00140.1.
Diaz,H.F.,and B.Bradley,2004:The Hadley Circulation:Present,Past and Future.Vol 21,Advances in Global Change Research,1–5,https://doi.org/10.1007/978-1-4020-2944-8.
Dima,I.M.,and J.M.Wallace,2003:On the seasonality of the Hadley cell.J.Atmos.Sci.,60,1522–1527,https://doi.org/10.1175/1520-0469(2003)060<1522:OTSOTH>2.0.CO;2.
Feng,J.,J.P.Li,F.F.Jin,Z.Y.Liu,X.Nan,and Y.P.Guo,2016:Contrasting responses of the Hadley circulation to equatorially asymmetric and symmetric meridional sea surface temperature structures.J.Climate,29,8949–8963,https://doi.org/10.1175/JCLI-D-16-0171.1.
Friedman,A.R.,Y.-T.Hwang,J.C.H.Chiang,andD.M.W.Frierson,2013:Interhemispheric temperature asymmetry over the twentieth century and in future projections.J.Climate,26,5419–5433,https://doi.org/10.1175/JCLI-D-12-00525.1.
Guo,Y.-P.,and J.-P.Li,2016:Impact of ENSO events on the interannual variability of Hadley circulation extents in boreal winter.Advances in Climate Change Research,7,46–53,https://doi.org/10.1016/j.accre.2016.05.001.
Guo,Y.P.,J.P.Li,J.Feng,F.Xie,C.Sun,and J.Y.Zheng,2016:The multidecadal variability of the asymmetric mode of the boreal autumn Hadley circulation and its link to the Atlantic multidecadal oscillation.J.Climate,29,5625–5641,https://doi.org/10.1175/JCLI-D-15-0025.1.
He,J.,and B.Soden,2015:Anthropogenic weakening of the tropical circulation:The relative roles of direct CO2forcing and sea surface temperature change.J.Climate,28,8728–8742,https://doi.org/10.1175/JCLI-D-15-0205.1.
He,S.P.,and H.J.Wang,2013:Oscillating relationship between the East Asian winter monsoon and ENSO.J.Climate,26,9819–9838,https://doi.org/10.1175/JCLI-D-13-00174.1.
Held,I.M.,and B.J.Soden,2006:Robust responses of the Hydrological cycle to global warming.J.Climate,19,5686–5699,https://doi.org/10.1175/JCLI3990.1.
Hu,Y.,and Q.Fu,2007:Observed poleward expansion of the Hadley circulation since 1979.Atmospheric Chemistry and Physics,7,5229–5236,https://doi.org/10.5194/acp-7-5229-2007.
Huang,B.Y.,and Coauthors,2015:Extended Reconstructed Sea Surface Temperature version 4(ERSST.v4).Part I:Upgrades and intercomparisons.J.Climate,28,911–930,https://doi.org/10.1175/JCLI-D-14-00006.1.
Huang,R.H.,1992:The East Asia/Pacific pattern teleconnection of summer circulation and climate anomaly in East Asia.Acta Meteorologica Sinica,6,25–37.
Hwang Y.-T.,D.M.W.Frierson,and S.M.Kang,2013:Anthropogenic sulfate aerosol and the southward shift of tropical precipitation in the late 20th century.Geophys.Res.Lett.,40,2845–2850,https://doi.org/10.1002/grl.50502.
Kalnay,E.,and Coauthors,1996: The NCEP/NCAR 40-year reanalysis project.Bull.Amer.Meteor.Soc.,77,437–470,https://doi.org/10.1175/1520-0477(1996)077<0437:TNYRP>2.0.CO;2.
Kang,S.M.,C.Deser,and L.M.Polvani,2013:Uncertainty in climate change projections of the Hadley circulation:The role of internal variability.J.Climate,26,7541–7554,https://doi.org/10.1175/JCLI-D-12-00788.1.
Kim,Y.-H.,S.-K.Min,S.-W.Son,and Jung Choi,2017:Attribution of the local Hadley cell widening in the Southern Hemisphere.Geophys.Res.Lett.,44,1015–1024,https://doi.org/10.1002/2016GL072353.
Kobayashi,S.,and Coauthors,2015:The JRA-55 reanalysis:General specifications and basic characteristics.J.Meteor.Soc.Japan,93,5–48,https://doi.org/10.2151/jmsj.2015-001.
Lau,W.K.M.,and K.-M.Kim,2015:Robust Hadley Circulation changes and increasing global dryness due to CO2warming from CMIP5 model projections.Proceedings of the National Academy of Sciences of the United States of America,112,3630–3635,https://doi.org/10.1073/pnas.1418682112.
Lu,J.,G.A.Vecchi,and T.Reichler,2007:Expansion of the Hadley cell under global warming.Geophys.Res.Lett.,34,L06805,https://doi.org/10.1029/2006GL028443.
Ma,J.,and S.-P.Xie,2013:Regional patterns of sea surface temperature change:A source of uncertainty in future projections of precipitation and atmospheric circulation.J.Climate,26,2482–2501,https://doi.org/10.1175/JCLI-D-12-00283.1.
Ma,J.,S.-P.Xie,and Y.Kosaka,2012:Mechanisms for tropical tropospheric circulation change in response to global warming.J.Climate,25,2979–2994,https://doi.org/10.1175/JCLID-11-00048.1.
Nguyen,H.,A.Evans,C.Lucas,I.Smith,and B.Timbal,2013:The Hadley circulation in reanalyses:Climatology,variability,and change.J.Climate,26,3357–3376,https://doi.org/10.1175/JCLI-D-12-00224.1.
Polvani,L.M.,D.W.Waugh,G.J.P.Correa,and S.-W.Son,2011:Stratospheric ozone depletion:The main driver of twentieth-century atmospheric circulation changes in the Southern Hemisphere.J.Climate,24,795–812,https://doi.org/10.1175/2010JCLI3772.1.
Quan,X.-W.,H.F.Diaz,and M.P.Hoerling,2004:Change in the tropical Hadley cell since 1950.The Hadley Circulation:Present,Past and Future,Z.F.Diaz and R.S.Bradley,Eds.,Springer,Dordrecht,85–120,https://doi.org/10.1007/978-1-4020-2944-84.
Rayner,N.A.,D.E.Parker,E.B.Horton,C.K.Folland,L.V.Alexander,D.P.Rowell,E.C.Kent,and A.Kaplan,2003:Global analyses of sea surface temperature,sea ice,and night marine air temperature since the late nineteenth century.J.Geophys.Res.,108,4407,https://doi.org/10.1029/2002JD002670.
Schneider,T.,P.A.O’Gorman,and X.J.Levine,2010:Water vapor and the dynamics of climate changes.Rev.Geophys.,48,RG3001,https://doi.org/10.1029/2009RG000302.
Schneider,T.,T.Bischoff,and G.H.Haug,2014:Migrations and dynamics of the intertropical convergence zone.Nature,513,45–53,https://doi.org/10.1038/nature13636.
Singh,M.S.,Z.M.Kuang,and Y.Tian,2017:Eddy influences on the strength of the Hadley circulation:Dynamic and thermodynamic perspective.J.Atmos.Sci.,74,https://doi.org/10.1175/JAS-D-16-0238.1.
Stanfield,R.E.,and Coauthors,2016:A quantitative assessment of precipitation associated with the ITCZ in the CMIP5 GCM simulations.Climate Dyn.,47,1863–1880,https://doi.org/10.1007/s00382-015-2937-y.
Sun,B.,and H.J.Wang,2015:Inter-decadal transition of the leading mode of inter-annual variability of summer rainfall in East China and its associated atmospheric water vapor transport.Climate Dyn.,44,2703–2722,https://doi.org/10.1007/s00382-014-2251-0.
Tao,L.J.,Y.Y.Hu,and J.P.Liu,2016:Anthropogenic forcing on the Hadley circulation in CMIP5 simulations.Climate Dyn.,46,3337–3350,https://doi.org/10.1007/s00382-015-2772-1.
Tokinaga,H.,S.-P.Xie,A.Timmermann,S.McGregor,T.Ogata,H.Kubota,and Y.M.Okumura,2012a:Regional patterns of tropical Indo-Pacific climate change:Evidence of the Walker circulation weakening.J.Climate,25,1689–1710,https://doi.org/10.1175/JCLI-D-11-00263.1.
Tokinaga,H.,S.-P.Xie,C.Deser,Y.Kosaka,and Y.M.Okumura,2012b:Slowdown of the Walker circulation driven by tropical Indo-Pacific warming.Nature,491,439–444,https://doi.org/10.1038/nature11576.
Uppala,S.M.,and Coauthors,2005:The ERA-40 re-analysis.Quart.J.Roy.Meteor.Soc.,131,2961–3012,https://doi.org/10.1256/qj.04.176.
Vecchi,G.A.,and B.J.Soden,2007:Global warming and the weakening of the tropical circulation.J.Climate,20,4316–4340,https://doi.org/10.1175/JCLI4258.1.
Wang,B.,R.G.Wu,and X.H.Fu,2000:Pacific-East Asian teleconnection:How does ENSO affect East Asian climate?J.Climate,13,1517–1536,https://doi.org/10.1175/1520-0442(2000)013<1517:PEATHD>2.0.CO;2.
Wang,C.Z.,C.Deser,J.-Y.Yu,P.DiNezio,and A.Clement,2016a:El Nin˜o and Southern Oscillation(ENSO):A review.Coral Reefs of the Eastern Tropical Pacific.P.Glynn et al.,Eds.,Vol 8,Coral Reefs of the World,Springer,Dordrecht,85–106,https://doi.org/10.1007/978-94-017-7499-44.
Wang,H.J.,2002:The instability of the East Asian summer monsoon-ENSO relations.Adv.Atmos.Sci.,19,1–11,https://doi.org/10.1007/s00376-002-0029-5.
Wang,H.J.,and S.P.He,2012:Weakening relationship between East Asian winter monsoon and ENSO after mid-1970s.Chinese Science Bulletin,57,3535–3540,https://doi.org/10.1007/s11434-012-5285-x.
Wang,H.J.,S.P.He,and J.P.Liu,2013:Present and fu-ture relationship between the East Asian winter monsoon and ENSO:Results of CMIP5.J.Geophys.Res.,118,5222–5237,https://doi.org/10.1002/jgrc/20332.
Wang,H.,S.-P.Xie,H.Tokinaga,Q.Y.Liu,and Y.Kosaka,2016b:Detecting cross-equatorial wind change as afingerprint of climate response to anthropogenic aerosol forcing.Geophys.Res.Lett.,43,3444–3450,https://doi.org/10.1002/2016GL068521.
Ward,P.J.,B.Jongman,M.Kummu,M.D.Dettinger,F.C.S.Weiland,and H.C.Winsemius,2014:Strong influence of El Nino Southern Oscillation onflood risk around the world.Proceedings of the National Academy of Sciences of the United States of America,111,15 659–15 664,https://doi.org/10.1073/pnas.1409822111.
Xie,S.-P.,C.Deser,G.A.Vecchi,J.Ma,H.Y.Teng,and A.T.Wittenberg,2010:Global warming pattern formation:Sea surface temperature and rainfall.J.Climate,23,966–986,https://doi.org/10.1175/2009JCLI3329.1.
Xu,Y.,and S.-P.Xie,2015:Ocean mediation of tropospheric response to reflecting and absorbing aerosols.Atmospheric Chemistry and Physics,15,5827–5833,https://doi.org/10.5194/acp-15-5827-2015.
Yancheva,G.,and Coauthors,2007:Influence of the intertropical convergence zone on the East Asian monsoon.Nature,445,74–77,https://doi.org/10.1038/nature05431.
Yoshimori,M.,and A.J.Broccoli,2009:On the link between Hadley circulation changes and radiative feedback processes.Geophys.Res.Lett.,36,L20703,https://doi.org/10.1029/2009GL040488.
杂志排行
Advances in Atmospheric Sciences的其它文章
- 2017 was the Warmest Year on Record for the Global Ocean
- Atmospheric Profiling Synthetic Observation System in Tibet
- Assimilation of Feng-Yun-3B Satellite Microwave Humidity Sounder Data over Land
- Observational Study of Surface Wind along a Sloping Surface over Mountainous Terrain during Winter
- New Method for Estimating Daily Global Solar Radiation over Sloped Topography in China
- Statistics-based Optimization of the Polarimetric Radar Hydrometeor Classification Algorithm and Its Application for a Squall Line in South China
