Observational Study of Surface Wind along a Sloping Surface over Mountainous Terrain during Winter
2018-01-29YoungHeeLEEGyuwonLEESangwonJOOandKwangDeukAHN
Young-Hee LEE,Gyuwon LEE,Sangwon JOO,and Kwang-Deuk AHN
1Department of Astronomy and Atmospheric Sciences,Kyungpook National University,Daegu 41566,Korea
2Numerical Data Application Division,Numerical Modeling Center,Seoul 07062,Korea
1.Introduction
The 2018 Winter Olympic and Paralympic Games will take place in Pyeongchang,Korea during 9–25 February and 9–18 March 2018,respectively.Outdoor games are significantly affected by weather events.Adverse weather,such as strong wind,heavy snowfall,and low visibility,might delay or postpone events associated with the Winter Olympic Games(Horel et al.,2002;Kiktev et al.,2017).Olympic outdoor venues are located on complex terrain,and hence the wind at outdoor venues is influenced by several factors,such as wind channeling,terrain-induced upslope and downslopeflow,and wake(Carruthers and Hunt,1990;Whiteman,1990).Enhanced monitoring and modeling studies for previous winter Olympics have provided opportunities to improve our ability to provide short-term winter weather forecasts or nowcasts of high-impact weather over complex terrain(e.g.,Horel et al.,2002;Joe et al.,2014;Issac et al.,2014;Luk’yanov et al.,2015).To support the 2018 Winter Olympic Games,an enhanced observation and monitoring network has been set up at the venues in Pyeongchang.Wind information is essential for the safety and security of athletes and for the proper planning and preparation of the Games.Both surface winds and wind gusts influence the jumping distance in ski jumping(e.g.,Virmavirta and Klvek¨as,2012;Teakles et al.,2014).In this study,we focus on the surface wind mechanism and wind gusts at the outdoor venues.Outdoor venues,such as the ski course and ski jumping center,show a significant surface elevation change over a small horizontal scale of hundreds of meters,which is not captured well in numerical weather prediction models.Therefore,an observational study is necessary to understand the characteristic features of the surface winds and wind gusts at the major Olympic outdoor venues.
Outdoor venues are located on sloping surfaces with significant surface elevation change,which forces changes in the pressurefield and,hence,in the wind direction and speed.The flow over hills shows different behavior depending on the Froud number of theflow(Stull,1988).At a low Froud number of<1,air would ratherflowaround a hill thanoverit.At a Froud number of 1,large-amplitude lee waves or mountain waves are formed due to natural resonance.When nearneutral air with a large Froud numberflows over a hill,theflow accelerates to the hilltop,reaches its maximum velocity above the hilltop,and then decelerates behind the hill.If the hill is steep enough in the leeward direction,flow separation occurs.Regardless offlow separation,a wake region develops behind the hill with a marked velocity deficit extending for many hill heights leeward(Jackson and Hunt,1975;Kaimal and Finnigan,1994).
During the diurnal cycle in mountainous regions,the differential heating over sloping surfaces generates thermally induced flow,such as up-and downslopeflows(Whiteman,1990).Radiativecoolingofthemountainsurfaceatnighttime cools the air adjacent to surfaces,resulting in cold downslope wind.After sunrise,solar heating warms the air near valley walls,causing warm upslope wind.Wind within a valley blows more or less parallel to the valley axis for a variety of wind directions,which is referred to as wind channeling.Whiteman and Doran(1993)discussed conceptual models for four different physical mechanisms to account for the relationship between the above-valley winds and the winds within the valley;namely,thermally driven channeling,downward momentum transport,forced channeling,and pressure-driven channeling.The wind climatology of a given valley is often the result of varying contributions of these four mechanisms.
A wind gust is defined as a short-duration wind-speed maximum(Suomi et al.,2014).Severe wind gusts might cause a safety risk in skiing,and ski jumping and landing in outdoor venues.Peak gusts represent the high extremes in a turbulent windfield.Previous studies have dealt with wind gusts in the surface layer and examined the gust factor in terms of the roughness length(Paulsen and Schroeder,2005).However,theimpactofupstreamterrainvariationongustfactors has not been fully explored.Miller et al.(2015)examined the impact of upstream terrain variation on gust factors,but they focused on the roughness change of upstream terrain rather than the upstream surface elevation change over complex terrain.In this study,we examine the impact of upstream surfaceelevationchangeonthegustfactorusingsurfacewind observation data.
The objectives of this study are to examine surface wind features and mechanisms,and investigate the gust factor along the sloping surface in the outdoor venues in Pyeongchang,during February and March.
2.Materials and method
2.1.Site description and data
ThestudysitesaretheYongpyong AlpineCenter(Yo)and Alpensia Ski Jumping Center(Al)located in Pyeongchang.Table 1 summarizes the locations and names of the automatic weather stations(AWSs)at each site,and Fig.1a shows the topography of the Pyeongchang region,including the two study sites.High mountains are located to the north and south of the study sites.The mountains are approximately 1400 m high.Figures 1b and c show the detailed topography of the two study sites,respectively.The topographical maps weremade using 30-m resolution terrain data from the Shuttle Radar Topographic Mission(SRTM;Reuter et al.,2007).The Yo site is located on the northwest-facing slope;the upper two stations are located on the ridge and the lower two stations are located within the valley with low sidewalls.The mean slope angle of the ski slope is~ 23◦.The surface elevation difference between the lowest and highest stations is~440m.ThewindatY1station(1414m)representssynoptic wind at the ridge level in the Pyeongchang region.The western sidewall at station Y4 is parallel to a northeast–southwest axis,while the eastern sidewall is parallel to a northwest–southeast axis.The slope angle of the western sidewall is~20◦and the half-hill height of the western sidewall is~130 m.During the study period,the ski slope was covered with snow;however,the surrounding areas are covered with trees,and therefore significant solar heating occurs on the sloping surface during daytime.
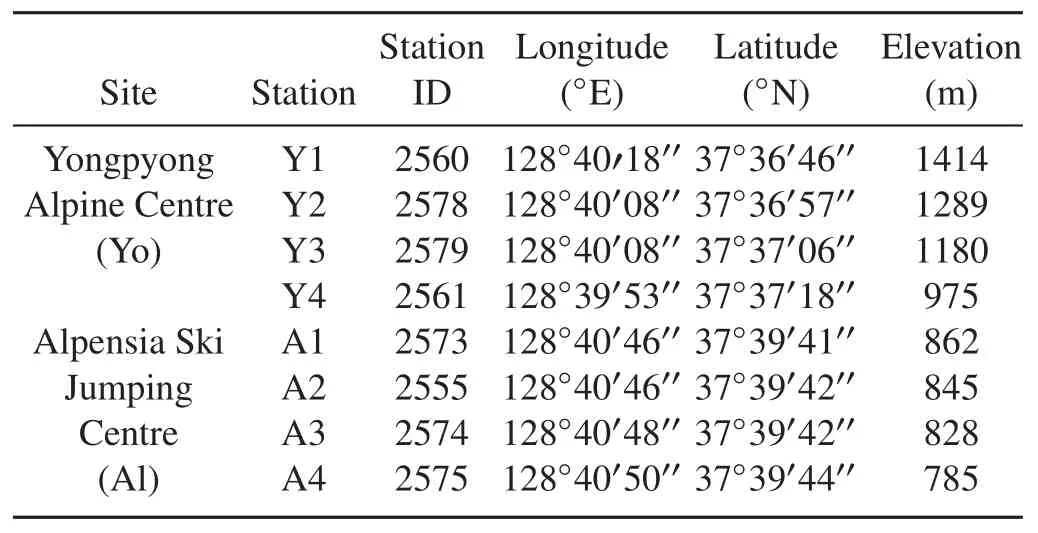
Table 1.Summary of the study sites.

Fig.1.Topographicmap(m)of the study sites:(a)large domain including both sites;(b)Yongpyong alpine center;(c)Alpensia ski jump center.The grey line indicates the ridge axis considered in the calculation of the Froud number.
The Al site is located on the northeast-facing slope and the ridge is parallel to a northwest–southeast axis.The surface elevation difference between the lowest and highest stations is 73 m;the slope is very steep and the slope angle is~ 25◦.The half-width of the hill is~ 100 m.The surface at the ski jumping center was covered with snow and the surroundingareaiscoveredbytrees.StationA1islocatedonthe ridge;the other three stations are located on the steep sloping surface.
The data used in this analysis are 1-min wind speed and direction,gust wind speed and direction,and air temperature and pressure in February and March from 2014 to 2016.
2.2.Analysis method
The flow over the hill shows a different behavior depending on the Froud number,which is defined as(Kaimal and Finnigan,1994)

where U is the wind speed,N is the Brunt–V¨ais¨al¨a frequency,and L is the half-width of the hill at the half-hill height.
To calculate N of theflow,we used the potential temperature difference between two stations with a height difference:
For the upper-level station,we selected a station which is at the ridge level and close to the lowest level station at each site.The two stations used were stations Y2 and Y4 for the Yo site and A1 and A4 for the Al site.For U,we used the wind speed at Y2 and A1 for the Yo and Al sites,respectively.To analyze the mean wind direction and speed,we used the 10-min averaged wind speed and direction with a 1-h interval.
The 1-min wind gust was obtained as the maximum 1-s wind speed during 1 min.The gust factor(GF)is defined as the ratio between the peak wind gust of a specific duration to the mean wind speed for a period of time.To analyze the GF,we used the 10-min maximum and mean wind speed.The 10-min maximum wind speed was obtained as the maximum 1-s wind during 10 min.The GF is defined as

3.Results
3.1.Climatological and meteorological characteristics
The study sites experience cold and dry winters.Based on the data measured at the Daegwallyeong surface synoptic station(Korea Meteorological Administration),which is located approximately 5 km northeast of the Yo study site,the study period is slightly warmer and drier in March compared to the 10-yr period from 2007 to 2016(Table 2).Figure 2 shows the wind rose at eight stations for the Yo and Al sites during February and March.Both stations Y1 and Y2 are located at the ridge level.The wind is dominated by westerlies at both stations,representing a synoptic wind pattern.On the other hand,the wind at stations Y3 and Y4,which are located within the valley,blows more or less parallel to the valley axis;however,the wind directions at the two stations are opposite to each other,which is examined in section 3.3.Whiteman and Doran(1993)suggested four mechanisms of wind channeling.When downward momentum transport is the dominant mechanism,the valley wind directions are similar to the above-valley geostrophic wind directions,with a slight turning(~ 25◦).The wind direction at station Y3 is northwesterly with slight turning from wind direction at station Y2,which is because the ridge to the south blocks the southerly wind at Y3.Hence,a significant wind speed reduction at station Y3 is also shown compared with the wind speed at station Y2.
Figure 2e represents wind at the ridge level at the Al site,which is southwesterly.Northeasterly winds are dominant at the other three stations,which are located leeward.The wind speed reduction at the three stations is significant,although the surface elevation difference is only 17 m between stations A1 and A2.Theflow shows various wind directions at station A2,but the wind speed is very weak,except for the northeasterly wind.Figure 3a shows the distribution of the wind direction at station A1 when the wind speed at A2 is larger than 3 m s−1.Strong wind at A2 occurs when the wind at the ridge level is northeasterly or easterly.The wind rotates clockwise from station A1 to station A4.Under westerly conditions at the ridge level,the minimum wind speed is observed at station A3 among the four stations(figure not shown).Compared with the two stations on the sloping surface,the wind rose at station A4 shows a significant contribution of weak westerly wind.Figure 3b displays the hourly distribution of the westerly wind at A4.Most westerly wind at station A4 occurs during nighttime,implying that the westerly wind is thermally induced downslopeflow.

Table 2.Comparison of the monthly precipitation and monthly mean air temperature for the reference period(2007–16)with the values from the study period.
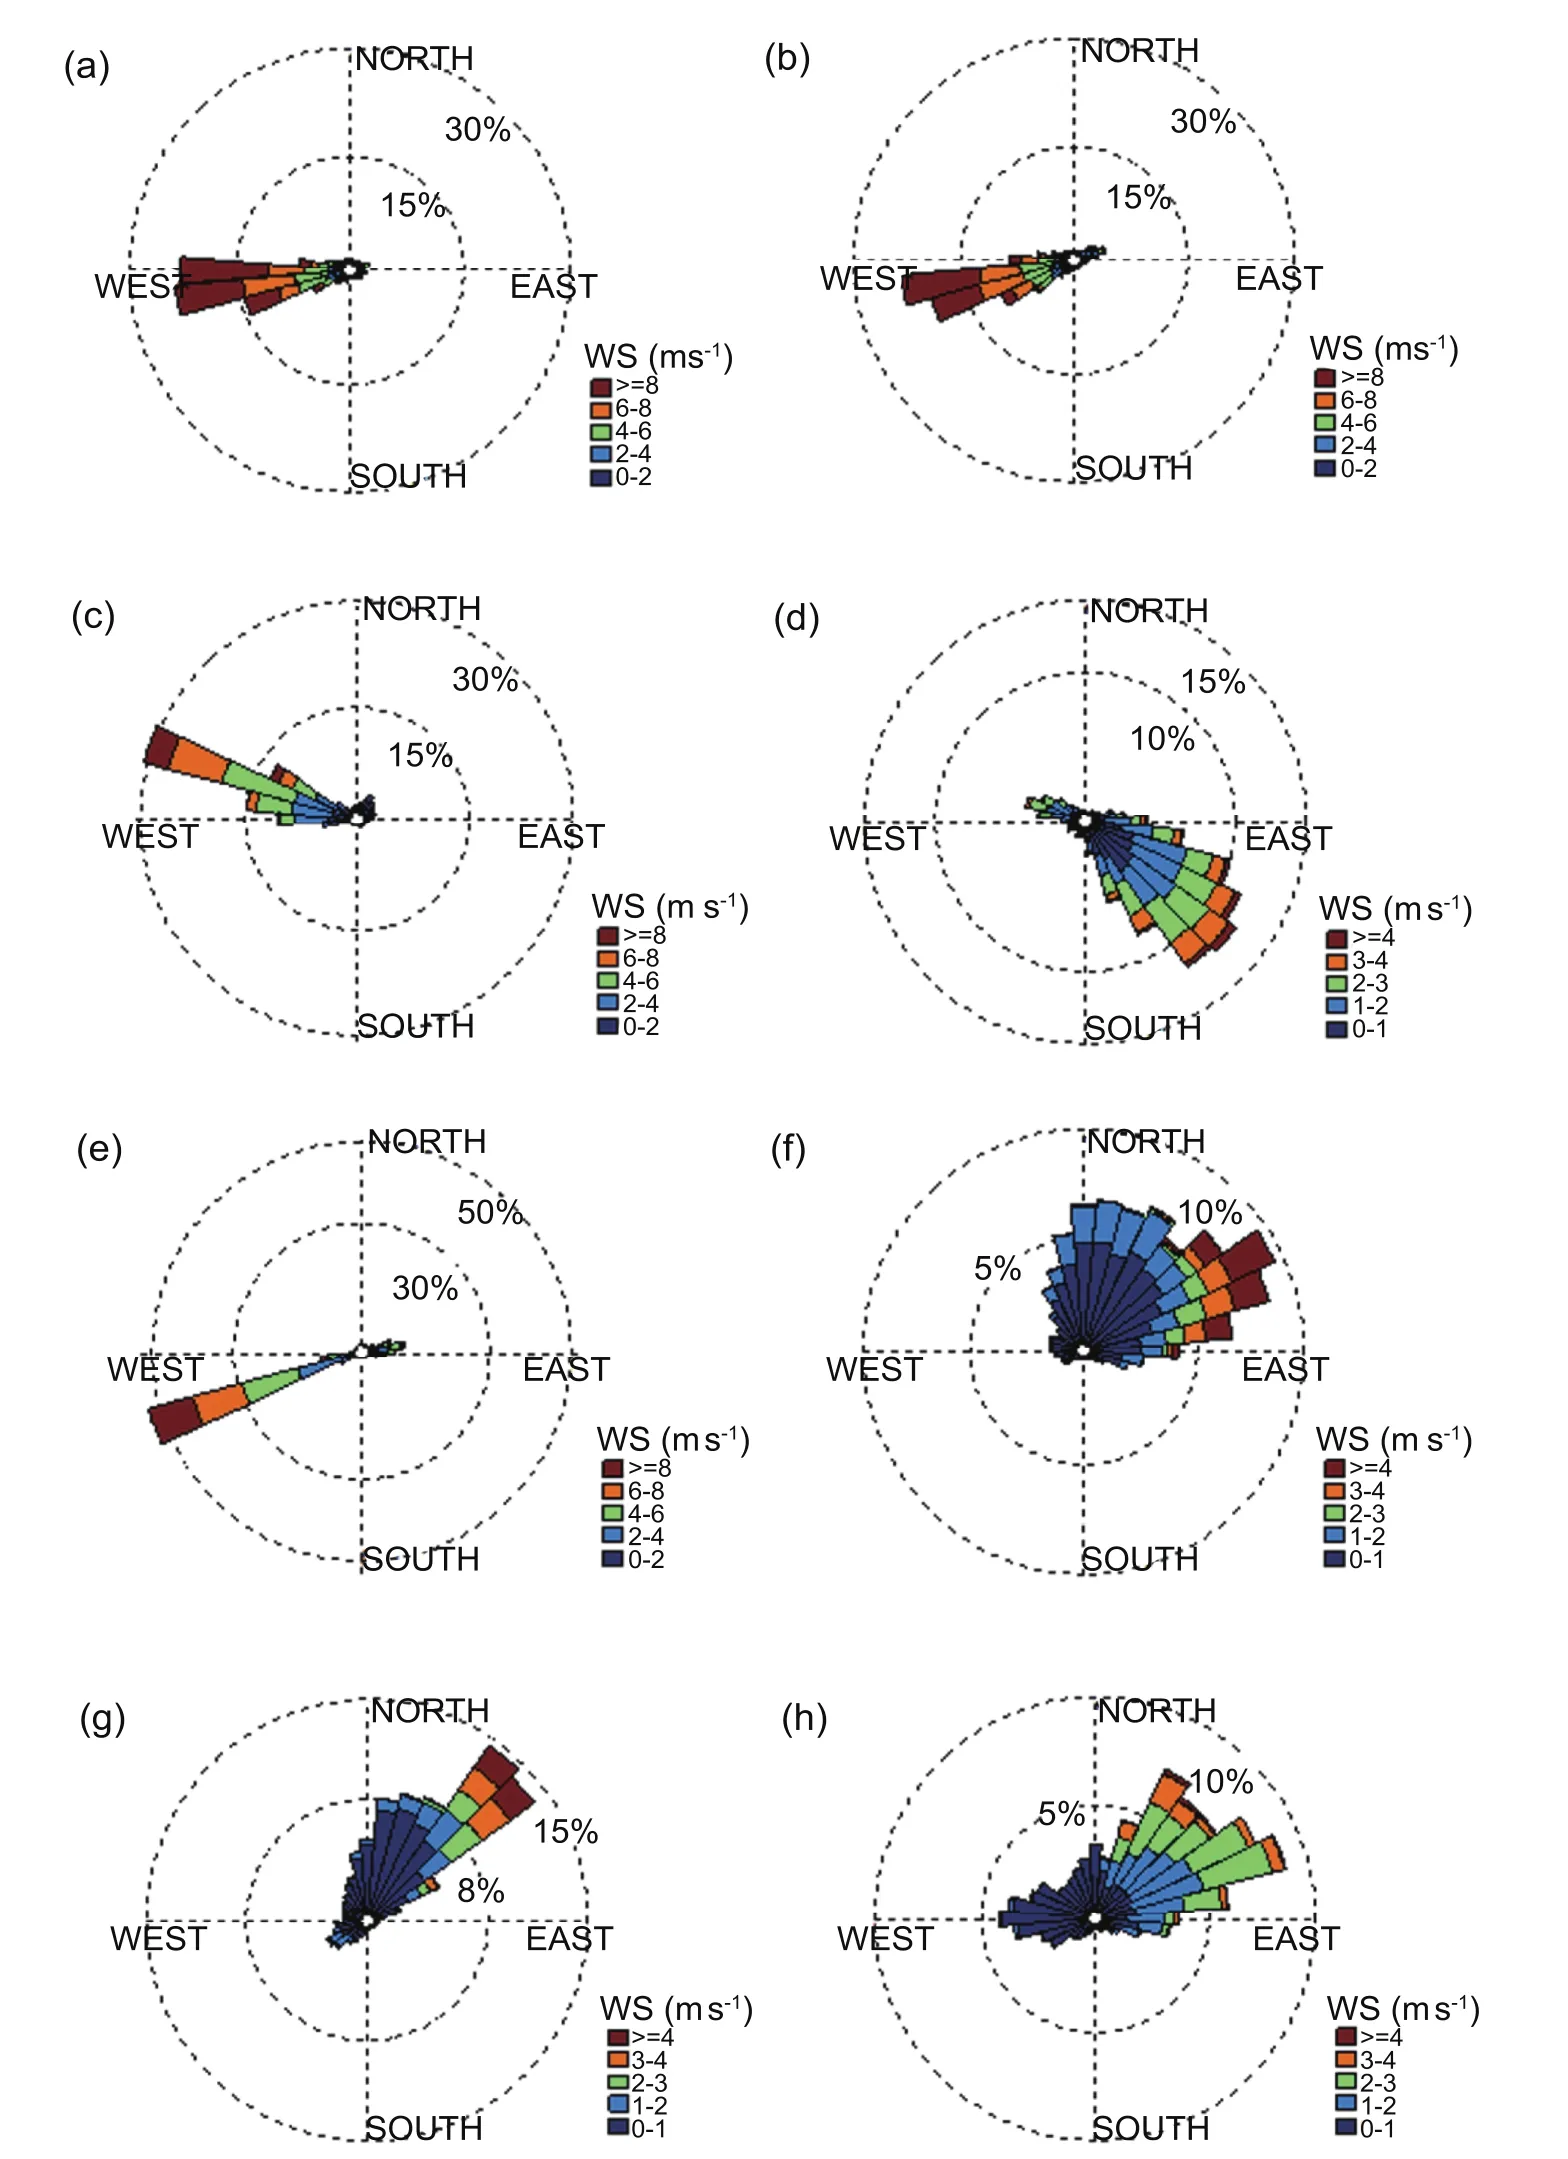
Fig.2.Wind rose at station(a)Y1,(b)Y2,(c)Y3,(d)Y4,(e)A1,(f)A2,(g)A3 and(h)A4,during February and March.
3.2.Diurnal variation of surface wind
The diurnal pattern of the vector windfield was composited at four stations at each study site(Fig.4).The stations at the Yo site are located on the northwest-facing slope,and hence the southwesterly and southeasterly winds are downslopeflow while the northwesterly wind is upslopeflow.At the two stations at the ridge level,theflow is southwesterly at night and westerly during the daytime because northerly upslopeflow cancels out the southerly component of synoptic wind during daytime.Theflow at station Y3 is northwesterly without a change of the wind direction;however,a signifi-cant increase in the wind speed is observed during daytime.Such wind direction and speed changes are due to the fact that the northwesterly wind at station Y3 is channeledflow parallel to the valley axis;it is enhanced by northwesterly upslopeflow during the daytime and reduced by southeasterly downslopeflow at night(Kuwagata and Kondo,1989).On the other hand,the wind at station Y4 is southeasterly and shows a weaker diurnal variation compared with that at other stations.Station Y4 is on the leeward side of the western sidewall for northwesterly wind,and during daytime strong ambient northwesterly wind at upper levels leads to a reverse southeasterlyflow near the surface,which is downslopeflow;however,thermal forcing leads to upslopeflow(northwesterly),which cancels out the southeasterlyflow.We examine the mechanism of the surface wind in the next section.
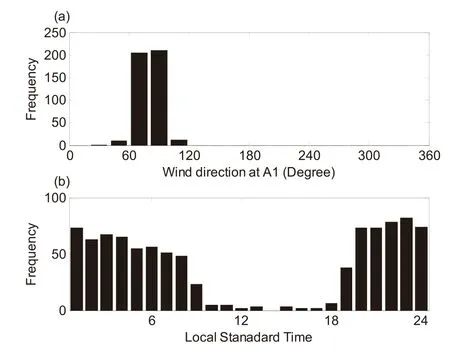
Fig.3.(a)Frequency distribution of the wind direction at A1 when the wind speed at A2 is larger than 3 m s−1.(b)Hourly frequency distribution of westerly wind at A4.
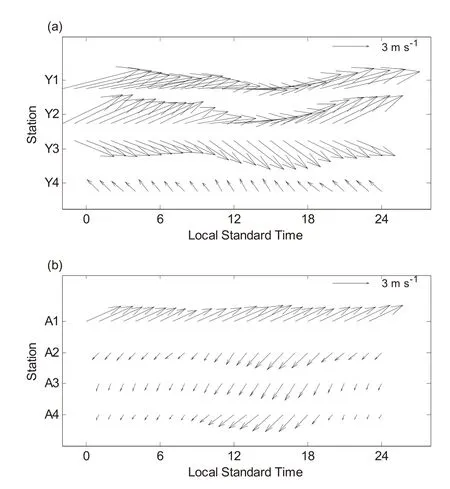
Fig.4.Mean diurnal variation of the wind at the(a)Yo site and(b)Al site.
Theflow at station A1 is southwesterly throughout the day,with little diurnal variation.Station A1 is located on the ridge top,and hence the influence of slope flow on the wind is not shown.On the other hand,at the other stations,theflow is northeasterly throughout the day,with larger wind speeds during daytime.The northeasterly wind at three stations is upslopeflow.Such a wind pattern could be explained with recirculation on the leeward side and thermal forcing.In the recirculation zone,upper-and lower-levelflows show opposite wind directions(Poggi and Katul,2007;Berg et al.,2011).And during daytime,thermal forcing enhances the wind speed of the upslopeflow.
3.3.Mechanism for the surface wind
To examine the mechanism of surface wind with an opposite direction,we focused on wind at two stations at each site.Stations Y3 and Y4 were selected at the Yo site and stations A1 and A4 were selected at the Al site.First,we examined the scatter plot of the wind speed at the two stations.Station Y4 at the Yo site is located on the valleyfloor with both sidewalls in the east and west,while station Y3 is located on the eastern sidewall of the valley;the western side wall is lower thanthesurfaceelevationofstationY3(Fig.5).Whenneutral airflows over the hill,the windward and leeward flows show a significantly different behavior.Therefore,we divided the data into two groups based on the wind direction at station Y2 at the ridge level:easterly and westerly.
Figures 6a and b show scatterplots of the wind speed at stations Y3 and Y4 for the easterly and westerly groups,respectively.The different relationships between the wind speeds at two stations are shown for the easterly and westerly groups(Table 3).The wind speed at Y3 for the westerly group shows a broad distribution extending to 10 m s−1,while most of the winds at Y3 for the easterly group have low wind speeds of<2 m s−1.The different range of wind speed at Y3 is due to the fact that station Y3 is located in the leeward region with a velocity deficit in the easterly case,while it is located in the windward region in the westerly case(Fig.5);hence,the wind at Y3 represents upper-level wind in the westerly case.
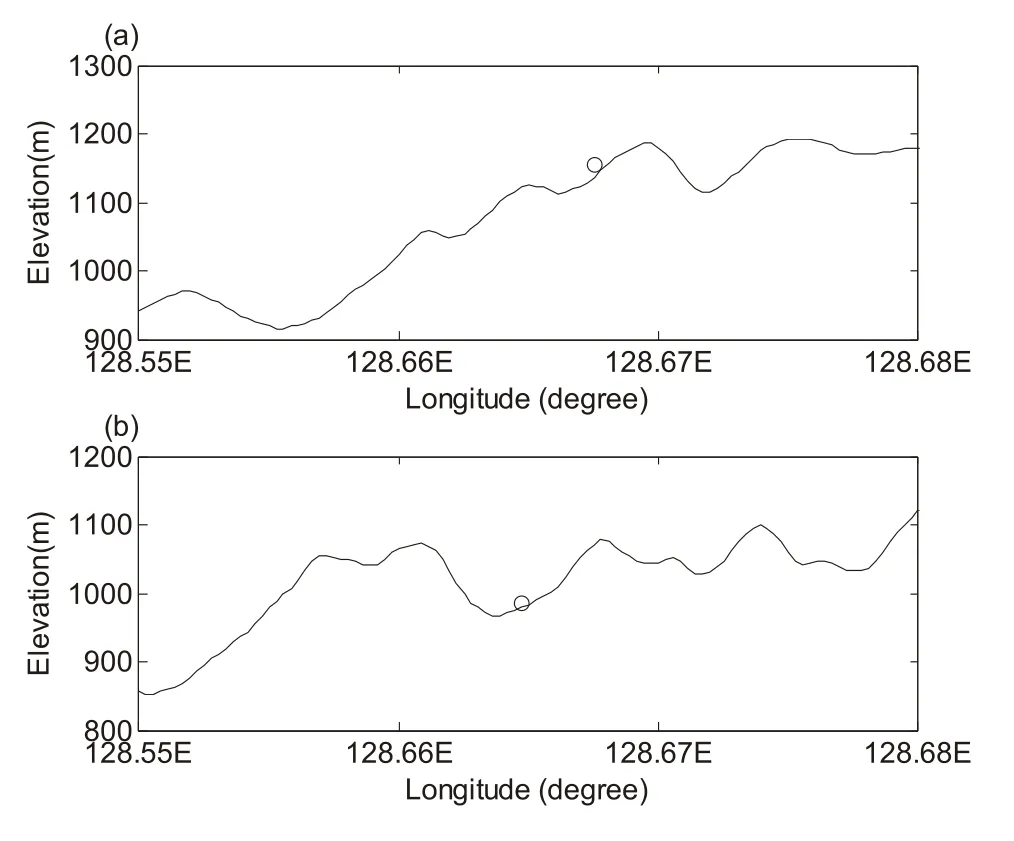
Fig.5.East–west cross section of topography crossing station(a)Y3 and(b)Y4 at the Yo site.The open circle indicates the location of the station.
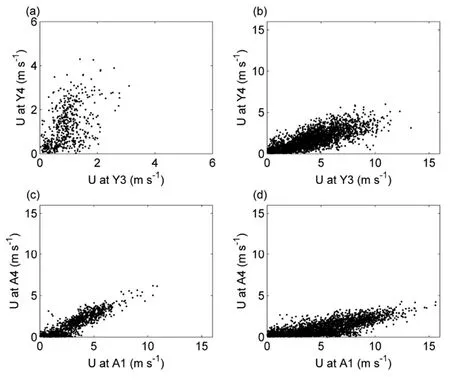
Fig.6.Scatterplot of the wind speed between stations(a)Y3 and Y4 for easterly wind,(b)Y3 and Y4 for westerly wind,(c)A1 and A4 for easterly wind,and(d)A1 and A4 for westerly wind.
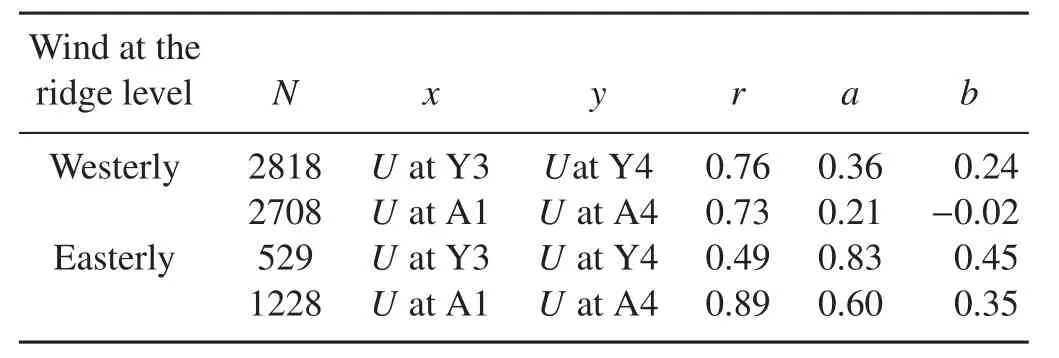
Table 3.Summary of the linear regression analysis for the wind speed at two stations(x and y are variables;N is the number of data;r is the correlation coefficient between two variables;a and b are the regression coefficients for y=ax+b).
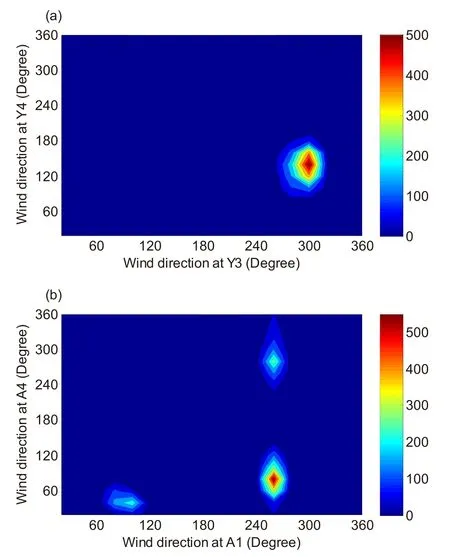
Fig.7.Joint frequency distribution of the wind direction at(a)Y3 and Y4 and(b)A1 and A4 for February and March 2014–16.
The correlation of the wind speeds between stations Y3 and Y4 is higher for westerly(0.76)than for easterly(0.49)winds(Table 3).Figure 7 shows the joint frequency distribution of wind direction at the two stations.Most of winds at station Y4 are southeasterly,which are accompanied by northwesterly winds at station Y3.The wind directions at stations Y3 and Y4 are opposite,with a 180◦difference for the westerly group(Fig.7a).This indicates that the good correlation of the wind speed between the two stations(Y3 and Y4)for the westerly group is not due to downward momentum transport.One possible cause for the good correlation of wind speed in the westerly group is the development of recirculationflow in the leeward region.Strong upper-level wind might lead to strong recirculation near the surface in the leeward direction,leading to significant correlation between upper-and lower-level winds.On the other hand,in the easterly case,stations Y3 and Y4 are both located leeward(Fig.5),and hence winds at both stations represent lowerlevel wind in the wake regions,leading to low correlation of wind speed between the two stations.
Figures 6c and d show scatterplots of the wind speed at stations A1 and A4 for the easterly and westerly cases at the Al site.For the easterly case,the two stations show similar wind speeds,while the wind speed at station A4 is much lower than that at station A1 in the westerly case.The wind speed correlation between the two stations is larger for easterly wind than for westerly wind(Table 3).This can be explained by the differentflow behavior over the hill in the windward and leeward regions.A higher correlation of the wind speeds between upper and lower levels is expected in the windward region compared with the leeward region.Station A1 is located on the ridge,and hence wind at A1 represents upper-level wind.Therefore,the correlation of wind speedbetweenthetwostationsreflectsthatbetweentheupper and lower levels.Figure 7b shows the joint frequency distribution of the wind direction at A1 and A4.When the wind at A1 is easterly,the wind at A4 is also easterly,indicating that A4 is located windward in the easterly case.On the other hand,when the wind at A1 is westerly,the dominant wind is easterly at A4,indicating recirculationflow in the leeward region.Berg et al.(2011)reported observed features of mean wind over a steep escarpment.They showed significant wind speed reduction and reverseflow in the leeward region and a slight reduction of wind speed in the windward region.
Flow separation occurs over hills with a slope angle>18◦(Kaimal and Finnigan,1994),in which theflow direction at the lowest level is opposite to that above.The slope angles of the western sidewall at station Y4 and the ski jumping surface at the Al site satisfy theflow separation condition.Figure 8 shows the frequency distribution of the Froud number at the Yo and Al sites for westerly conditions.Most of theflows have a large Froud number,supporting the presence of recirculationflow in the leeward region.
3.4.Wind gust analysis
The GF depends on numerous factors such as roughness length,distance from upstream terrain change,stability,measurement height,and the presence of convection(Paulsen and Schroeder,2005).During the study period,all stations(which are located in mountainous areas)had surfaces covered with snow;hence,the roughness length of each station is similar and the measurement height above the ground is the same at all stations.However,the upstream terrain change is different at each station depending on the wind direction.The differenceinGFamongthestationsmightbeduetothedifference in upstream terrain change,such as upslope or downslope.
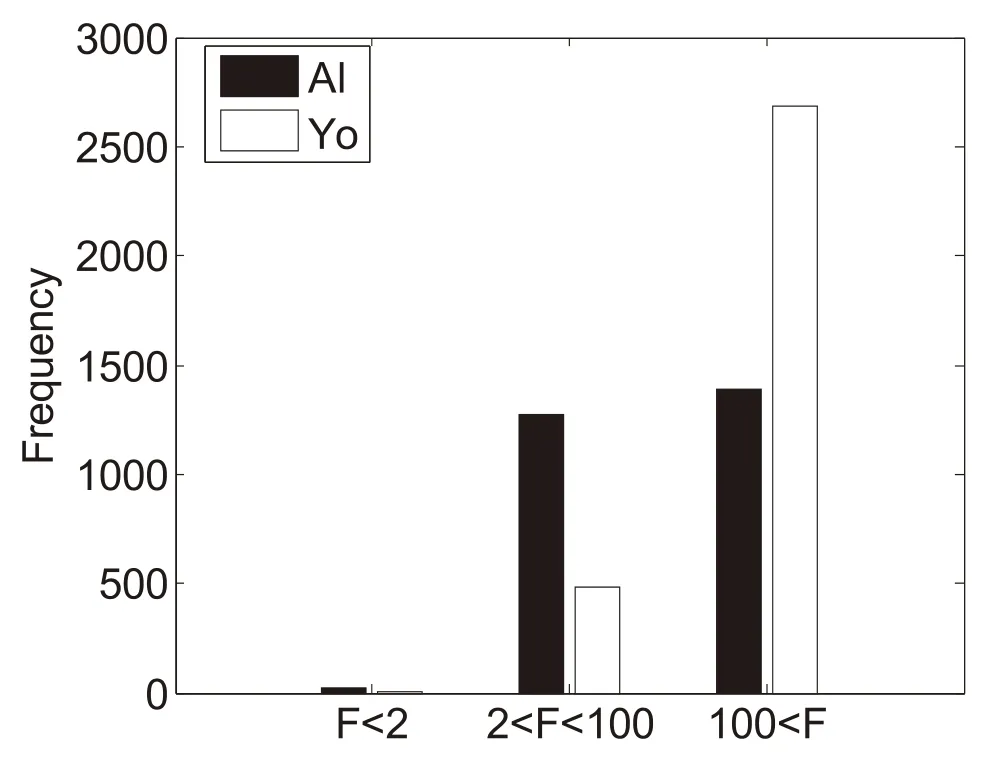
Fig.8.Frequency distribution of the Froud number at the Yo and Al sites for westerly wind.
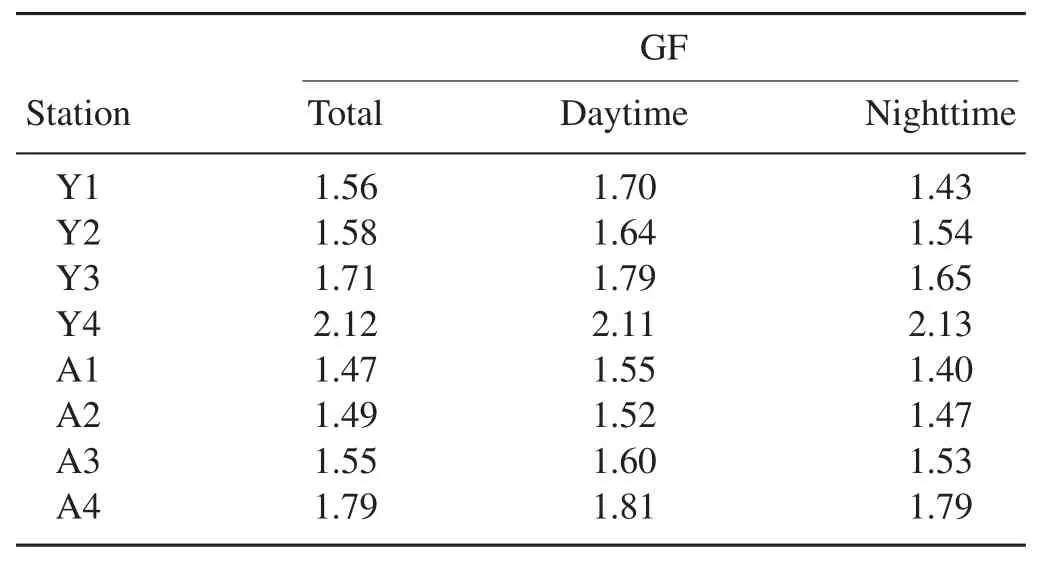
Table 4.Summary of the GF at the study stations for the wind speed regime between 2 and 6 m s−1.Daytime:1000–1600 LST(local standard time).Nighttime:2000–0400 LST.
Table 4 displays the GF for the wind speed range of 2–6 m s−1at the Yo and Al sites.The wind speed regime was selected to compare the GFs at different stations for similar wind conditions.Within the same wind speed regimes,the GF increases with decreasing surface elevation at each site.The GFs are 1.56 and 1.47 at the Y1 and A1 stations on the ridge at the Yo and Al sites,respectively.Suomi et al.(2014)reported a GF of 1.3–1.4 at 10 m overflat grassfields for the wind speed range of 2–12 m s−1.The difference in GF between the two studies is due to the different topography and gust duration.The GF increases with increasing roughness length(Paulsen and Schroeder,2005),and our study sites are located in mountainous areas,which are typically characterized by large roughness length(Arya,2001).The GF decreases with increasing gust duration(Suomi et al.,2014).The gust duration was 3 s in Suomi et al.(2014),while it is 1 s in our study.The GF during daytime is larger than that during nighttime,except at station Y4,which is located in the wake region.The larger GF during daytime is due to convection,which is consistent with a larger GF under unstable conditions than under stable conditions(Suomi et al.,2014).The larger GF at the Yo site might be due to its more complex topography compared to the Al site.The significant increase in GF at low elevation at each site is associated with the fact that the stations are located in the leeward wake region in the westerly case.

Fig.9.GF in terms of the wind speed for the(a)easterly case and(b)westerly case at station Y4,and(c)easterly case and(d)westerly case at station A4.
Figure 9 compares the GF in terms of the wind speed for easterly and westerly winds at stations Y4 and A4.The GF generally decreases with increasing wind speed because the environments with lower average wind speeds are much more conducive to free convection,introducing additional turbulence(Paulsen and Schroeder,2005).Of note is that the GF is larger for westerly than for easterly wind,indicating a larger GF in the leeward wake region than in the windward region.The wake region is dominated by turbulence,which provides favorable conditions for a large GF.Berg et al.(2011)reported low wind speed and high variance(σu)in the leeward region.Therefore,athletes should keep in mind the possibility of strong gusts at the leeward foot of the hill,although the mean wind is weak at the leeward foot.
4.Summary and conclusions
We examined surface wind features and wind gusts using data from eight AWSs located at two outdoor venues in Pyeongchang,Korea,during February and March.During these months,the dominant wind at the ridge level is westerly;however,a significant wind direction change is apparent along the sloping surfaces of the selected venues.The winds at the two stations Y3 and Y4 within the valley at the Yo site have opposite wind directions.The same phenomenon is also apparent at the Al site,where the wind over the sloping surface stations has an opposite wind direction compared with that on the ridge.The composited diurnal pattern of the vector wind indicates that the winds at the study sites are also influenced by thermally induced flow,with enhanced upslopeflow during daytime.
To understand the mechanisms of surface winds with opposite directions,we examined scatter plots of the wind speed at two stations with opposite wind directions for westerly and easterly cases at the ridge level.Different relationships between the wind speeds at the two stations are shown for easterly and westerly cases at both the Yo and Al sites.The different relationships between the winds at the two stations for the easterly and westerly cases can be explained by theflow behavior over the hill:Under a large Froud number,theflow shows typical behavior,with recirculation on the leeward slope.A higher correlation of the wind speeds between upper and lower levels is apparent in the windward region compared with the leeward region.The slope angles of the western sidewall at station Y4 and the ski jumping surface at the Al site satisfy theflow separation condition at the leeward foot.Most of theflow at the study stations has a large Froud number(F>2),supporting the presence of leewardflow separation.The strong synoptic wind,small width of the ridge,and steep downwind ridge slope angle provide favorable conditions forflow separation at the leeward foot of the ridge of the study sites.
Within the same wind speed regimes,the GF increases with decreasing surface elevation at each site.The GF during daytime is larger than that during nighttime,except at station Y4,which is in the wake region.The significant increase in the GF at the low-elevation station at each site is due to the fact that the stations are located in the leeward region of dominant winds.The GFs at stations Y4 and A4 are larger for westerly than for easterly wind,indicating a larger GF at the leeward foot.
Thewindinformationpresentedinthispaperwillhelpthe venue forecasters and judges of the 2018 Winter Olympics to understand the wind features at the outdoor venues in Pyeongchang,and can be used to properly plan and prepare for the Games.
Acknowledgements.This work was supported by Research and Development for KMA Weather,Climate,and Earth System Services(Grant No.NIMS-2016-3100).The authors are greatly appreciative to the participants of the World Weather Research ProgrammeResearchDevelopmentProjectandForecastDemonstration Project,International Collaborative Experiments for Pyeongchang 2018 Olympic and Paralympic Winter Games(ICE-POP 2018),hosted by the Korea Meteorological Administration.
Arya,S.P.,2001:Introduction to Micrometeorology.Academic Press,420 pp.
Berg,J.,J.Mann,A.Bechmann,M.S.Courtney,and H.E.Jørgensen,2011:The Bolund experiment,Part I:Flow over a steep,three-dimensional hill.Bound.-Layer Meteor.,141,219–243,https://doi.org/10.1007/s10546-011-9636-y.
Carruthers,D.J.,and J.C.R.Hunt,1990:Fluid mechanics of air-flow over hills:Turbulence,fluxes,and waves in the boundary layer.Atmospheric Processes Over Complex Terrain,W.Blumen,Ed.,Meteorological Monographs,23,American Meteorological Society,83–107,https://doi.org/10.1007/978-1-935704-25-65.
Horel,J.,T.Potter,L.Dunn,W.J.Steenburgh,M.Eubank,M.Splitt,and D.J.Onton,2002:Weather support for the 2002 winter Olympic and Paralympic Games.Bull.Amer.Meteor.,Soc.,83(2),227–240,https://doi.org/10.1175/1520-0477(2002)083<0227:WSFTWO>2.3.CO;2.
Issac,G.A.,and Coauthors,2014:Science of nowcasting Olympic Weather for Vancouver 2010(SNOW-V10):A World Weather Research Programme Project.Pure Appl.Geophys.,171,1–24,https://doi.org/10.1007/s00024-012-0579-0.
Jackson,P.S.,and J.C.R.Hunt,1975:Turbulent windflow over a low hill.Quart.J.Roy.Meteor.Soc.,101,929–955,https://doi.org/10.1002/qj.49710143015.
Joe,P.,and Coauthors,2014:The monitoring network of the Vancouver 2010 Olympics.Pure Appl.Geophys.,171,25–58,https://doi.org/10.1007/s00024-012-0588-z.
Kaimal,J.C.,and J.J.Finnigan,1994:Atmospheric BoundaryLayer Flows:Their Structure and Measurements.Oxford University Press,289 pp.
Kiktev,D.,and Coauthors,2017:FROST-2014:The Sochi winter Olympics international project.Bull.Amer.Meteor.Soc.,https://doi.org/10.1175/BAMS-D-15-00307.1(in press).
Kuwagata,T.,and J.Kondo,1989:Observation and modeling of thermally induced upslopeflow.Bound.-Layer Meteor.,49,265–293,https://doi.org/10.1007/BF00120973.
Luk’yanov,V.I.,T.G.Dmitireva,and E.V.Vasil’ev,2015:Weather Services for the test events and Sochi-2014 Olympic and Paralympic Games.Russian Meteorology and Hydrology,40(8),495–503,https://doi.org/10.3103/S1068373915080014.
Miller,C.,J.-A.Balderrama,and F.Masters,2015:Aspects of observedgustfactorsinlandfallingtropicalcyclones:Gustcomponents,terrain,and upstream fetch effects.Bound.-Layer Meteor.,155,129–155,https://doi.org/10.1007/s10546-014-9989-0.
Paulsen,B.M.,and J.L.Schroeder,2005:An examination of tropical and extratropical gust factors and the associated wind speed histograms.J.Appl.Meteor.,34,270–280.
Poggi,D.,and G.G.Katul,2007:Turbulentflows on forested hilly terrain:The recirculation region.Quart.J.Roy.Meteor.Soc.,133,1027–1039,https://doi.org/10.1002/qj.73.
Reuter,H.I.,A.Nelson,and A.Jarvis,2007:An evaluation of void-filling interpolation methods for SRTM data.International Journal of Geographical Information Science,21(9),983–1008,https://doi.org/10.1080/13658810601169899.
Suomi,I.,S.-E.Gryning,R.Floors,T.Vihma,and C.Fortelius,2014:On the vertical structure of wind gusts.Quart.J.Roy.Meteor.Soc.,141,1658-1670,https://doi.org/10.1002/qj.2468.
Stull,R.B.,1988:An Introduction to Boundary Layer Meteorology.Kluwer Academic Publishers,670 pp.
Teakles,A.,R.Mo,C.F.Dierking,C.Emond,T.Smith,N.McLennan,and P.I.Joe,2014:Realizing user-relevant conceptual model for the ski jump venue of the Vancouver 2010 Winter Olympics.Pure Appl.Geophys.,171,185–207,https://doi.org/10.1007/s00024-012-0544-y.
Virmavirta,M.,and J.Klveka¨s,2012:The effect of wind on jumping distance in ski-jumping-fairness assessed.Sports Biomechanics,11(3),358–369,https://doi.org/10.1080/14763141.2011.637119.
Whiteman,C.D.,1990:Observations of thermally developed wind systems in mountainous terrain.Atmospheric Processes Over Complex Terrain,W.Blumen Ed.,Meteorological Monographs,23,American Meteorological Society,5–42,https://doi.org/10.1007/978-1-935704-25-62.
Whiteman,C.D.,and J.C.Doran,1993:The relationship between overlying synoptic-scaleflows and winds within a valley.J.Appl.Meteor.,32,1669–1682,https://doi.org/10.1175/1520-0450(1993)032<1669:TRBOSS>2.0.CO;2.
杂志排行
Advances in Atmospheric Sciences的其它文章
- 2017 was the Warmest Year on Record for the Global Ocean
- Atmospheric Profiling Synthetic Observation System in Tibet
- Assimilation of Feng-Yun-3B Satellite Microwave Humidity Sounder Data over Land
- New Method for Estimating Daily Global Solar Radiation over Sloped Topography in China
- Statistics-based Optimization of the Polarimetric Radar Hydrometeor Classification Algorithm and Its Application for a Squall Line in South China
- Asymmetric Variations in the Tropical Ascending Branches of Hadley Circulations and the Associated Mechanisms and Effects
