Fatigue Analysis for Welded Joints of Offshore Wind Turbine under Three Wind Loads
2018-01-04HANChaoshuaiMAYongliangXianqiangZHANGMeng
HAN Chao-shuai,MA Yong-liang,QÜ Xian-qiang,ZHANG Meng
(College of Ship Building Engineering,Harbin Engineering University,Harbin 150001,China)
Fatigue Analysis for Welded Joints of Offshore Wind Turbine under Three Wind Loads
HAN Chao-shuai,MA Yong-liang,QÜ Xian-qiang,ZHANG Meng
(College of Ship Building Engineering,Harbin Engineering University,Harbin 150001,China)
Fatigue damage of offshore wind turbines(OWT)is calculated with the hot-spot stress approach,considering three different loads which include time domain loads,fatigue load spectrum and equivalent fatigue loads.Three tubular joints and two non-tubular joints are taken as the typical structure elements for study.By comparing with the results of fatigue damage under three loads,it is concluded that the damage under fatigue load spectrum is the largest,followed by that under equivalent fatigue loads,and the damage under time domain loads is the smallest.From the design point of view,the results calculated by fatigue load spectrum and equivalent fatigue loads can be considered as conservative and safe.The equivalent load method shows a large advantage to check the fatigue damage of offshore wind turbine structures.It is convenient and not time-consuming.In addition,the weight of six fatigue components of the equivalent fatigue loads is analyzed,which is convenient,effective and fast for the optimization design of the support structure.
offshore wind turbines;hot spot stress;time domain load;fatigue load spectrum;equivalent fatigue load
0 Introduction
Wind power is a clean,renewable energy,which possesses commercial-scale development conditions in economy and technology.The global offshore wind farms are mainly in Denmark,the Netherlands,the United Kingdom,Sweden,Ireland,Germany and other European countries.With the improvement of offshore wind power technology,the large-scale development of offshore wind turbine(OWT)is becoming a popular research topic by engineering and technical personnels.
Support structures for offshore application,esp.in deeper waters,have been identified by many sources as a vital contribution to cost effective installations,which even take up 30%of the total cost[1].In addition,the support structures of OWT are working in the harsh marine environment during all its lifetime,influenced by the interaction of a variety of environmental loads,including wind loads,wave loads,current loads,ice loads,and so on,which makessupport structures susceptible to fatigue damage and even leads to serious structural failure and causes huge economic losses and adverse social effects.Therefore,it is very necessary to perform a fatigue strength check for offshore wind turbines.
Fatigue analysis is considered as very different,by comparing OWT support structures with offshore oil and gas platforms.Traditional oil platforms mainly suffer from wave loads,however,for offshore wind turbines,wind are the dominant loads in terms of the contribution to the cumulative fatigue damage.According to the experience of existing European offshore wind farms,stress levels of wind loads is very high in a relatively mild marine environment,and load cycles will exceed 1×10⁹in the design lifetime of 20 years.Therefore,wind load is a very important dynamic source which should be considered as a main design basis.
Klose and coworkers[2]did an integrated analysis of wind turbine behavior and structural dynamics of a jacket support structure under combined wind and wave loads in the time domain;Yeter and Garbatov[3]performed a joint spectral fatigue assessment of an offshore wind turbine structure under wave and wind loading;Gao and Moan[4]studied fatigue reliability of Jacket offshore wind turbine support structure considering detection and maintenance;Dong and Moan[5]conducted a long-term fatigue analysis of multi-planar tubular joints for jacket-type offshore wind turbine in time domain;Radaj and coworkers[6]made a summary about recent developments in local concepts of fatigue assessment of welded joints.Several researchers have shown jacket design proposals in the past,but the transition structure was often only sketched and not realistically designed.This is hence a large uncertainty for such proposals as the transition piece is the greatest design challenge.In this paper,fatigue analysis of tubular and non-tubular welded joints is performed under wind loads including time domain load,fatigue load spectrum and equivalent fatigue load.
It is usually necessary to check fatigue strength in the preliminary design stage of offshore wind turbines,while the time-domain method is time-consuming,Therefore,this paper proposes to use fatigue load spectrum methods and equivalent fatigue loads approach to calculate fatigue damage of offshore wind turbine support structure.Fatigue load spectrum is derived from the time domain wind loads with Rainflow Cycle-Counting Algorithm,and the equivalent fatigue load is obtained from fatigue load spectrum by damage equivalence theory[7].
The main purpose of this paper is to perform a structural assessment of offshore wind turbines under time history wind loads,fatigue load spectrum and equivalent fatigue loads.By comparing with the results of the three methods,reliability of the latter two methods is verified.In addition,this paper analyses the weight of each components of the equivalent fatigue loads,which is convenient,effective and fast for the optimization design of the support structure.
1 Wind loads of the jacket offshore wind turbine
1.1 Support structure and wind condition
Offshore fixed wind turbines with jacket which is presented in the paper is in shallow water depth of 10 m,as shown in Fig.1.The height of jacket is 19.7 m,the height of transition piece is 8.8 m,and the height of tower is 66.3 m.The finite element model has been built with shell93 in ANSYS software,which includes a refined mesh at the hot spot location and a coarse mesh.Fully fixed boundary conditions are applied to the outside of each of the piles.
1.2 Wind model
For wind turbines,the wind resource is one of the main external conditions to determine the load,so the simulation of wind loads is very important.In general,the basic parameters for the calculation of wind loads contain the mean wind speed and turbulence intensity,the paper considers normal wind conditions,for the standard turbine design,using Weibull wind speed distribution,as given in the following equation:
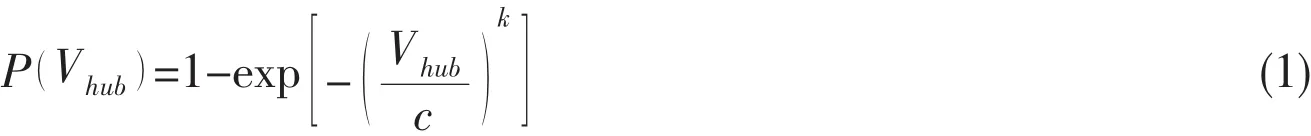
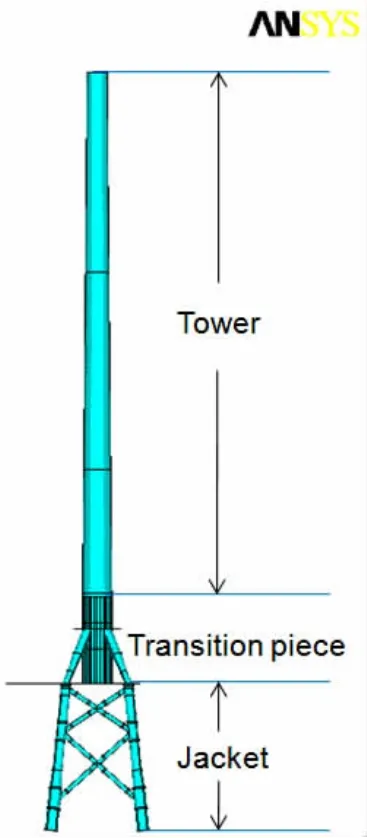
Fig.1 Jacket offshore wind turbine
where P( Vhub)is the cumulative probability function,Vhubis 10-min mean of the wind speed at hub height,and Vhub=7.5 m/s in this paper,c is the scale parameter of Weibull distribution,k is the shape parameter.k=2 for the standard turbine design.The relationship between c and mean speed Vaveis as given in the following equation:
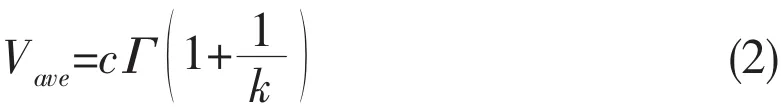
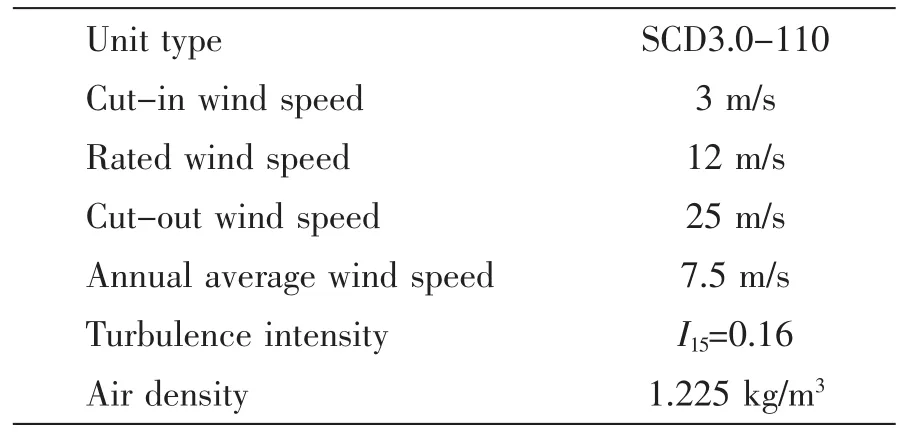
According to GL standard,the paper uses class IIIB,as shown in Tab.1,Vave=7.5 m/s,c=8.46 m/s which is derived from the Eq.(2),turbulence intensity is taken as 0.16.
For wind turbines,the wind speed at the nacelle height is of interest.The wind speed is therefore extrapolated to the nacelle height using a power law of 0.14 in this study.More details about wind model parameters can be found in Tab.2.
1.3 Time domain loads(TDL)based on 10 minutes simulation
The latest simulation technology of structural response is very good,which can provide designers with a relatively accurate time series wind loads[8],For the evaluation of the fatigue loads,it is generally required that all design load cases of the fatigue strength shall be included DLC 1.1,DLC 1.4,DLC 1.8,DLC 2.1,DLC 2.2,DLC 3.1,DLC 4.1,DLC 6.4 and DLC 9.1 to DLC 9.4,if applicable[9].

Tab.1 The classification of offshore wind turbine
Tab.2 Detailed parameters of wind loads
In this paper,the author simulates load case DLC1.2 in power production,DLC2.4 in power production plus occurrence of fault or loss electrical network connection,DLC4.1 in normal shut down,DLC6.4 in parked,taking the wind speed at hub height with GH Bladed software.While only DLC1.2 is considered as a research for simplicity.Fig.2 shows six wind load components:Mx,My,Mz,Fx,Fy and Fz time history curves,simulation time is 600 s with an interval of 0.05 s.
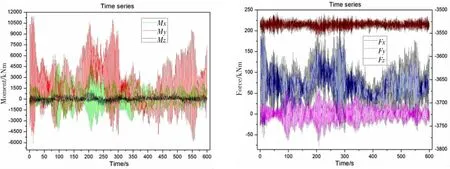
Fig.2 Time history of the six fatigue load components:Mx,My,Mz,Fx,Fy and Fz
1.4 Fatigue load spectrum(FLS)
Fatigue load spectrum can be obtained from time series loads at the hub with the rainflow counting method,which involves the following steps:
(a)The stress history is searched to determine the successive peaks and troughs by identification of turning points
(b)The successive peaks and troughs are re-ordered so that the sequence begins with the highest peak value of the stress history
(c)The sequence of peaks and troughs can now be scanned to determine the rainflow cycles.A rainflow cycle is only recorded when the range exceeds a user specified minimum range.The purpose of this user-specified minimum range is to filter out very smal cycles where this is desired.
(d)The count of rainflow cycles is binned according to the cycle mean and range values.The distribution of bins is defined by the user who is required to specify minimum and maximum values of stress and the number of bins to be used.
Fatigue load spectrums of six components Fx,Fy,Fz,Mx,My and Mz are as shown in Fig.3,which shows the relationship between load range and the corresponding cycles,does not consider the mean load.
1.5 Equivalent fatigue load
Equivalent load is a convenient and concise description of fatigue damage within a given load time,which should follow the principle of equal damage,that is to say,the damage caused by a load at a given frequency(e.g.1 Hz)is equal to that calculated by fatigue load spectrum.The basic assumption is a linear relationship between the load and the stress.In the general
Fig.3 Fatigue load spectrum of the six fatigue load components:Mx,My,Mz,Fx,Fy and Fz structure analysis,the linear elastic theory is used,and the applied load and stress are proportional,which can be expressed in the Eq.(3),in the same way,the load range corresponding to the stress range is also proportional as given in Eq.(4):where F is the load,ΔF is the load range,σ is the stress produced by F,Δσ is the stress range,a is a proportional factor.Equivalent load can be derived as the following process:

S-N curve:

The damage caused by stress range Δσi:

The total damage:

The equivalent damage:

σNrefcan be derived from equal damage criterion:

The equivalent load can be obtained by the following formula:

where Feqis the equivalent load,Fiis the i-level equivalent load in fatigue load spectrum,Siis the load cycle corresponding to Fi,Nrefis the reference cycle;m is the slope of S-N curve.
According to the formula(11),the equivalent load is generated by the fatigue load spectrum in Fig.4.
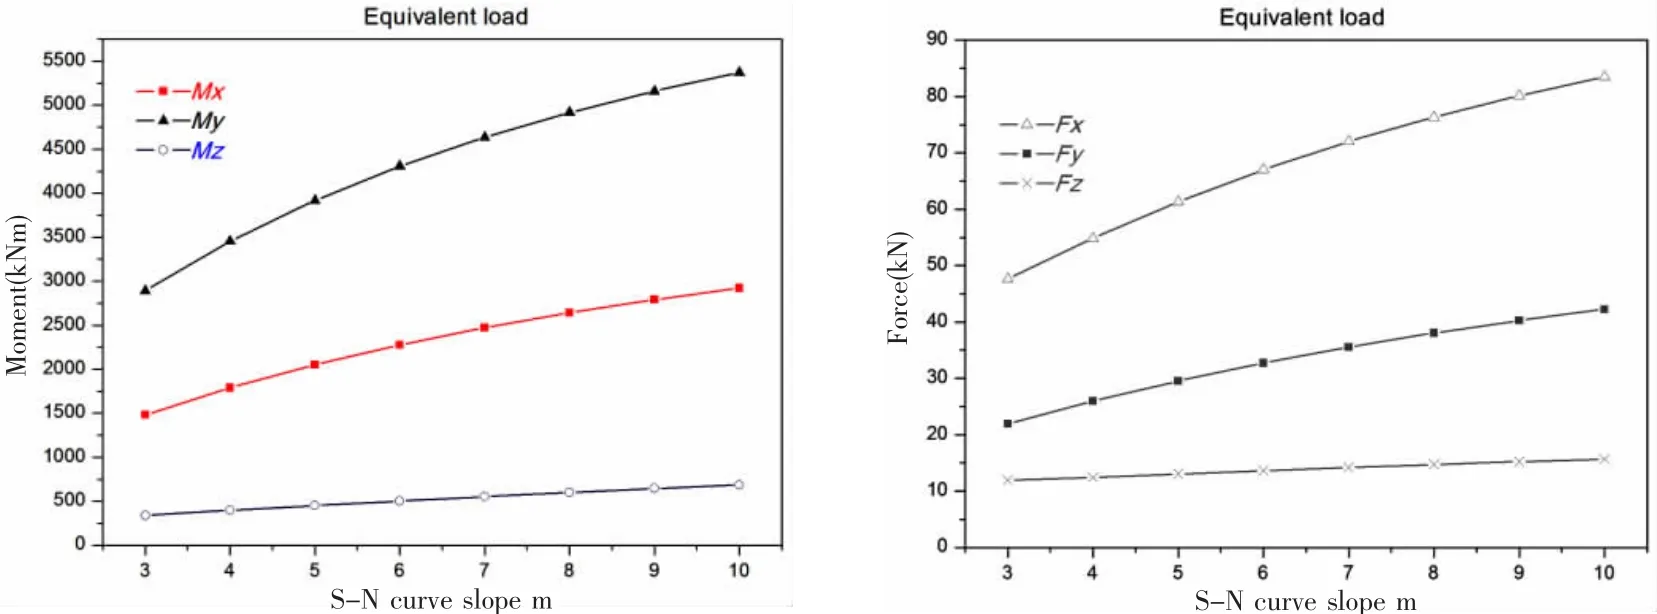
Fig.4 Equivalent fatigue load of the six fatigue load components:Mx,My,Mz,Fx,Fy and Fz
In this paper,the equivalent fatigue load with m=3 is used to calculate the damage of the support structure.

Tab.3 The equivalent fatigue load with m=3
2 Fatigue analysis of jacket-type offshore wind turbine
Fatigue analysis may be based on different methodologies depending on what is found most efficient for the considered structural detail.In general,for fatigue analysis of welded joints,there are several different approaches,i.e.the nominal approach,the hot-spot stress approach,the notch stress and notch intensity approach,the crack propagation approach,and so on.For welded joints,the hot-spot stresses(geometric stresses)are decisive in the fatigue analysis.Therefore,in this paper,the hot-spot stress approach is adopted for the assessment of welded joints,the finite element modeling in terms of choice of element type and mesh quality shall be carried out.
2.1 Calculation of the hot-spot stress by the finite element method
Taking into account the shape of the welded joints,three kinds of representative tubular joints and two non-tubular welded joints are selected for fatigue analysis as shown in Fig.5.There joints are named as DK tubular joint,K tubular joint,X tubular joint,transition piece(TP)joint and slope(SP)joint,respectively,which will be used in following parts.
The hot-spot site is located at the brace-chord for the tubular joints as shown in Fig.6,while it is located at the intersection of the tubular and plate for the non-tubular joint,hot spots are respectively distributed in eight positions named as T,TR,R,BR,B,BL,L,TL,TD with a interval of 45°.T represents top,B represents bottom,L represents left,R represents right,as shown in Fig.6.
There are several methods to calculate the hot-spot stress,including the finite element method and the parameter equation method,and so on.Dong and Moan[4]calculated the stress concentration factor of the welded tubular joints at the brace toe and the brace saddle location based on the work of Efthymiou,then the hot-spot stress is obtained from that the nominal stress multiplies by SCF.Lozano-Minguez and coworkers[10]studied the stress concentration factor,comparing the result of FE method with that of Efthymiou equation,it is concluded that the existing parameter equations for predicting hot spot SCFs are conservative and insufficient to be used for fatigue analysis.
The Efthymiou equations are applicable for simple tubular joints like planar T,Y,K,etc.For multi-planar tubular joints,several possible limitations of their application were indicated by some recent work.
In this paper,the hot spot stress is calculated by a linear extrapolation with finite element analysis,and the extrapolation direction should be normal to the weld toes[11].The blue region represents the hot-spot stress distribution at the brace,the red region represents the stress distribution at the chord as shown in Fig.7.
For extrapolation of stress along the brace surface normal to the weld toe,the distance of A and B points away from the weld toe as indicated in Fig.8 and in Eqs.(12)and(13).

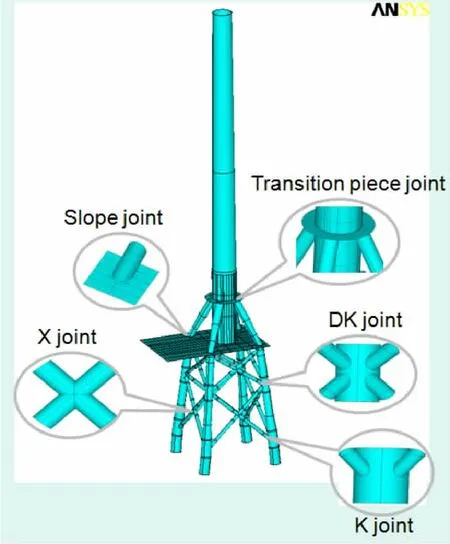
Fig.5 Location and types of welded joints
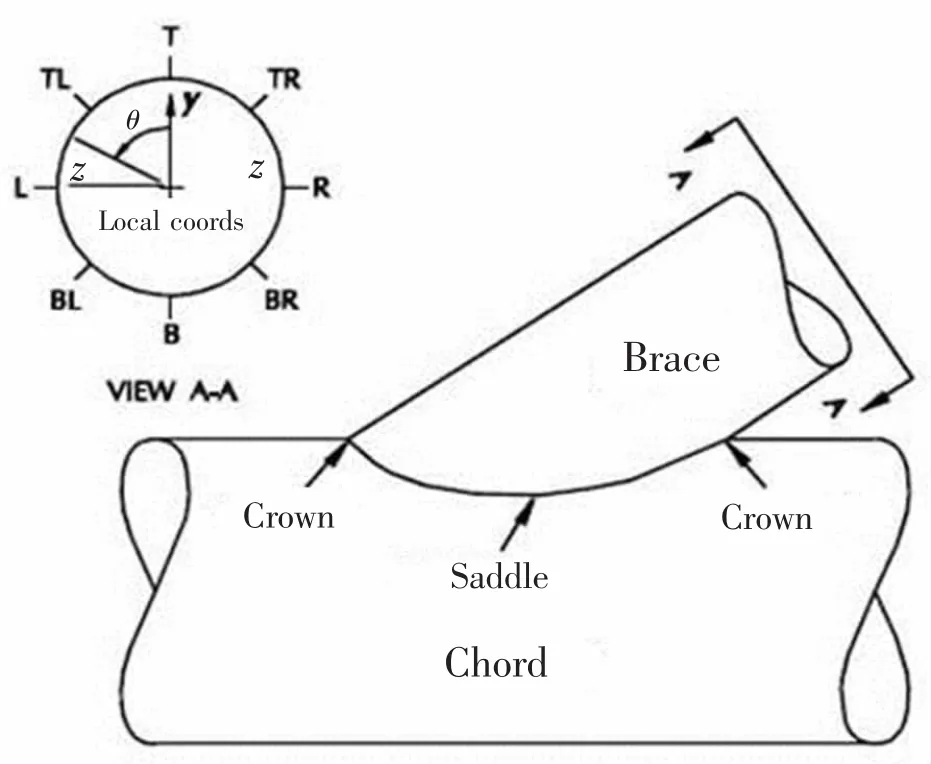
Fig.6 The distribution of eight hot-spot position

The max first principle stress is selected to extrapolate the hot-spot stress as given in the following equation:where σhot-spotis the hot-spot stress,RBrepresents the radius of the brace,TBrepresents the thickness of the brace.
For extrapolation of stress along the chord surface normal to the weld toe at the crown position,the distance of C and D points away from the weld toe as indicated in Fig.8 and in Eqs.(15)and(16):
The max first principle stress is selected to extrapolate the hot-spot stress as given in the following equation:
Fig.7 The direction of the stress extrapolation
where σhot-spotis the hot-spot stress,Rcrepresents the radius of the chord,Tcrepresents the thickness of the chord.
Fig.8 The stress extrapolation points at the brace and chord
For non-tubular welded joints,recommended stress evaluation points are located at distance 0.5t and 1.5t away from the hot spot shown in Fig.9,where t is the plate thickness at the weld toe.
2.2 Fatigue damage analysis of the welded joints
Fatigue damage analysis is pursued within the Miner-Pmlmgren theory.The damage formula is as follows:
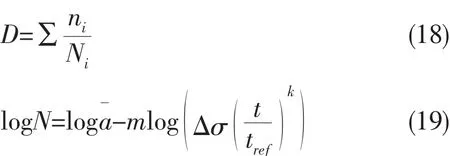
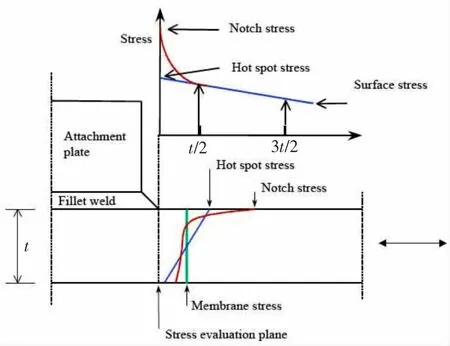
Fig.9 The stress extrapolation points at non-tubular joints
where m is the negative inverse slope of the S-N curve,loga¯is intercept of logN axis,trefis the reference thickness equal 25 mm for welded connections other than tubular joints.For tubular joints the reference thickness is 32 mm.t is the thickness through which a crack will most likely grow.t=trefis used for thickness less than tref.k is the thickness exponent on fatigue strength as given in table.
In this paper,T curve is adopted to calculate the damage of the tubular joints which is under the sea according to DNV rules.While D curve is used for the transition piece and the slope joints which is in the air.Detailed parameters of the S-N curve is given in Tab.4.
In order to verify the reliability of fatigue assessment under three different loads,fatigue damage of the jacket support structure is calculated with the time-domain load,fatigue load spectrum and equivalent fatigue load which are described in Section 1.3-1.5.Five typical welded joints including three tubular joints and two non-tubular joints as shown in Fig.5 are selected to make the result accurate and reliable.
Tabs.5-9 give the damage calculation results of three wind loads.In Figs.10-14,the red represents the fatigue damage result on the hot-spot location of every typical joint by considering time domain loads;the blue represents the fatigue damage result on the hot-spot location of every typical joint by considering fatigue load spectrum;the yellow represents the fatigue damage result on the hot-spot location of every typical joint by considering equivalent fatigue loads.For the 5 welded joints considered,the cumulative fatigue damage shows the same discipline,the damage under fatigue load spectrum is the largest,followed by that under equivalent fatigue loads,and the damage under time domain loads is the smallest.
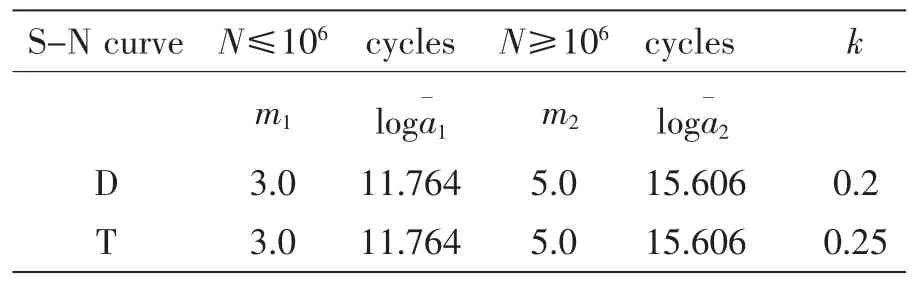
Tab.4 S-N curves
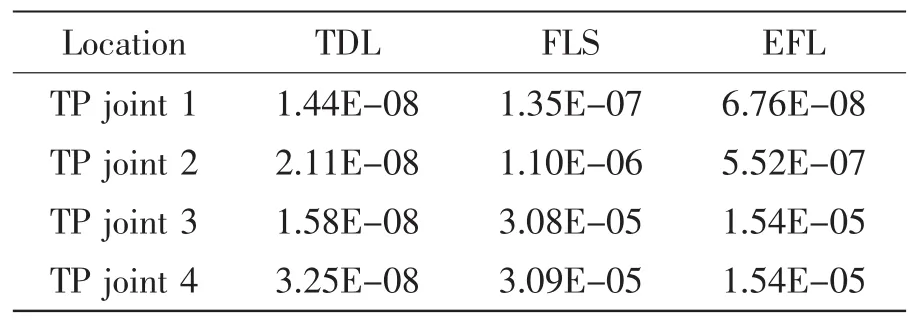
Tab.5 The damage of TP joints
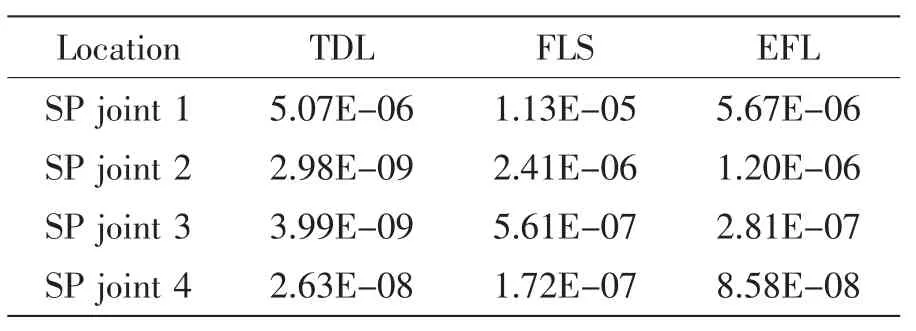
Tab.6 The damage of SP joints
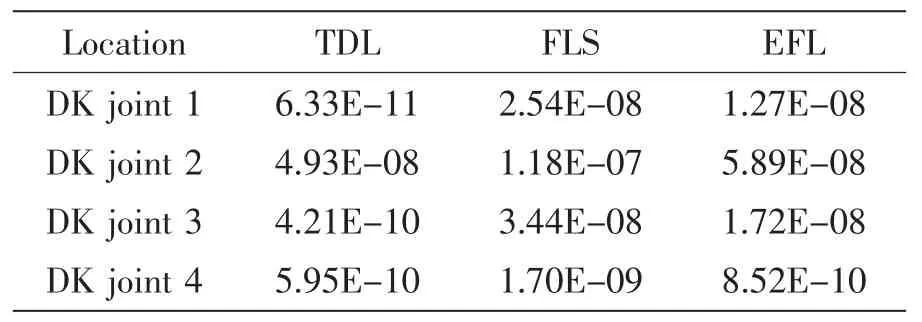
Tab.7 The damage of DK joints
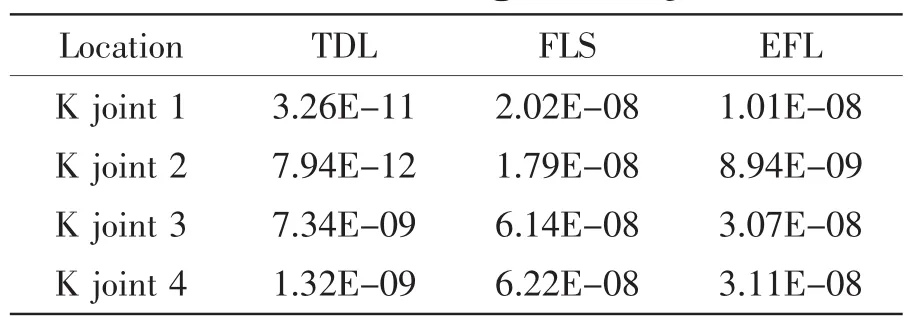
Tab.8 The damage of K joints
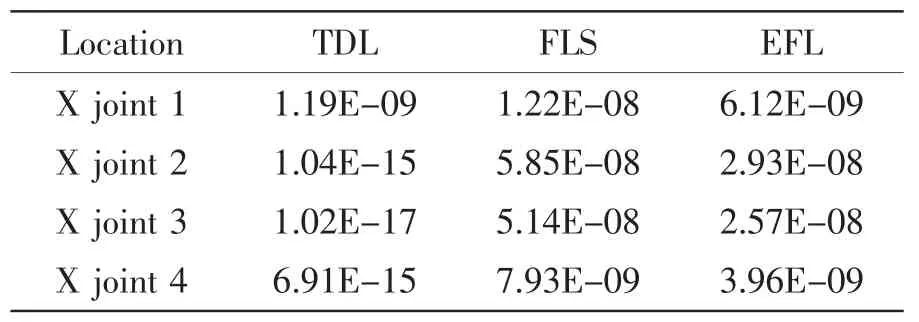
Tab.9 The damage of X joints
Where the maximum of the damage result occurs depends on load cases,For the case of time domain loads,the dangerous spot is located at the slope joint 1;for the case of fatigue load spectrum and equivalent fatigue loads,the dangerous spot is located at the same position,named as transition piece joint 4.
The time domain fatigue analysis is considered as accurate assessment methods,but it is time-consuming.From the design point of view,the results calculated by fatigue load spectrum and equivalent fatigue loads can be considered as conservative and safe.While from the perspective of cost,the fatigue damage under equivalent load spectrum and equivalent fatigue loads is much larger than the damage from the time domain loads.Therefore,fatigue load spectrum and equivalent fatigue loads can only be used in the preliminary design stage.

Fig.10 The damage of TP joints
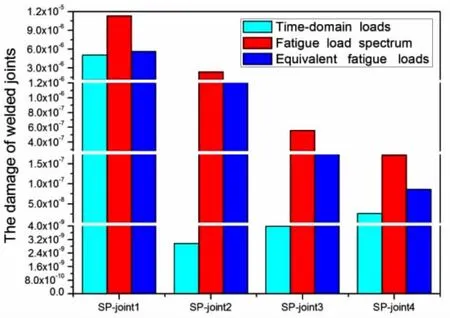
Fig.11 The damage of SP joints
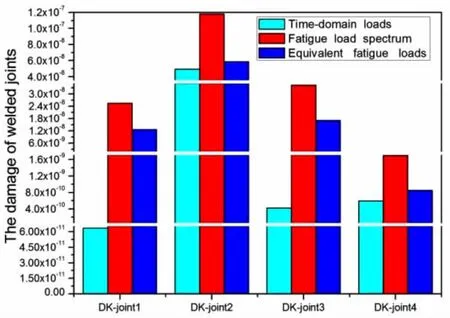
Fig.12 The damage of DK joints
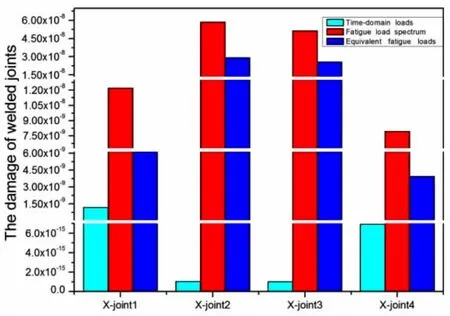
Fig.14 The damage of X joints
Further studies on the equivalent loads are as given in table and figure.In Figs.15-19,100%stands for the total fatigue damage under six fatigue load components:Fx,Fy,Fz,Mx,My and Mz;the light green stands for the ratio of the damage from Mx fatigue load to cumulative fatigue damage from equivalent fatigue loads;the red stands for the ratio of the damage from My fatigue load to cumulative fatigue damage from equivalent fatigue loads;the blue stands for the ratio of the damage from Mz fatigue load to cumulative fatigue damage from equivalent fatigue loads;the yellow stands for the ratio of the damage from Fx fatigue load to cu-mulative fatigue damage from equivalent fatigue loads;the red stands for the ratio of the damage from Fy fatigue load to cumulative fatigue damage from equivalent fatigue loads;the remaining part stands for the ratio of the damage from Fz fatigue load to cumulative fatigue damage from equivalent fatigue loads.For TP joints and SP joints,the cumulative fatigue damage is dominated by Fx,Fy,Mx and My fatigue loads;for DK joints,K joints and X joints,the cumulative fatigue damage is dominated by Fx,Fy,Mx,My and Mz fatigue loads.Fz fatigue loads are considered to have a negligible effect on the fatigue damage.

Fig.15 The damage contribution for TP joints
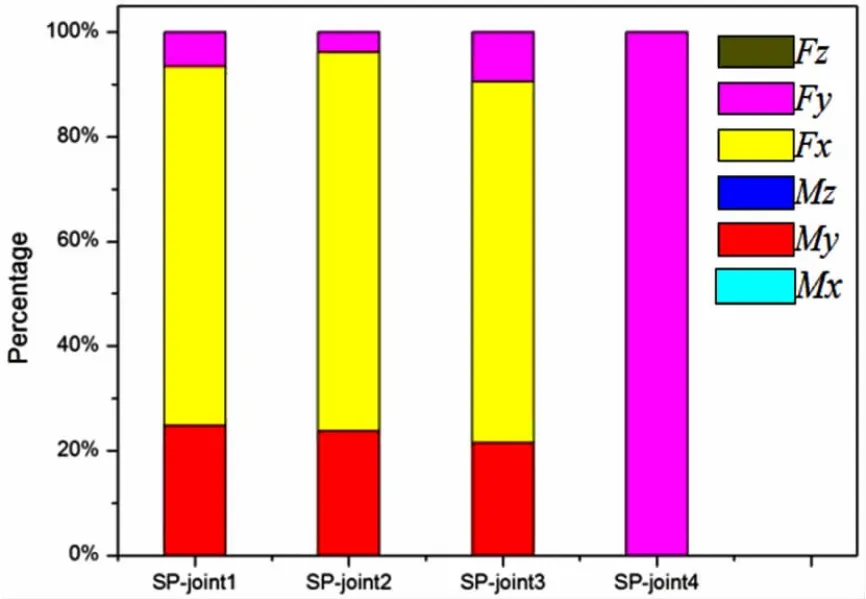
Fig.16 The damage contribution for SP joints
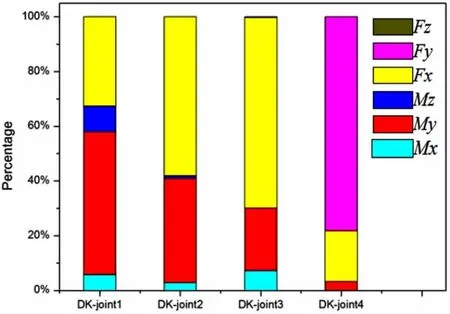
Fig.17 The damage contribution for DK joints
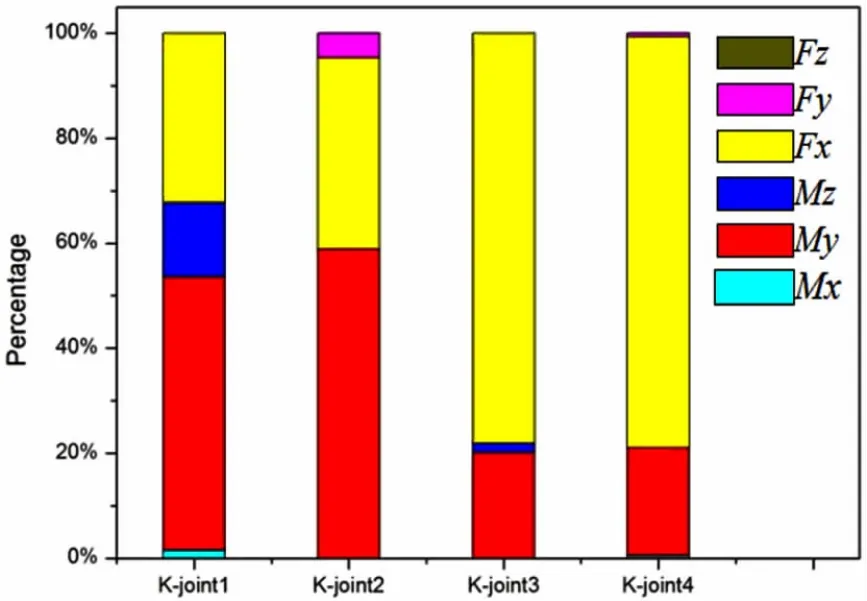
Fig.18 The damage contribution for K joints
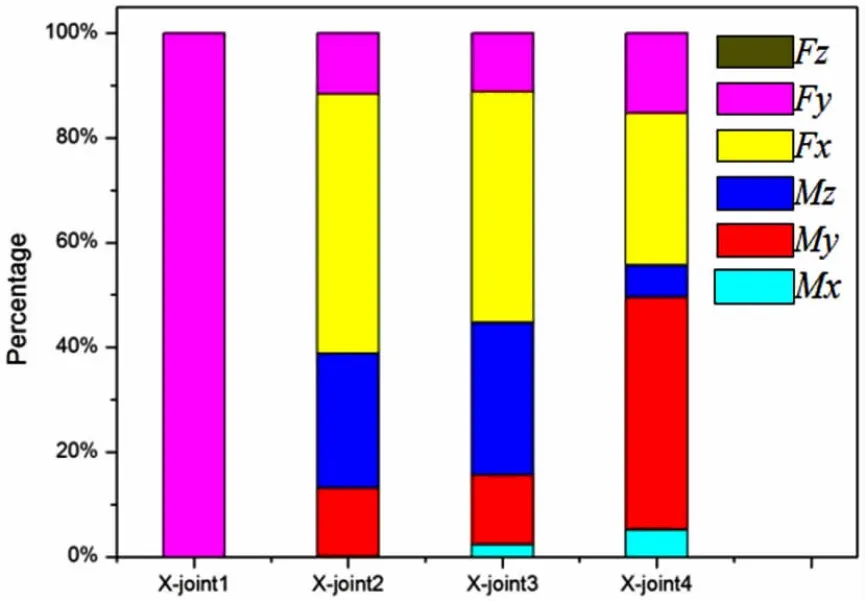
Fig.19 The damage contribution for X joints
3 Conclusions
This paper does a fatigue analysis of a fixed jacket offshore wind turbine,considering three load cases:time domain wind loads,fatigue load spectrum and equivalent fatigue loads.The main purpose is to verify the reliability of fatigue assessment under fatigue load spectrum and equivalent fatigue loads,to analyse the contribution of fatigue damage from six fatigue load components to the total damage.
The main conclusions obtained in this paper are as follows:
(1)The hot-spot stress approach may be used to calculated some special welded joints.
(2)The fatigue damage results from fatigue load spectrum and equivalent fatigue loads are conservative,comparing with those from time domain loads,The latter one is more accurate than the former two,but the former two are simpler,and can be a fast fatigue analysis method in the preliminary design stage of offshore wind turbines.
(3)For the equivalent fatigue load method,the dominant contribution to the cumulative damage is from Fx,Fy,Mx,My and Mz fatigue loads,Fz fatigue loads can be negligible,the study can provide the basis for structural fatigue optimization,which is very valuable in practical engineering applications.
[1]Seidel M.Jacket substructures for the REpower 5M wind turbine[C]//In:Conference Proceedings European Offshore Wind 2007.Berlin,2007.
[2]Klose M,Dalhoff P,Argyriadis K.Integrated load and strength analysis for offshore wind turbines with jacket structures[C].In:Proc.17th ISOPE,2007.
[3]Yeter B,Garbatov Y,Guedes Soares C.Spectral fatigue assessment of an offshore wind turbine structure under wave and wind loading[M].Developments in Maritime Transportation and Exploitation of Sea Resources,Taylor&Francis Group,London,2014.
[4]Dong Wenbin,Moan T,Gao Zhen.Fatigue reliability analysis of the jacket support structure for offshore wind turbine considering the effect of corrosion and inspection[J].Reliability Engineering and System Safety,2012,106:11-27.
[5]Dong Wenbin,Moan T,Gao Zhen.Long-term fatigue analysis of multi-planar tubular joints for jacket-type offshore wind turbine in time domain[J].Engineering Structures,2011,33:2002-2014.
[6]Radaj D,Sonsinob C M,Fricke W.Recent developments in local concepts of fatigue assessment of welded joints[J].International Journal of Fatigue,2009,31:2-11.
[7]Madsen P H,Dekker J W M,Thor S E,et al.Expert group study on recommended practices for wind turbine testing and evaluation,‘3.Fatigue Loads’[M].2nd.Edition.IEA Wind Energy Conversion Systems,1990.
[8]Lange C H.Probabilistic fatigue methodology and wind turbine reliability[D].(Stanford University Ph.D.thesis)SAND96-1246,Sandia National Laboratories,1996.
[9]IEC 61400-3:Wind turbines,Part 3:Design requirements for offshore wind turbines[Z].Edition 1.0,2009.
[10]Lozano-Minguez E,Brennan F P,Kolios A J.Reanalysis of offshore T-joint fatigue life predictions based on a complete weld profile model[J].Renewable Energy,2014,71:486-494.
[11]Det Norske Veritas:DNV-RP-C203:Fatigue Design of Offshore Steel Structures[S].2012.
海上风机在三种风载荷作用下的疲劳分析方法研究
韩超帅,马永亮,曲先强,张 猛
(哈尔滨工程大学 船舶工程学院,哈尔滨 150001)
文章提出一种基于等效疲劳载荷的快速有效的结构优化设计方法,首先通过bladed模拟得到时域下的风载荷,然后通过雨流计数法则和等效损伤理论得到相应的疲劳载荷谱和等效疲劳载荷,接着以导管架式海上风机为例,利用AN-
SYS对其进行三维建模,选取三种典型管节点和两种非管节点,基于热点应力法计算了其在三种风疲劳载荷作用下的疲劳损伤,通过比较三种载荷作用下的疲劳损伤结果,验证了等效疲劳载荷的可靠性。接着又计算了各等效疲劳载荷分量单独作用下的海上风机焊接节点的疲劳损伤,得出各疲劳载荷分量对疲劳总损伤的贡献,可以为设计者提供更好的载荷设计依据。相比于传统的时域疲劳分析方法和疲劳载荷谱方法,等效疲劳载荷方法更加方便有效。
海上风机;热点应力;时域风载荷;疲劳载荷谱;等效疲劳载荷
U661.43
A
韩超帅(1989-),男,哈尔滨工程大学船舶工程学院博士研究生;
马永亮(1983-),男,哈尔滨工程大学船舶工程学院博士研究生,通讯作者,E-mail:mayongliang@hrbeu.edu.cn;
曲先强(1978-),男,哈尔滨工程大学船舶工程学院副教授;
张 猛(1988-),男,哈尔滨工程大学船舶工程学院博士研究生。
U661.43 Document code:A
10.3969/j.issn.1007-7294.2017.12.008
date:2017-03-11
Supported by the Research Fund for the Docoral Program of Higher Education of China(Grant No.160010110005)
Biography:HAN Chao-shuai(1989-),male,Ph.D.student,E-mail:hanchaoshuai@hrbeu.edu.cn;MA Yong-liang(1983-),male,Ph.D.supervisor,corresponding author,E-mail:mayongliang@hrbeu.edu.cn.
1007-7294(2017)12-1527-13
猜你喜欢
杂志排行

船舶力学的其它文章
- A New Method for Fast Estimation of Collision Dissipated Energy and Its Application in Ship-Platform Collision Accident
- Optimization of Composites Shell Subjected to Hydrostatic Pressure to Maximize Design Pressure Factor
- Experimental Study on Strength and Fatigue of Sandwich Composite L-joint under Bending
- Algorithm Simulation of Ship Dynamic Positioning Using Adaptive Fading Memory Filter
- Enhanced Extinction Curve Method for Roll Damping Estimation
- Numerical Predictions of the PPTC Propeller Tip Vortex Cavitation in Uniform Flow