Activation of the Akt/mTOR signaling pathway: a potential response to long-term neuronal loss in the hippocampus after sepsis
2017-12-15JiananGuoLinyuTianWenyuLiuJieMuDongZhou
Jia-nan Guo, Lin-yu Tian, Wen-yu Liu, Jie Mu, Dong Zhou
Department of Neurology, West China Hospital, Sichuan University, Chengdu, Sichuan Province, China
How to cite this article:Guo JN, Tian LY, Liu WY, Mu J, Zhou D (2017) Activation of the Akt/mTOR signaling pathway: a potential response to long-term neuronal loss in the hippocampus after sepsis. Neural Regen Res 12(11):1832-1842.
Funding: This study was supported by the National Natural Science Foundation of China, No. 81301659, 81401077.
Introduction
Sepsis is a common but severe condition with high mortality in intensive care units. Improvements in sepsis treatment have caused the mortality rate of sepsis to decrease from 70–80% to 20–30% in recent two decades (Marik, 2011). As the number of survivors of sepsis increases, cognitive dysfunction, as a sequela of sepsis, has become a major longterm issue. A prospective cohort study of 516 survivors of sepsis reported that 10.6% of survivors were predicted to suffer from medium to severe cognitive impairment, typically lasting for at least 8 years from initial infection (Iwashyna et al., 2010). Sepsis survivors have also been reported to suffer from permanent cognitive deficits after recovery (Semmler et al., 2013). Moreover, long-term cognitive decline is not limited to older patients or patients with cognitive dysfunction at baseline; young people with normal cognitive function may also exhibit long-term cognitive impairment after critical illnesses like sepsis (Pandharipande et al., 2013). Although the survival rate of sepsis has increased, the quality of life of sepsis survivors is often severely impacted by the decline of cognitive function. The exact mechanisms underlying this cognitive impairment are currently unclear. However, several hypotheses have been proposed, including neuroinflammation, vascular injury, and oxidative stress in the limbic system(Annane and Sharshar, 2015). Stress, hospitalization, steroids and depression have been found to exert interaction effects on cognitive impairment (Mathews et al., 2014).
The hippocampi are located in the mesial temporal lobe,and are highly sensitive to ischemia or hypoxia compared with other parts of the cerebrum (Lim et al., 2004; Li et al.,2017). Neuronal loss in the hippocampus is correlated with cognitive impairment, particularly affecting learning and memory abilities in mice (Li et al., 2013; Liu et al., 2016). In addition, one study exploring long-term changes in brain structure after sepsis reported atrophy in the left hippocampus in sepsis patients compared with healthy controls(Semmler et al., 2013).
The mammalian target of rapamycin (mTOR) signaling pathway plays a central role in regulating the initiation of translation for inducing the long-lasting synaptic formation responsible for establishing long-term memory (Hoeffer and Klann, 2010). Akt is a kinase that responds to growth factor stimulation and provides survival signals for neurons (Ahn,2014). In physiological conditions, the Akt/mTOR signaling pathway provides crucial signals for neuronal survival. mTOR activates Akt by phosphorylating Ser473 through mTOR complex 2. Phosphorylated Akt mediates the survival of neurons(Canal et al., 2014). When neurons are under stress, inhibition of Akt phosphorylation may lead to neuronal death (Carloni et al., 2010). However, the mechanisms underlying cognitive impairment after sepsis, and the involvement of the Akt/mTOR signaling pathway in this process, are still unclear.
Because activation of the Akt/mTOR signaling pathway provides survival signals for neurons, we hypothesized that,as an indication of cognitive function, neuronal count in the hippocampus would be correlated with the level of activation of the Akt/mTOR signaling pathway in our mouse model of sepsis. Thus, the current study sought to identify the potential relationship between cognitive impairment after sepsis and the Akt/mTOR signaling pathway. To investigate this issue,we used a cecal ligation-and-puncture (CLP) septic Kunming mouse model as anin vivomodel for sepsis.
Materials and Methods
Animal model of sepsis
The CLP model is considered the gold standard animal model for sepsis, mimicking the natural route of infection, which involves the loss of natural barriers for preventing infection(Hubbard et al., 2005). Although injecting endotoxin into mice is a relatively easy method for producing a sepsis model,this approach can only produce models with Gram negative bacterium infection. However, according to Dong et al.,76.3% of sepsis in neonates is caused by Gram positive bacteria (Dong et al., 2017). Thus, we chose the CLP method to construct a mouse model of sepsis.
All studies performed on animals were approved by the Committee on Ethical Use of Animals of West China Hospital, Sichuan University, China (approval No. SYXK2008-098). A total of 66 specific-pathogen-free male Kunming mice (1 month old, 18–22 g, outbred group mice; Dashuo Experimental Animal Company, Chengdu, China; license No.SCXK [Chuan] 2014-028) were used to generate CLP sepsis mouse models. Mice from the CLP group were intraperitoneally anesthetized with 3.5% chloral hydrate (0.1 mL/10 g body weight). A 1 cm long midline incision was performed under the xiphoid to expose the cecum, with adjacent intestine. The cecum was ligated with a 4-0 silk suture (Mersilk,Ethicon) at 2 mm above ileocecal valve, then perforated with a 22-gauge needle twice in the middle of the cecum. The cecum was squeezed gently to leak a small amount of feces from the puncture sites. The cecum was returned to the abdominal cavity and the abdominal cavity was closed using a 4-0 silk suture. Normal saline 0.5 ml was intraperitoneally injected 5 minutes after the surgery, as resuscitation volume. Three hours after the surgery, the first dose of imipenem/cilastatin(Tienam; Merck Sharp & Dohme Ltd.) was given intraperitoneally (333.33 mg/kg) to prevent incision infection and perioperative death. The same dose of imipenem/cilastatin was given every 12 hours from the first to third days after surgery to control the mortality of sepsis. Mice from the sham group received only the same incisions as in the CLP group to expose the cecum. The abdominal cavity was then closed using a 4-0 silk suture. There was no ligation or puncture on the cecum in the sham group. Only one dose of imipenem/cilastatin was given to the sham group 3 hours after surgery to prevent incision infection. Detailed information regarding mouse grouping is shown inFigure 1.
Rapamycin administration
The sham group included 12 mice, and the other 54 mice were set in CLP group. All mice undergoing surgery were divided into two groups: a control group (n= 27) and a rapamycin group (n= 27). In the rapamycin group, all mice were given 1 mg/kg rapamycin (0.5 mL solution) from day 5 to day 9 after surgery. In the control group, mice underwent the same surgery, but an equal volume (0.5 mL solution) of saline was given after surgery, instead of rapamycin. Rapamycin was used as a specific inhibitor of mTOR Complex 1 in the mTOR signaling pathway (Laplante and Sabatini, 2012). Rapamycin(Abcam, Cambridge, UK) was dissolved in 5% polyethylene glycol 400 (Sigma-Aldrich Co. LLC, St. Louis, MO, USA),Tween 80 (Sigma-Aldrich Co. LLC) in phosphate-buffered saline (Hyclone, Logan, UT, USA). Rapamycin solution was intraperitoneally given every 24 hours for 5 consecutive days.According to Kruse et al. (2016), patients with sepsis suffered the crisis of survival twice in a “two-phase model”:the first peak was in the first 15 days, while the second peak occurred 30–40 days after initial infection. Thus, we used observation time points at day 14 (acute phase), day 30 (subacute phase) and day 60 (chronic phase) after initial infection,based on the double crisis theory. The observation of acute,subacute and chronic groups ended on day 14, day 30 and day 60, respectively.
Morris Water Maze (MWM) behavioral test
We tested the spatial learning function of Kunming mice using the MWM. The basic procedure of MWM followed the instructions and protocols described by Vorhees and Williams(2006). The MWM test was performed in a circular tank with a diameter of 1.5 m. A 5 cm platform was placed at the center of a quadrant. The water temperature was kept at 25°C. Each mouse was trained for 5 days to search for the platform in the tank. On each training day, four trials were performed at four different starting points of each quadrant. Escape latency, the time taken in searching the platform in five consecutive days during each training was recorded to assess spatial learning ability. If a mouse could not find the platform within 60 seconds, the researcher guided the mouse to find the platform.The mouse was then forced to stay on the platform for 20 seconds and their escape latency was recorded as 60 seconds.
After spatial acquisition training, test trials were performed on 5 consecutive days. MWM tests were given to mice in both the CLP and sham groups. For acute, subacute and chronic subgroups, the MWM test was performed at different time points according to the subgroups. The acute group performed a spatial acquisition test from day 10 to day 14 after surgery.The test for subacute group started at day 24 after surgery. In the chronic group, the test started at day 54 after surgery.
Preparation of hippocampal tissue
When mice in each group reached the end point of observation, they were sacrificed by intraperitoneal injection with 3.5% chloral hydrate, 0.1 mL/10 g body weight to narcotize the mice before breaking the neck. The brains were extracted,and different preservation methods were performed based on the subsequent analysis.
Nissl staining and immunohistochemical staining
Brain tissues were drop-fixed in 10% neutral formaldehyde and embedded in paraffin. Coronary sections of hippocampus between 1.70 and 2.70 mm posterior to the bregma were obtained using a Leica RM 2135 system (Leica Biosystems Nussloch GmbH, Germany). paraffin sections (4 μm per section)were subjected to Nissl staining and immunohistochemistry staining. In Nissl staining, methylene blue Nissl stain was used.The Nissl staining protocol followed that of Paul et al. (2008).For immunohistochemistry staining, antigen retrieval was achieved by incubation in citrate antigen retrieval solution at 97 °C for 30 minutes. Antibodies used in immunohistochemistry staining included: primary antibody: mTOR (monoclonal rabbit antibody; 1:50); Akt (monoclonal rabbit antibody; 1:100);phospho-AKT(Ser473) (monoclonal rabbit antibody; 1:50;Cell Signaling Technology, Inc. Danvers, MA, USA); phospho-mTOR(Ser2448) (monoclonal rabbit antibody; 1:50; Abcam, Cambridge, MA, USA). For the secondary antibodies, we used an Envision™Detection Kit (goat anti-rabbit antibody;Dako, Glostrup, Hovedstaden, Denmark). The secondary antibodies were incubated at 37°C for 30 minutes. Images were obtained with an Olympus digital camera (Olympus DP manager, Shinjuku, Tokyo, Japan) and analyzed with Image-Pro plus 6.0 (Media Cybernetics, Inc, Rockville, MD, USA).
Neuronal counting and estimation of neuronal size
Neurons in the cornu ammonis 1 (CA1) region of the hippocampus were counted manually with the assistance of Image-Pro plus 6.0 software at 200× magnification. After slicing continuously, we took one section from every five sections for Nissl staining. Neurons of the whole CA1 region (Paxinos and Franklin, 2013) on three discontinuous sections of Nissl staining were counted. Nissl bodies were considered as symbols of neurons. Only cells with Nissl bodies and intact cell membrane were counted. Glial cells or neurons without intact cell membrane were not counted. The size of neuron cell bodies and nucleoli in CA1 region of the hippocampus was estimated using Image-Pro plus 6.0 software at 400× magnification. All neurons with intact cell membrane and nuclei were analyzed.The areas of the neuron cell body and nucleoli were recorded and analyzed.
Western blot assay
For protein analysis, bilateral hippocampi were separated from the surrounding cerebral cortex immediately after mice were sacrificed. Hippocampus tissue was kept at −80°C before analysis. The tissue was then homogenized using a lysis buffer, then centrifuged at 12,000 ×gat 4°C for 15 minutes.Each sample was adjusted to an equal concentration of protein. Equal amounts of protein were loaded and resolved by sodium dodecyl sulfate polyacrylamide gel electrophoresis through 10−12.6% gels (AkT, pAkT were 12.6%, mTOR,phospho-mTOR were 10%). β-Actin was used as a loading control. All gels were transferred to a nitrocellulose membrane and all protein samples were quantified by autoradiographs using Gel-Pro analyzer 4.0 (Media Cybernetics, Inc).Phosphorylated-mTOR (phospho-mTOR) is the activated form of mTOR, and the proportion of phospho-mTOR to mTOR represents the level of activation of mTOR. Similarly,phosphorylated-Akt (phosphor-Akt) represents the activated form of Akt. Thus, the ratio of the phosphorylated form to the total amount of mTOR and Akt was used to evaluate the activation level of the signaling pathway. The following antibodies were used in western blot assay: anti-mTOR; anti-phospho-mTOR (Ser2448) (monoclonal rabbit antibody;1:1,000; Cell signaling Technology, Inc. Danvers, MA, USA);anti-Akt (monoclonal mouse antibody; 1:2,000), anti-phospho-Akt (Ser473) (monoclonal mouse antibody; 1:1,000)(Cell Signaling Technology, Inc.,), anti-P70S6K; anti-phospho-P70S6K(Thr389) (monoclonal rabbit antibody; 1:1,000;Abcam, Cambridge, MA, USA), and anti-β-actin (monoclonal mouse antibody; 1:3,000; Sigma-Aldrich Co. LLC). All primary antibodies were incubated at 4°C for 12 hours. The secondary antibodies were incubated at 20°C for 60 minutes.
Statistical analysis
Data are presented as the mean ± SD, and were analyzed with SPSS 18.0 software (SPSS, Chicago, IL, USA). Statistical analyses were conducted using analysis of variance, including appropriate variables. Dunnet-ttest was used for pairwise comparisons. Escape latency in the MWM test was analyzed using repeated measures analysis of variance in the general linear model. For comparisons among multiple groups, we used one-way analysis of variance among all groups first, then the least significance difference test was performed for multiple pairwise comparisons between two groups. A value ofP<0.05 was considered statistically significant.
Results
Quantitative analysis of experimental animals
We included all mice that survived to the observation endpoint in the behavioral tests. A total of 20 mice died before the endpoint of observation, 18 of which died within 3 days after surgery. A total of 34 mice undergoing CLP surgery survived, with or without administration of rapamycin (acute group,n= 12; subacute group,n= 10; chronic group,n= 12).The mice in the sham group all survived (n= 12). Detailed information regarding group assignment is shown inFigure 1.All 46 brain samples were divided into two batches: 23 samples from all groups (acute:n= 8; subacute:n= 7; chronic:n= 8) were used for immunohistochemistry. Batch2 included the other 23 samples contributed by a subset of all groups(acute:n= 8; subacute:n= 7; chronic:n= 8), which were used for western blot assay.
MWM performance decreased in the long term after sepsisThe MWM is commonly used to evaluate the function of mouse hippocampus (Vorhees and Williams, 2006). In the spatial acquisition test, escape latency (the time spent searching for the hidden platform) was recorded. Escape latency of mice in both the sham and CLP groups showed a trend of decreasing with time (Figure 2A), indicating that spatial working memory acquisition was preserved in both the CLP and sham groups. The results of the analysis of variance of repeatedly measured data using the general linear model indicated that escape latency among all groups (acute, subacute,chronic and sham) on day 1 was not significantly different(P= 0.601). However, escape latency of different groups started to diverge as training times increased: escape latency was significantly different among all groups on day 4 (P<0.001), and day 5 (P< 0.001). Multiple pairwise comparisons among different groups using the least significance difference test showed that escape latency in the sham group and the chronic CLP group were significantly different on day 4 (P<0.001) and day 5 (P< 0.001), as predicted. For comparisons among sham subgroups without rapamycin, there was no difference in escape latency among acute sham, subacute sham and chronic sham groups (P= 0.893; not shown inFigure 2).Therefore, we merged data of control-sham subgroups into one sham group (n= 6) as representative data for non-postsepsis performance). When we compared the entire curves among different groups, escape latency was significantly different between the sham group and CLP groups (shamvs.acute CLP,P= 0.007; shamvs.subacute CLP group,P=0.001; shamvs.chronic CLP,P< 0.001). Comparisons among CLP subgroups revealed that escape latency was longer in the chronic group than in the acute group (P= 0.042). However,escape latency was not significantly different between the chronic group and subacute group (P= 0.092). Escape latency in the sham, acute, subacute, and chronic groups was similar at day 5 (Figure 2A). These results indicate that there was no difference in MWM performance among CLP groups until the chronic phase after sepsis.
Rapamycin only rescued MWM performance in the acute phase after sepsis
Based on the data above, we compared the escape latency between the rapamycin groups and control groups in both the acute phase and chronic phase of sepsis. The results showed a significant difference in the acute phase (acute rapamycinvs.acute control:P= 0.048), but no significant difference in the chronic phase (chronic rapamycinvs.chronic control:P= 0.658), as shown inFigure 2B, indicating that rapamycin only rescues MWM performance in the acute phase after sepsis.
Long-term neuronal loss in CA1 region of the hippocampus after sepsis
The hippocampal CA1 region plays a critical function in memory processes (Calabresi et al., 2016). Neuronal loss in CA1 region of the hippocampus has been proven to relate to cognitive deficits in patients with Alzheimer’s disease(von Gunten et al., 2006). In the acute, subacute and chronic groups, hippocampi were obtained on days 14, 30 and 60 after CLP surgery. Nissl stain was performed to visualize the neurons in the CA1 region (Figure 3A–D). Each section contained an entire hippocampus. In the sham group and CLP group, on day 14 after surgery, the mean neuron count of three distinct Nissl sections was 1,018 ± 29.5/section and 925 ± 234.8/section, respectively (P= 0.531). The neuron count on days 14, 30 and 60 after CLP surgery was compared among three CLP groups. When analysis of variance was used to compare neuron count in the CA1 region of two groups(Dunnet-ttest), the difference was only significant between the acute and chronic groups (acute groupvs. chronic group:P= 0.043; acutevs.subacute group:P= 0.119; subacutevs.chronic group:P= 0.773;Figure 3E). These results indicate that neuronal loss in the hippocampus after sepsis is a longterm reaction rather than an acute reaction.
Administration of rapamycin in the acute phase after sepsis did not prohibit long-term neuronal loss in the hippocampus
Because the results described above indicated neuronal loss in the long term after sepsis, we compared the neuron count in CA1 region of the chronic rapamycin group with that from the chronic control group (without rapamycin) to examine the effects of short-term administration of rapamycin. As shown inFigure 3F, no significant difference in neuron count was observed between the chronic rapamycin group and chronic control group (P= 0.72). This indicates that short-term administration of rapamycin does not prohibit neuronal loss in CA1 region of the hippocampus, as expected. Previous studies reported that acute treatment of rapamycin does not inhibit mTOR complex2 (mTORC2) signaling, and mTORC2 interacts with Akt to maintain neural survival (Laplante and Sabatini, 2012). This may also explain the lack of a significant difference between rapamycin group and control group.
Timing of Akt/mTOR signaling pathway activation,illustrated by western blot assay
To quantitatively examine the activation of Akt/mTOR signaling pathway, we conducted a western blot assay of proteins involved in the Akt/mTOR pathway in hippocampal tissues.Quantitative densitometric results of all western blot gels are shown inFigure 4.The phosphorylated amount was used as the total amount ratio for evaluating the activation level of the proteins in the Akt/mTOR signaling pathway.
Activation of Akt/mTOR signaling pathway immediately after sepsis
Akt, also known as protein kinase B, is a kinase that mediates signals for cell survival (Ahn, 2014). Because the neuron count in the CA1 region decreased with time after sepsis, we hypothesized that this effect may trigger activation of the Akt pathway. In addition, since phosphorylation of Akt Serine 473 is related to activation of the mTOR pathway (Laplante and Sabatini, 2012), we used the phospho-Akt (pSer473) to Akt ratio to evaluate the level of Akt activation. Phospho-Akt to Akt ratio was lower in the sham group than in the CLP group on day 14 after surgery (P< 0.001;Figure 4A). The phospho-mTOR to mTOR ratio was compared between the sham group and CLP group on day 14 after surgery (P< 0.001;Figure 4B). This result indicates that the mTOR signaling is activated immediately after sepsis. P70S6K is a downstream protein directly phosphorylated by mTOR (Laplante and Sabatini, 2012). The phospho-P70S6K to P70S6K ratio was compared between the sham group and CLP group on day 14 after surgery (P< 0.001;Figure 4C). Combining the status of Akt and mTOR, all of the results suggested that the Akt/mTOR signaling pathway is activated immediately after CLP surgery.
Akt, mTOR and P70S6K are all activated on day 60 after sepsis
Based on the possible relationship between Akt/mTOR sig-naling pathway activation and hippocampus damage after sepsis, we compared Akt activation in the control CLP group on days 14 and 60 after CLP surgery. As shown inFigure 4D,Akt signaling phosphorylation was kept elevating from day 14 to day 60 (P< 0.001). The phospho-mTOR to mTOR ratio was compared in the CLP group at different time points (days 14 and 60) (Figure 4E). The results showed elevated phosphorylation on day 60 compared with that on day 14 (P< 0.001). As shown inFigure 4F, the phosphorylation level of P70S6K was also higher on day 60 than on day 14 (P< 0.001).

Figure 1 Mice assignment in this study.Rapa: Rapamycin; CLP: cecal ligation-and-puncture.

Figure 2 Cognitive functional changes in the mice after sepsis detected by the Morris Water Maze test.(A) Escape latency among different phases after sepsis; (B) escape latency of rapamycin group and control group (both in acute phase and chronic phase after sepsis). Data are presented as the mean, and analyzed using in a general linear model. ***P < 0.001.
Rapamycin inhibited Akt/mTOR pathway, but did not prohibit its activation on day 60 after sepsis
We also tested the activation level of Akt, mTOR and P70S6K in the hippocampus of mice in the 1 mg/kg rapamycin group.After administration of rapamycin after CLP surgery, the activation levels of all the three proteins were lower compared with the control group in both the acute and chronic phases.However, despite inhibition by rapamycin, the activation levels of Akt, mTOR and P70S6K were all increased on day 60,compared with those on day 14 (P< 0.001;Figure 4G–I).

Figure 4 Expression of Akt/mTOR signaling pathway in the mouse hippocampus after sepsis.β-Actin was used as a loading control. (A–C) Ratio of pAkt/Akt (A), pmTOR/mTOR (B) and pP70S6K/P70S6K (C) in the sham group and control CLP group on day 14 after sepsis, which indicated the activation status of the upstream, midstream and downstream of Akt/mTOR signaling pathway. (D–F) Ratio of pAkt/Akt (D), pmTOR/mTOR (E) and pP70S6K/P70S6K (F) between the control CLP group on day 14 and on day 60 after sepsis. (G–I) pAkt/Akt ratio (G), pmTOR/mTOR ratio (H) and ratio of pP70S6K/P70S6K (I) between control CLP group and rapamycin-treated CLP group on days 14 and 60 after sepsis. Acute C: control CLP group on day 14; chronic C: control CLP group on day 60; acute R: CLP group with rapamycin administration on day 14; chronic R: CLP group with rapamycin administration on day 60. Data are presented as the mean ± SD, and analyzed using Dunnett-t test. ***P < 0.001. mTOR: Mammalian target of rapamycin; pmTOR: phospho-mTOR.

Figure 5 Representative immunohistochemical stains in different areas of the hippocampus.(A–F) Immunohistochemical stains of pAkt (at Ser473) in various regions of the hippocampus on days 14 and 60 after sepsis; (G–L) immunohistochemical stains of pmTOR (at Ser2448) in various regions of the hippocampus on days 14 and 60 after sepsis. Black arrows show immunoreactive stain. Scale bars: 20 μm. Day 14: Acute phase; day 30:subacute phase; day 60: chronic phase. DG: Dentate gsyrus; pAkt: phospho-Akt; pmTOR: phospho-mTOR.
Activation of the Akt/mTOR signaling pathway in various regions of the hippocampus over time, as detected by immunohistochemistry
We applied immunohistochemistry to visualize phosphorylated Akt and mTOR in neurons. The immunoreactivities of phospho-Akt (p-Ser473) and phospho-mTOR (p-Ser2448)were negative on day 14 and positive on day 60 in the CA1 and CA3 regions of the hippocampus (Figure 5), indicating the activation of Akt and mTOR in neurons in the CA1 and CA3 regions. Immunoreactive staining of pAkt was detected in the cell membrane of neurons in the CA1 and CA3 regions(Figure 5B, D). pAkt was also detected as immunoreactive in the dentate gyrus of the hippocampus on day 60 post-CLP(Figure 5F). However, we did not detect any immunoreactivity of pmTOR in the dentate gyrus of the hippocampus(Figure 5K, L). These results indicate that the Akt/mTOR signaling pathway is activated in the long term after sepsis in the CA1 and CA3 regions of the hippocampus.
Variation of neuronal size in the hippocampal CA1 region after sepsis
We measured the size of neural cell bodies and their nucleoli in the CA1 region, and conducted comparisons among three groups, examining time after sepsis and neuronal size, rapamycin administration and neuronal size, and comparison of neuronal size in the CLP and sham groups after sepsis (Figure 6).
Comparison among CLP control groups on days 14, 30 and 60 revealed a significant hypertrophy of CA1 neural nucleoli on day 60 compared with that on day 14 (+55.63%;P< 0.001)and day 30 (+36.50%;P< 0.001). However, no significant changes in cell body size were observed in any pairwise comparisons in the three time groups (day 14vs.day 30:P= 0.99;day 14vs.day 60:P= 0.50; day 30vs.day 60:P= 0.59).
Comparison between CLP rapamycin groups and CLP control groups revealed marked hypertrophy of cell body size in the CLP control group. This phenomenon was observed on both day 14 (+40.30%;P< 0.001) and day 60 (+22.37%;P< 0.001). Hypertrophy of nucleoli was observed on day 60(+64.6%;P< 0.001), but not day 14 (P= 0.836).
Comparison between CLP control groups and sham groups revealed that, on both day 14, the nucleoli of CLP group were smaller than that of the sham group (−16.47%;P= 0.015),while the cell body size between the two groups did not show a significant difference (P= 0.952). On day 60, we observed significant hypertrophy of cell body size (+10.86%;P= 0.016) and nucleoli size (+68.25%;P< 0.001) in the CLP control group.
Discussion
Cognitive impairment and neuronal loss in the hippocampus after sepsis
Sepsis involves inflammatory stress in multiple organ systems, and after initial infection, it can cause long-term cognitive dysfunction (Widmann and Heneka, 2014). A recent systemic review of post-sepsis cognitive impairment reported that 12.5% to 21% of survivors of sepsis exhibited cognitive impairment (Calsavara et al., 2017). These cognitive impairments may due to sepsis itself, or to sepsis increasing the brain’s susceptibility to neurodegenerative diseases (Sharshar et al., 2014). Long-term cognitive impairment reduces the life expectancy of sepsis survivors (Shankar-Hari and Rubenfeld,2016). Increased escape latencies in the MWM test reflect hippocampal functional impairment in mice (Lieberwirth et al., 2016). In the current study, we observed prolonged MWM escape latencies in sepsis model mice, indicating that hippocampal cognitive impairment can be detected after CLP surgery. Moreover, the current findings revealed the occurrence of cognitive impairment after sepsis, in both the acute and chronic phases. In addition, cognitive impairment was aggravated in the chronic phase, compared with the acute phase.We observed the continuation of cognitive impairment after sepsis as a chronic sequel. This finding is consistent with a previous prospective cohort study on long-term cognitive impairment after sepsis, which reported the persistence of cognitive impairment for 8 years after recovery from sepsis (Iwashyna et al., 2010). Several clinical studies have also reported various features of long-term cognitive damage after sepsis, including alterations in memory, and impaired concentration (Streck et al., 2008), consistent with the current results. Our findings are also consistent with a previous human study reporting that responses to visual stimulation in sepsis survivors was generally slow compared with healthy controls, and remained slower during long-term follow-up (Götz et al., 2016).
In the current study, rapamycin administration rescued cognitive impairment in the acute phase after sepsis, consistent with another previous study in our lab (Liu et al., 2016). However, short-term administration of rapamycin did not rescue the cognitive impairment in the long term after sepsis. Cognitive impairment in the long term may be explained by neuronal loss in the CA1 region of the hippocampus in the chronic phase after sepsis. Neuronal loss in long-term sepsis mice was also observed in another septic mouse model in which LPS injection was used to induce sepsis (Cardoso et al., 2015).
The CA1 region of the hippocampus is important for learning and memory (Calabresi et al., 2016). According to a previous study, neuron count in CA1 region can be used to evaluate histopathological damage in the hippocampus; moreover, due to the inhomogeneous distribution of neurons in CA1 region(Wang et al., 2015), counting neurons in the entire CA1 band is an accurate method for evaluating the total neuron count in the CA1 region of the hippocampus. On day 14 after surgery,neuron counts in CA1 region were not significantly different between the CLP group and the sham group. This result indicates that sepsis does not cause structural damage in the hippocampus in the short term. However, the CA1 neuron count on day 14 after the CLP surgery was higher than that on day 60. This finding suggests that structural damage in the hippocampus after sepsis may be a time-dependent process, and can only be detected in the long term.
When we compared neuron counts in CA1 region on day 60 in the rapamycin CLP group with that in the control CLP group, the results revealed no significant difference, consistent with performance of these two groups in the MWM test. This finding may be explained by the relatively short administration of rapamycin and/or relatively low dose (1 mg/kg). Another possible explanation is that regulation of neuron count by the mTOR signaling pathway depends more on mTOR C2, a rapamycin insensitive target (Carloni et al.,2010), and is not perturbed by acute administration of rapamycin (Laplante and Sabatini, 2012).
The relationship between neuronal loss in the hippocampus and cognitive dysfunction has been illustrated using several animal models (Murawski et al., 2012; Li et al., 2013). Our results indicate consistency between the occurrence of irretrievable (i.e., not rescued by rapamycin) cognitive impairment(functional damage), and neuronal loss in the hippocampal CA1 region (structural damage), with both occurring in the chronic phase after sepsis, indicating a correlation between them. The current finding of neuronal loss in the CA1 region is also consistent with a previous study of the relationship between prenatal infection and neuron count in the CA1 region, which reported that prenatal exposure to endotoxin led to loss of GABAergic neurons in the hippocampus using a rat model (Nouel et al., 2012).
Akt/mTOR signaling pathway remained activated in the long term after sepsis
The mTOR signaling pathway responds to various stimuli in the environment and regulates a wide range of physiological processes (Laplante and Sabatini, 2012). mTOR C1 functions as a regulator of cell growth and metabolism by promoting anabolic synthesis of proteins, while mTOR C2 regulates cell survival through interaction with Akt, a protein kinase(Laplante and Sabatini, 2009). In the current study, we found that the Akt/mTOR signaling pathway was activated in both the acute and chronic phases after sepsis.
Western blot data from the current study suggested that all of ratios of pAkt/Akt, pmTOR/mTOR and pP70S6K/P70S6K were significantly higher on day 60 than day 14 after sepsis.
The current immunohistochemical analysis revealed immunoreactivity of both Akt and mTOR in the cytoplasm of neurons in the CA1 region. Upon activation of Akt/mTOR signaling, Akt is recruited from the cytoplasm to the cell membrane(Ahn, 2014), while mTOR nucleates at two distinct protein complexes, mTORC1 and mTOR C2, which are located in the cytoplasm (Laplante and Sabatini, 2009). Both of them exist in cytoplasm of cells. mTOR regulates neural survivalviaAkt(Canal et al., 2014). These results indicated that the Akt/mTOR signal pathway maintained activation over time after sepsis.
In all rapamycin groups, the activation of Akt/mTOR pathway was all inhibited compared with the control group.Although rapamycin inhibited the activation of Akt/mTOR pathway, the activation level was still higher in the chronic phase than the acute phase after sepsis. This indicated that short-term administration of a relatively low dose of rapamycin (1 mg/kg) after sepsis does not prohibit activation of the Akt/mTOR pathway in the chronic phase after sepsis.
Progressive neuronal loss after sepsis might have activated the Akt/mTOR signaling pathway as a feedback mechanism
Activation of the Akt/mTOR signaling pathway provides important signals for neural survival (Canal et al., 2014). Signals that activate mTORC2 remain poorly understood, but previous studies have reported that growth factors can activate mTORC2 kinase and increase the phosphorylation of Akt at Ser473 (Laplante and Sabatini, 2009). Akt has complicated interactions with mTORC1 and mTORC2. As the downstream protein of mTORC2, Akt is directly activated by mTORC2 through phosphorylating at Ser473 (Laplante and Sabatini,2012). However, Akt is also an upstream regulator of mTORC1 and activates mTORC1 indirectlyviatwo pathways: by inactivating the TSC1/TSC2 (hamartin/tuberin) (Inoki et al., 2002)or by promoting dissociation of regulatory-associated protein of mTOR (raptor) from proline-rich Akt substrate 40 (Sancak et al., 2010). In the current study, we observed that the activation level of the Akt/mTOR signaling pathway was higher in the chronic phase after sepsis, when neuronal loss in the CA1 region could be detected. Interestingly, previous studies of the relationship between sleep deprivation and hippocampal function reported similar findings, demonstrating that sleep deprivation can impair hippocampal mTOR signaling and ultimately cause loss of CA1 neurons (Havekes and Abel, 2017).
Variation of neuron size in the CA1 region after sepsis
mTOR is reported to function as a central controller of cell growth (Schmelzle and Hall, 2000). In previous studies of Alzheimer’s disease, hypertrophy of neurons in the CA1 region was observed as an early pathological change of Alzheimer’s disease (Iacono et al., 2009). Meanwhile, the mTOR signaling pathway has been proven to play a role in neural size and survival (Bockaert and Marin, 2015). Moreover, mTORC2 has been found to play a critical role in neural size and morphology (Thomanetz et al., 2013). Therefore, in the current study, we also evaluated the size of neurons and their nucleoli as indicators of neural function at the cellular level. The results of comparisons of neuronal size of CA1 region after sepsis revealed complicated variations. Neural cell body size did not change among CLP control groups on days 14, 30 and 60. However, a marked hypertrophy of nucleoli was observed in the long term (day 60) after sepsis. This result indicated increased transcriptional and metabolic activities of neurons,possibly reflecting a compensatory response to neuronal loss(Iacono et al., 2009). A previous study reported that inhibition of the mTOR pathway by rapamycin caused a decrease of neural size (Zeng and Zhou, 2008). This phenomenon was also observed in the current study: rapamycin administration negatively regulated nucleoli size on day 14 and both the cell body and nucleoli size of the CA1 region on day 60. Sepsis affected neuronal size in hippocampal CA1 region: the nucleoli size in the CLP group was smaller than that in the sham group in the acute phase (day 14) after sepsis, while the nucleoli size was larger in the long term (day 60). This biphasic change also consisted with the status of the Akt/mTOR signaling pathway,which was mildly activated in the acute phase and strongly activated in the long term after sepsis. Cell body size in the CLP group did not change in the acute phase after sepsis, while the size was increased on day 60 after sepsis. This finding suggests that the size of nucleoli may be a more sensitive indicator for neural metabolic status.
In the current study, both neuronal loss in the hippocampus and activation of the Akt/mTOR signaling pathway were clearly observed in the long term (day 60) after sepsis. The co-occurrence of these two phenomena suggests that strong activation of the Akt/mTOR pathway may be associated with neuronal loss in the hippocampus. Since activation of the Akt/mTOR pathway plays a critical role in neural survival, we speculated that strong activation of the Akt/mTOR pathway in the long term after sepsis was a type of feedback in response to chronic neuron loss in the hippocampus (Figure 7).The interaction between Akt and mTORC2 formed a closed loop, involving Akt, TSC1/TSC2, Rheb and mTORC2. Activation of Akt promotes activation of mTORC2, which further promotes activation of Akt as a form of positive feedback.Thus, progressive neuronal loss after sepsis may trigger the activation of the Akt/mTOR signaling pathway to maintain neural survival in the hippocampus.
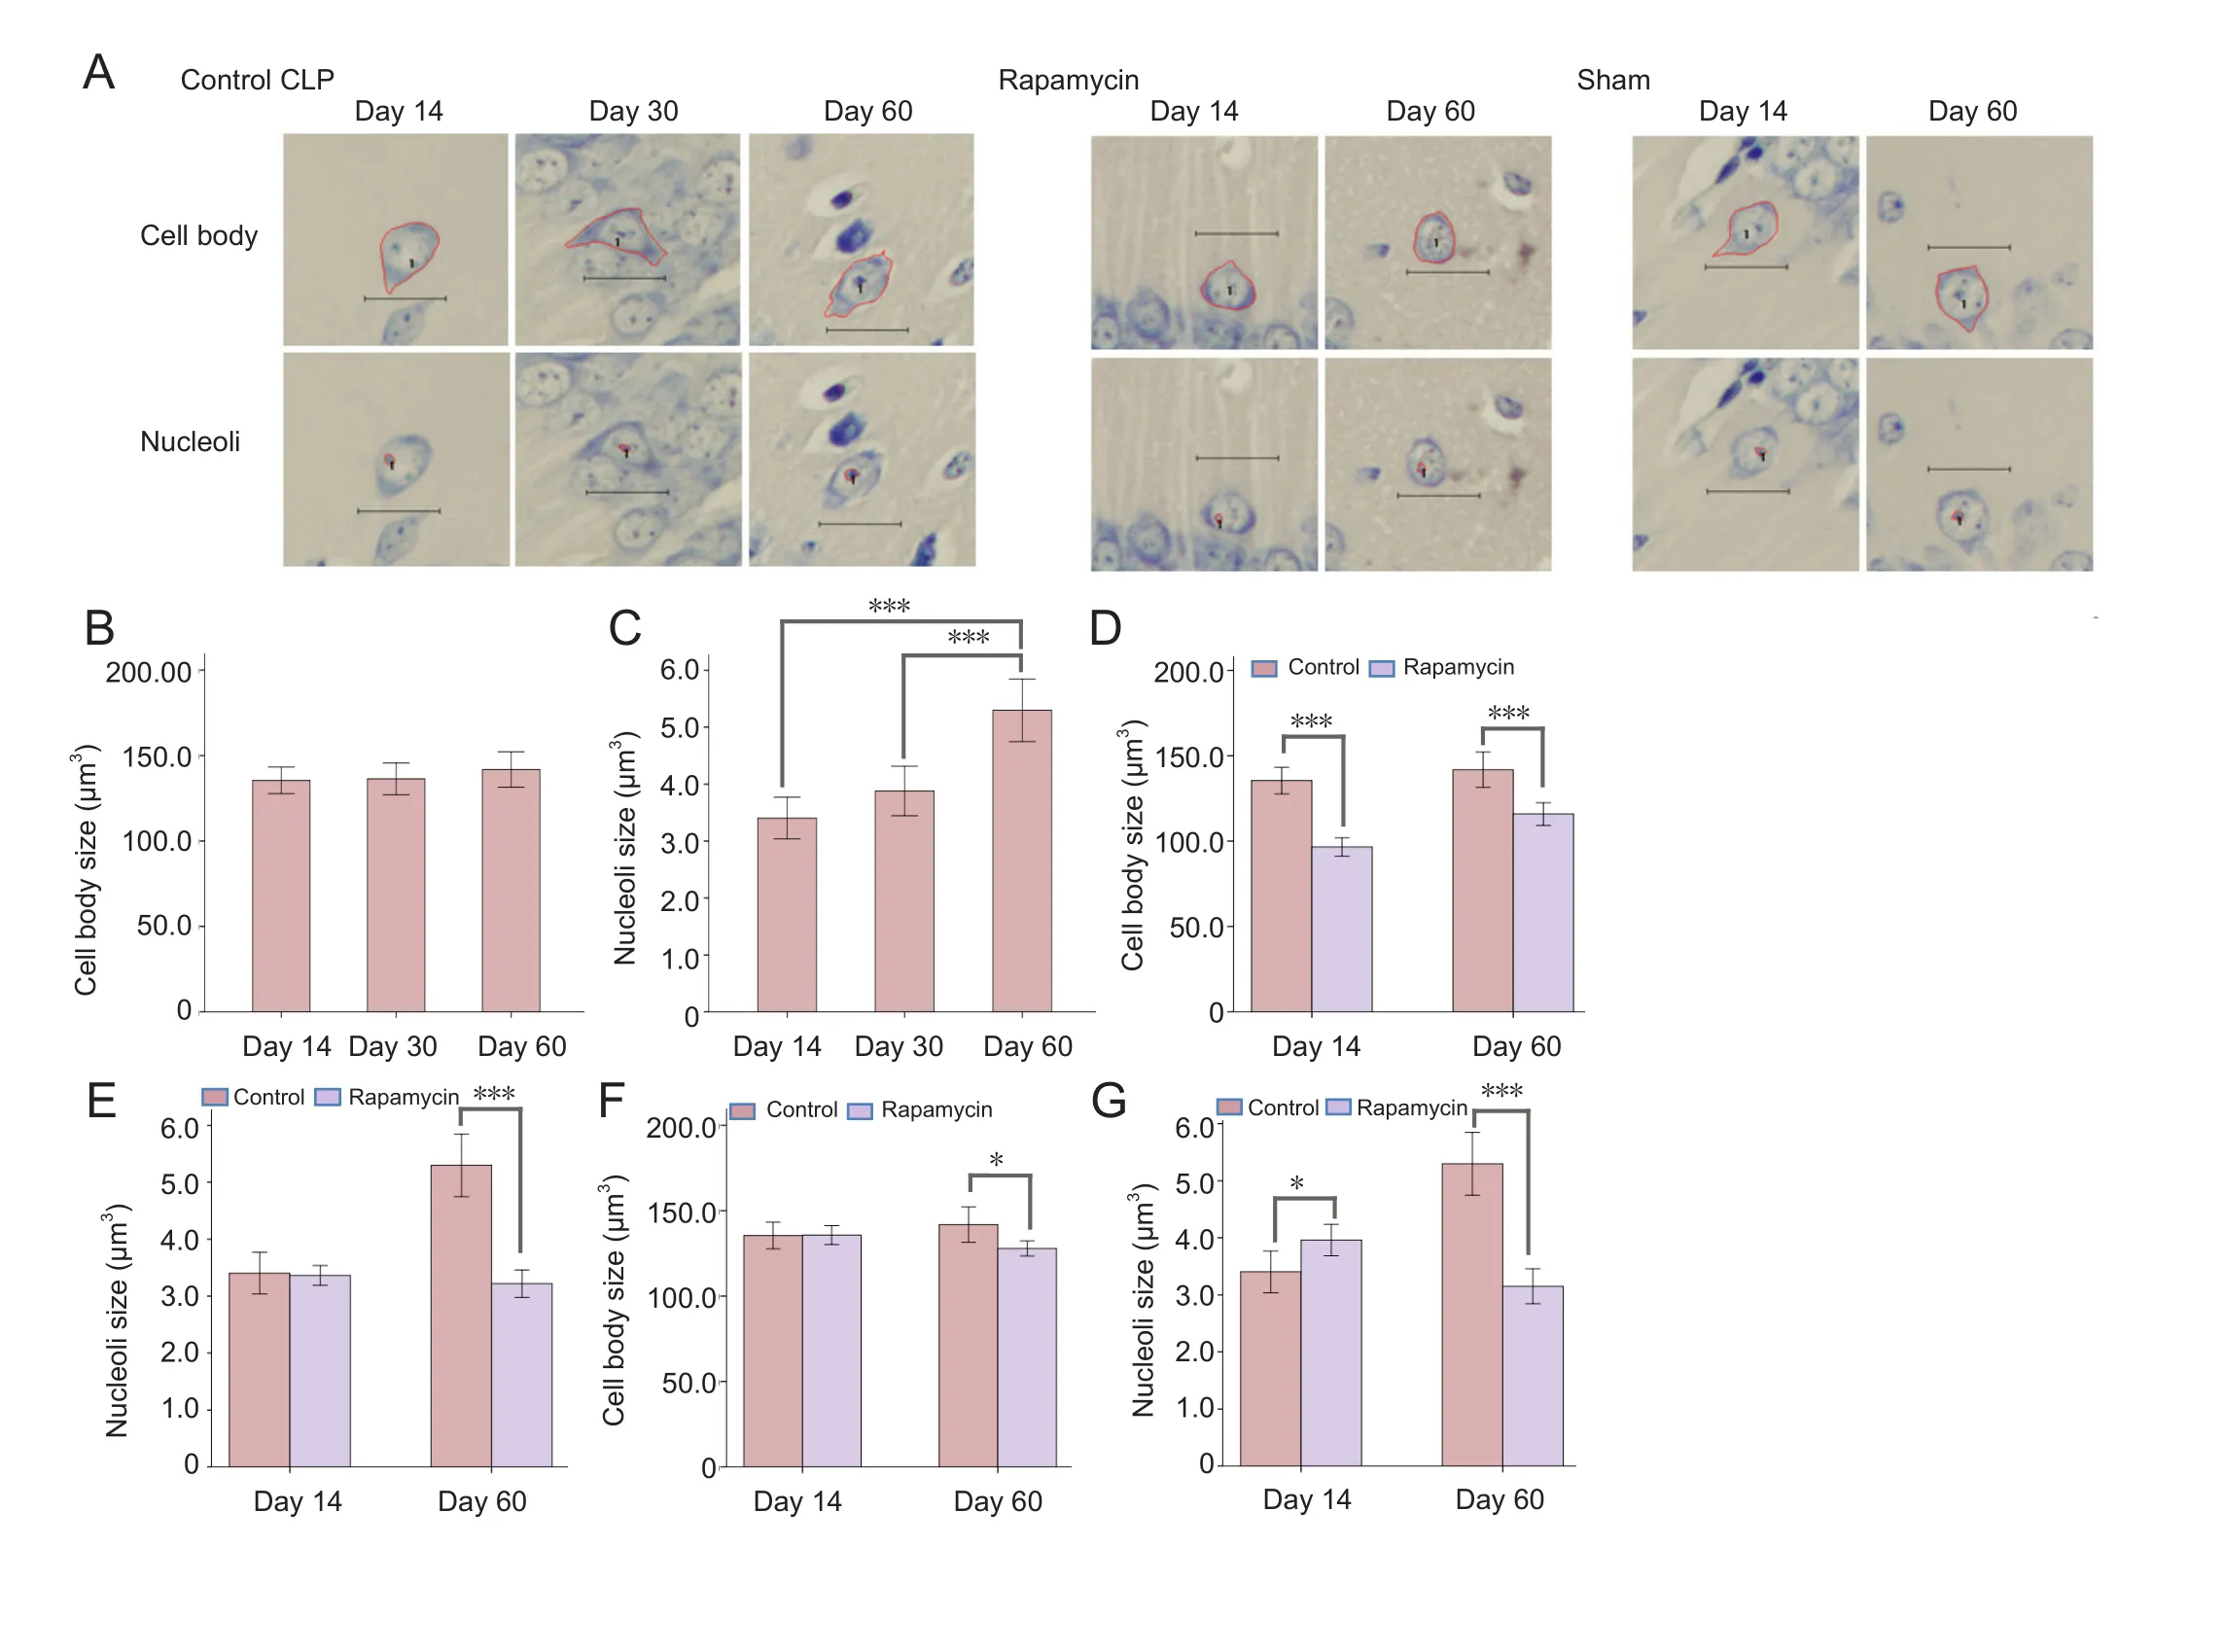
Figure 6 Changes in neural cell morphology of CA1 region in the mouse hippocampus after sepsis.

Figure 7 Molecular interactions in the Akt/mTOR signaling pathway.IP3K: Inositol-triphosphate 3-kinase; PDK: phosphoinositide-dependent kinase; TSC: tuberous sclerosis complex; Rheb: Ras homolog enriched in brain; mTOR: mammalian target of rapamycin.
Although we speculate that activation of the Akt/mTOR pathway may be a feedback response to neuronal loss, the precise function of this activation: (e.g., whether it represents a neuroprotective or pathogenic response) is unclear. However, in sepsis animal models, activation of the mTOR pathway has been observed in a number of previous studies. In the LPS-induced septic rat model, activation of the mTOR pathway in renal, cardiac and vascular tissues was also observed after sepsis (Temiz-Resitoglu et al., 2017). In another study using a CLP sepsis mouse model, enhanced mTOR kinase activity in skeletal muscle was observed after sepsis,whereas the anabolic response to skeletal muscle contraction was attenuated (Steiner and Lang, 2015; Crowell et al., 2017).Previous studies have observed increasing phosphorylation of Akt in neurons in Alzheimer’s disease, which is characterized by neuronal loss (Rickle et al., 2004). In tuberous sclerosis,hyperactivation of mTORC1 has been proven to cause neural damage (Ebrahimi-Fakhari et al., 2016). However, whether this feedback activation of the Akt/mTOR signaling pathway can prevent neuronal loss remains controversial. One study focusing on Akt activation in the brain tissue of patients with Alzheimer’s disease concluded that increasing phosphorylation of Akt may not prevent neuronal loss, and may not even be involved in the pathogenesis of Alzheimer’s disease (Grif fin et al., 2005). Another study examining hippocampal tissue after sepsis demonstrated that the Akt/mTOR signaling pathway was involved in the neuroprotective effects of erythropoietin(Wang et al., 2014). In addition, in a recent study, Howell et al.(2017) found that dysregulated Akt/mTORC2 signaling may cause learning and memory deficits in schizophrenia patients.
Age-related neuronal loss in the hippocampus
Previous studies had proven that neuron count in CA1 region of the hippocampus varied with age (Flood and Coleman,1988). Moreover, older age may be a confounding factor due to both increased risk of sepsis and cognitive function decline(Hopkins, 2013). As such, all the mice included in the current experiment were 1-month-old males when the experiments started, so were still young adults 2 months into the experiments. Thus, in our septic mouse model, it is unlikely that age was a factor in neuronal loss.
mTOR and neural regeneration
In several previous studies of neural regeneration, adult axon regeneration in the central nervous system was found to be modulated by the PTEN/mTOR pathway (Park et al., 2008,2010). In a recent study, retinal axon regeneration was reported to be enhanced by activation of the mTOR signaling pathway (Lim et al., 2016). Meanwhile, P70S6K activation caused by mTORC1 activation was found to promote axon regeneration (Yang et al., 2014). Although the mTORC1 has been proven to promote axon regeneration, Akt/mTORC2 interaction may have a negative effect on axon regeneration in the central nervous system (Miao et al., 2016). Based on the current study and other previous studies, the Akt/mTOR signaling pathway may be a suitable future therapeutic target for regulating neural regeneration in post-sepsis patients. This current study may provide some basis for further exploration for improving post-sepsis cognitive impairment. However, the relationship between the Akt/mTOR pathway and neural regeneration appears to be more complicated than expected.
Conclusion and limitations
The results confirmed cognitive impairment as a long-term sequela after recovery from sepsis in a sepsis mouse model.Moreover, progressive neuron loss in the CA1 region of the hippocampus was observed in the long term after sepsis. The co-occurrence of neuronal loss in the hippocampus and cognitive dysfunction decline indicates that neuronal loss in CA1 region of the hippocampus contributes to cognitive impairment after sepsis. We observed that the Akt/mTOR signaling pathway is activated in the long term after sepsis, simultaneously with neuronal loss in the hippocampus. This finding indicates that progressive neuronal loss in the hippocampus may be a trigger for activation of the Akt/mTOR signaling pathway, as a protective response to prevent further neuronal loss. However,whether this feedback response has any practical neuroprotec-tive effects still needs further exploration.
This experiment involved several limitations, which should be addressed in future studies. First, the relatively short administration of rapamycin only in the acute phase (only 5 days)after sepsis may have been insufficient to completely observe its effect on the Akt/mTOR signaling pathway. Second, only rapamycin was used to specifically block the mTOR Complex1.However, previous studies have reported that mTORC1 and mTORC2 play distinct roles in many cellular processes in the central nervous system (Angliker et al., 2015; Jhanwar-Uniyal et al., 2015, 2017). More specific inhibitors of the mTOR Complex2 should be used to explore the relationship between Akt and the mTOR signaling pathway in future studies. Third,with the development of stereology methods, neuron counting in CA1 region using a stereological system may provide more accurate neuron counts.
Author contributions:JNG and LYT conceived and designed the experiments. JNG and WYL performed the experiments. JNG and JM analyzed the data. DZ and LYT contributed to reagents/materials/analysis tools. JNG and LYT wrote the paper. All authors approved the final version of the paper.
Conflicts of interest:None declared.
Research ethics:The study protocol was approved by the Committee on Ethical Use of Animals of West China Hospital, Sichuan University, China(approval No. SYXK2008-098). The experimental procedure followed the National Institutes of Health Guide for the Care and Use of Laboratory Animals (NIH Publications No. 8023, revised 1978). All efforts were made to minimize animal suffering and the number of animals necessary to produce reliable results.
Data sharing statement:Datasets analyzed during the current study are available from the corresponding author on reasonable request.
Plagiarism check:Checked twice by iThenticate.
Peer review:Externally peer reviewed.
Open access statement:This is an open access article distributed under the terms of the Creative Commons Attribution-NonCommercial-ShareAlike 3.0 License, which allows others to remix, tweak, and build upon the work non-commercially, as long as the author is credited and the new creations are licensed under identical terms.
Ahn JY (2014) Neuroprotection signaling of nuclear akt in neuronal cells. Exp Neurobiol 23:200-206.
Angliker N, Burri M, Zaichuk M, Fritschy JM, Ruegg MA (2015) mTORC1 and mTORC2 have largely distinct functions in Purkinje cells. Eur J Neurosci 42:2595-2612.
Annane D, Sharshar T (2015) Cognitive decline after sepsis. Lancet Respir Med 3:61-69.
Bockaert J, Marin P (2015) mTOR in brain physiology and pathologies. Physiol Rev 95:1157-1187.
Calabresi P, Picconi B, Tozzi A, Ghiglieri V (2016) Interaction between basal ganglia and limbic circuits in learning and memory processes. Parkinsonism Relat Disord 22 Suppl 1:S65-68.
Calsavara AJ, Nobre V, Barichello T, Teixeira AL (2017) Post-sepsis cognitive impairment and associated risk factors: A systematic review. Aust Crit Care doi: 10.1016/j.aucc.2017.06.001.
Canal M, Romani-Aumedes J, Martin-Flores N, Perez-Fernandez V, Malagelada C (2014) RTP801/REDD1: a stress coping regulator that turns into a troublemaker in neurodegenerative disorders. Front Cell Neurosci 8:313.
Cardoso FL, Herz J, Fernandes A, Rocha J, Sepodes B, Brito MA, McGavern DB,Brites D (2015) Systemic inflammation in early neonatal mice induces transient and lasting neurodegenerative effects. J Neuroinflammation 12:82.
Carloni S, Girelli S, Scopa C, Buonocore G, Longini M, Balduini W (2010) Activation of autophagy and Akt/CREB signaling play an equivalent role in the neuroprotective effect of rapamycin in neonatal hypoxia-ischemia. Autophagy 6:366-377.
Crowell KT, Soybel DI, Lang CH (2017) Restorative mechanisms regulating protein balance in skeletal muscle during recovery from sepsis. Shock 47:463-473.
Dong H, Cao H, Zheng H (2017) Pathogenic bacteria distributions and drug resistance analysis in 96 cases of neonatal sepsis. BMC Pediatr 17:44.
Ebrahimi-Fakhari D, Saffari A, Wahlster L, Di Nardo A, Turner D, Lewis TL Jr,Conrad C, Rothberg JM, Lipton JO, Kolker S, Hoffmann GF, Han MJ, Polleux F,Sahin M (2016) Impaired mitochondrial dynamics and mitophagy in neuronal models of tuberous sclerosis complex. Cell Rep 17:1053-1070.
Flood DG, Coleman PD (1988) Neuron numbers and sizes in aging brain: comparisons of human, monkey, and rodent data. Neurobiol Aging 9:453-463.
Götz T, Baumbach P, Reuken P, Huonker R, Kranczioch C, Debener S, Brunkhorst FM, Witte OW, Klingner C, Günther A (2016) The loss of neural synchrony in the post septic brain. Clin Neurophysiol 127:2200-2207.
Grif fin RJ, Moloney A, Kelliher M, Johnston JA, Ravid R, Dockery P, O’Connor R, O’Neill C (2005) Activation of Akt/PKB, increased phosphorylation of Akt substrates and loss and altered distribution of Akt and PTEN are features of Alzheimer’s disease pathology. J Neurochem 93:105-117.
Havekes R, Abel T (2017) The tired hippocampus: the molecular impact of sleep deprivation on hippocampal function. Curr Opin Neurobiol 44:13-19.
Hoeffer CA, Klann E (2010) mTOR signaling: at the crossroads of plasticity, memory and disease. Trends Neurosci 33:67-75.
Hopkins RO (2013) The brain after critical illness: effect of illness and aging on cognitive function. Crit Care 17:116.
Howell KR, Floyd K, Law AJ (2017) PKBgamma/AKT3 loss-of-function causes learning and memory deficits and deregulation of AKT/mTORC2 signaling:Relevance for schizophrenia. PLoS One 12:e0175993.
Hubbard WJ, Choudhry M, Schwacha MG, Kerby JD, Rue LW, 3rd, Bland KI,Chaudry IH (2005) Cecal ligation and puncture. Shock 24 Suppl 1:52-57.
Iacono D, Markesbery WR, Gross M, Pletnikova O, Rudow G, Zandi P, Troncoso JC (2009) The Nun study: clinically silent AD, neuronal hypertrophy, and linguistic skills in early life. Neurology 73:665-673.
Inoki K, Li Y, Zhu T, Wu J, Guan KL (2002) TSC2 is phosphorylated and inhibited by Akt and suppresses mTOR signalling. Nat Cell Biol 4:648-657.
Iwashyna TJ, Ely EW, Smith DM, Langa KM (2010) Long-term cognitive impairment and functional disability among survivors of severe sepsis. JAMA 304:1787-1794.
Jhanwar-Uniyal M, Gillick JL, Neil J, Tobias M, Thwing ZE, Murali R (2015)Distinct signaling mechanisms of mTORC1 and mTORC2 in glioblastoma multiforme: a tale of two complexes. Adv Biol Regul 57:64-74.
Jhanwar-Uniyal M, Amin AG, Cooper JB, Das K, Schmidt MH, Murali R (2017)Discrete signaling mechanisms of mTORC1 and mTORC2: Connected yet apart in cellular and molecular aspects. Adv Biol Regul 64:39-48.
Kruse JM, Jenning T, Rademacher S, Arnold R, Schmitt CA, Jorres A, Enghard P,Oppert M (2016) Neutropenic sepsis in the ICU: outcome predictors in a two phase model and microbiology findings. Crit Care Res Pract 2016:8137850.
Laplante M, Sabatini DM (2009) mTOR signaling at a glance. J Cell Sci 122:3589-3594.
Laplante M, Sabatini DM (2012) mTOR signaling in growth control and disease.Cell 149:274-293.
Li DF, Miao LJ, Li N, Liang H, Ren DQ, Guo J (2017) Salvianolic acid B effects on the proliferation, differentiation and apoptosis of hippocampal neural stem cells in rats following oxygen-glucose deprivation. Zhongguo Zuzhi Gongcheng Yanjiu 21:2735-2740.
Li G, Cheng H, Zhang X, Shang X, Xie H, Zhang X, Yu J, Han J (2013) Hippocampal neuron loss is correlated with cognitive deficits in SAMP8 mice. Neurol Sci 34:963-969.
Lieberwirth C, Pan Y, Liu Y, Zhang Z, Wang Z (2016) Hippocampal adult neurogenesis: Its regulation and potential role in spatial learning and memory. Brain Res 1644:127-140.
Lim C, Alexander MP, LaFleche G, Schnyer DM, Verfaellie M (2004) The neurological and cognitive sequelae of cardiac arrest. Neurology 63:1774-1778.
Lim JH, Stafford BK, Nguyen PL, Lien BV, Wang C, Zukor K, He Z, Huberman AD (2016) Neural activity promotes long-distance, target-specific regeneration of adult retinal axons. Nat Neurosci 19:1073-1084.
Liu S, Dai ZX, Wu CF, Hu J, Cui B (2016) Subcutaneous injection of basic fibroblast growth factorspromotesthe proliferation of hippocampal neural stem cells in rats with vascular dementia. Zhongguo Zuzhi Gongcheng Yanjiu 20:3470-3475.
Liu W, Guo J, Mu J, Tian L, Zhou D (2016) Rapamycin Protects sepsis-induced cognitive impairment in mouse hippocampus by enhancing autophagy. Cell Mol Neurobiol doi: 10.1007/s10571-016-0449-x.
Marik PE (2011) Surviving sepsis: going beyond the guidelines. Ann Intensive Care 1:17.
Mathews SB, Arnold SE, Epperson CN (2014) Hospitalization and cognitive decline: Can the nature of the relationship be deciphered? Am J Geriatr Psychiatry 22:465-480.
Miao L, Yang L, Huang H, Liang F, Ling C, Hu Y (2016) mTORC1 is necessary but mTORC2 and GSK3beta are inhibitory for AKT3-induced axon regeneration in the central nervous system. Elife 5:e14908.
Murawski NJ, Klintsova AY, Stanton ME (2012) Neonatal alcohol exposure and the hippocampus in developing male rats: effects on behaviorally induced CA1 c-Fos expression, CA1 pyramidal cell number, and contextual fear conditioning. Neuroscience 206:89-99.
Nouel D, Burt M, Zhang Y, Harvey L, Boksa P (2012) Prenatal exposure to bacterial endotoxin reduces the number of GAD67- and reelin-immunoreactive neurons in the hippocampus of rat offspring. Eur Neuropsychopharmacol 22:300-307.
Pandharipande PP, Girard TD, Jackson JC, Morandi A, Thompson JL, Pun BT,Brummel NE, Hughes CG, Vasilevskis EE, Shintani AK, Moons KG, Geevarghese SK, Canonico A, Hopkins RO, Bernard GR, Dittus RS, Ely EW, BRAINICU Study Investigators (2013) Long-term cognitive impairment after critical illness. N Engl J Med 369:1306-1316.
Park KK, Liu K, Hu Y, Kanter JL, He Z (2010) PTEN/mTOR and axon regeneration. Exp Neurol 223:45-50.
Park KK, Liu K, Hu Y, Smith PD, Wang C, Cai B, Xu B, Connolly L, Kramvis I, Sahin M, He Z (2008) Promoting axon regeneration in the adult CNS by modulation of the PTEN/mTOR pathway. Science 322:963-966.
Paul CA, Beltz B, Berger-Sweeney J (2008) The nissl stain: a stain for cell bodies in brain sections. CSH protocols 2008:pdb.prot4805.
Paxinos G, Franklin KB (2013) The Mouse Brain in Stereotaxic Coordinates. San Diego: Elsevier.
Rickle A, Bogdanovic N, Volkman I, Winblad B, Ravid R, Cowburn RF (2004)Akt activity in Alzheimer’s disease and other neurodegenerative disorders.Neuroreport 15:955-959.
Sancak Y, Bar-Peled L, Zoncu R, Markhard AL, Nada S, Sabatini DM (2010)Ragulator-Rag complex targets mTORC1 to the lysosomal surface and is necessary for its activation by amino acids. Cell 141:290-303.
Schmelzle T, Hall MN (2000) TOR, a central controller of cell growth. Cell 103:253-262.
Semmler A, Widmann CN, Okulla T, Urbach H, Kaiser M, Widman G, Mormann F, Weide J, Fliessbach K, HoeftA, Jessen F, Putensen C, Heneka MT(2013) Persistent cognitive impairment, hippocampal atrophy and EEG changes in sepsis survivors. J Neurol Neurosurg Psychiatry 84:62-69.
Shankar-Hari M, Rubenfeld GD (2016) Understanding long-term outcomes following sepsis: implications and challenges. Curr Infect Dis Rep 18:37.
Sharshar T, Bozza F, Chrétien F (2014) Neuropathological processes in sepsis.Lancet Neurol 13:534-536.
Steiner JL, Lang CH (2015) Sepsis attenuates the anabolic response to skeletal muscle contraction. Shock 43:344-351.
Streck EL, Comim CM, Barichello T, Quevedo J (2008) The septic brain. Neurochem Res 33:2171-2177.
Temiz-Resitoglu M, Kucukkavruk SP, Guden DS, Cecen P, Sari AN, Tunctan B,Gorur A, Tamer-Gumus L, Buharalioglu CK, Malik KU, Sahan-Firat S (2017)Activation of mTOR/IkappaB-alpha/NF-kappaB pathway contributes to LPS-induced hypotension and inflammation in rats. Eur J Pharmacol 802:7-19.
Thomanetz V, Angliker N, Cloetta D, Lustenberger RM, Schweighauser M, Oliveri F, Suzuki N, Ruegg MA (2013) Ablation of the mTORC2 component rictor in brain or Purkinje cells affects size and neuron morphology. J Cell Biol 201:293-308.
von Gunten A, Kövari E, Bussière T, Rivara CB, Gold G, Bouras C, Hof PR, Giannakopoulos P (2006) Cognitive impact of neuronal pathology in the entorhinal cortex and CA1 field in Alzheimer’s disease. Neurobiol Aging 27:270-277.
Vorhees CV, Williams MT (2006) Morris water maze: procedures for assessing spatial and related forms of learning and memory. Nat Protoc 1:848-858.
Wang GB, Ni YL, Zhou XP, Zhang WF (2014) The AKT/mTOR pathway mediates neuronal protective effects of erythropoietin in sepsis. Mol Cell Biochem 385:125-132.
Wang J, Jahn-Eimermacher A, Bruckner M, Werner C, Engelhard K, Thal SC(2015) Comparison of different quantification methods to determine hippocampal damage after cerebral ischemia. J Neurosci Methods 240:67-76.
Widmann CN, Heneka MT (2014) Long-term cerebral consequences of sepsis.Lancet Neurol 13:630-636.
Yang L, Miao L, Liang F, Huang H, Teng X, Li S, Nuriddinov J, Selzer ME, Hu Y (2014) The mTORC1 effectors S6K1 and 4E-BP play different roles in CNS axon regeneration. Nat Commun 5:5416.
Zeng M, Zhou JN (2008) Roles of autophagy and mTOR signaling in neuronal differentiation of mouse neuroblastoma cells. Cell Signal 20:659-665.
Copyedited by Knight B, Maxwell R, Yu J, Li CH, Qiu Y, Song LP, Zhao M
杂志排行
中国神经再生研究(英文版)的其它文章
- Saponins from Panax japonicus attenuate age-related neuroinflammation via regulation of the mitogenactivated protein kinase and nuclear factor kappa B signaling pathways
- Delayed degeneration of an injured spinothalamic tract in a patient with diffuse axonal injury
- Research on human glioma stem cells in China
- Evaluation of sensory function and recovery after replantation of fingertips at Zone I in children
- Effects of neuregulin-1 on autonomic nervous system remodeling post-myocardial infarction in a rat model
- Globose basal cells for spinal cord regeneration