Locomotor analysis identifies early compensatory changes during disease progression and subgroup classification in a mouse model of amyotrophic lateral sclerosis
2017-11-08MelissaJaulcombRenaMeadowswhitneyMillerKathrynMcMillanMeKenzieJilsmeyerXuefuwangwesleyBeaulieuStephanieDickinsonToddBrownVirginiaSandersKathrynJones
Melissa M. Jaulcomb, Rena M. Meadows, whitney M. Miller Kathryn P. McMillan MeKenzie J. Jilsmeyer Xuefu wang,wesley T. Beaulieu, Stephanie L. Dickinson,, Todd J. Brown Virginia M. Sanders, Kathryn J. Jones
1 Department of Anatomy and Cell Biology, Indiana University School of Medicine, Indianapolis, IN, USA
2 Research and Development Service, Roudebush Veterans Administration Medical Center, Indianapolis, IN, USA
3 Program in Medical Neurosciences, Indiana University School of Medicine, Indianapolis, IN, USA
4 Department of Statistics, Indiana University, Bloomington, IN, USA
5 Department of Epidemiology and Biostatistics, Indiana University, Bloomington, IN, USA
6 Department of Cancer Biology and Genetics, The Ohio State University Wexner Medical Center, Columbus, OH, USA
How to cite this article: Haulcomb MM, Meadows RM, Miller WM, McMillan KP, Hilsmeyer MJ, Wang X, Beaulieu WT, Dickinson SL,Brown TJ, Sanders VM, Jones KJ (2017) Locomotor analysis identifies early compensatory changes during disease progression and subgroup classification in a mouse model of amyotrophic lateral sclerosis. Neural Regen Res 12(10):1664-1679.
Locomotor analysis identifies early compensatory changes during disease progression and subgroup classification in a mouse model of amyotrophic lateral sclerosis
Melissa M. Jaulcomb1,2,*, Rena M. Meadows1,2,3, whitney M. Miller1,2, Kathryn P. McMillan1,2, MeKenzie J. Jilsmeyer1, Xuefu wang4,wesley T. Beaulieu4, Stephanie L. Dickinson4,5, Todd J. Brown1,2, Virginia M. Sanders6, Kathryn J. Jones1,2
1 Department of Anatomy and Cell Biology, Indiana University School of Medicine, Indianapolis, IN, USA
2 Research and Development Service, Roudebush Veterans Administration Medical Center, Indianapolis, IN, USA
3 Program in Medical Neurosciences, Indiana University School of Medicine, Indianapolis, IN, USA
4 Department of Statistics, Indiana University, Bloomington, IN, USA
5 Department of Epidemiology and Biostatistics, Indiana University, Bloomington, IN, USA
6 Department of Cancer Biology and Genetics, The Ohio State University Wexner Medical Center, Columbus, OH, USA
How to cite this article: Haulcomb MM, Meadows RM, Miller WM, McMillan KP, Hilsmeyer MJ, Wang X, Beaulieu WT, Dickinson SL,Brown TJ, Sanders VM, Jones KJ (2017) Locomotor analysis identifies early compensatory changes during disease progression and subgroup classification in a mouse model of amyotrophic lateral sclerosis. Neural Regen Res 12(10):1664-1679.
Amyotrophic lateral sclerosis is a motoneuron degenerative disease that is challenging to diagnose and presents with considerable variability in survival. Early identification and enhanced understanding of symptomatic patterns could aid in diagnosis and provide an avenue for monitoring disease progression. Use of the mSOD1G93Amouse model provides control of the confounding environmental factors and genetic heterogeneity seen in amyotrophic lateral sclerosis patients, while investigating underlying disease-induced changes.In the present study, we performed a longitudinal behavioral assessment paradigm and identified an early hindlimb symptom, resembling the common gait abnormality foot drop, along with an accompanying forelimb compensatory mechanism in the mSOD1G93Amouse. Following these initial changes, mSOD1 mice displayed a temporary hindlimb compensatory mechanism resembling an exaggerated steppage gait. As the disease progressed, these compensatory mechanisms were not sufficient to sustain fundamental locomotor parameters and more severe deficits appeared. We next applied these initial findings to investigate the inherent variability in B6SJL mSOD1G93Asurvival. We identified four behavioral variables that, when combined in a cluster analysis, identified two subpopulations with different disease progression rates: a fast progression group and a slow progression group.is behavioral assessment paradigm, with its analytical approaches,provides a method for monitoring disease progression and detecting mSOD1 subgroups with different disease severities.is affords researchers an opportunity to search for genetic modifiers or other factors that likely enhance or slow disease progression. Such factors are possible therapeutic targets with the potential to slow disease progression and provide insight into the underlying pathology and disease mechanisms.
nerve regeneration; amyotrophic lateral sclerosis; motoneuron degenerative disease; locomotor;disease progression; disease variability; SOD1 mouse; neural regeneration
Introduction
Amyotrophic lateral sclerosis (ALS) is the most common adult motoneuron (MN) degenerative disease. This rapidly progressing disease affects voluntary muscle movement and ultimately leads to respiratory failure and other pulmonary complications (Brooks, 2000; Wijesekera and Leigh, 2009;Naganska and Matyja, 2011). Initial symptoms, such as weakness, muscle atrophy, fasciculations, and hyperreflexia appear gradually and oen go unnoticed for a period of time (Swinnen and Robberecht, 2014). The wide variety of individual clinical features compromises the certainty of diagnosis and, to date, there are no well-established biological diagnostic markers (Chaudhuri et al., 1995). Thus, the diagnosis of ALS requires clinical evidence of both upper and lower MN signs with a progressive spread of symptoms as well as an absence of evidence for other non-ALS conditions,injuries, or diseases (Brooks et al., 2000). Therefore, at the time of diagnosis, the disease is oen entering final stages,and severe MN degeneration has already occurred.
Earlier identification of symptoms and a greater understanding of symptomatic patterns will not only effectuate the diagnosis of ALS, but also provide an avenue for monitoring disease progression rates, which is critical. While mean survival is approximately three years from diagnosis, there is considerable variability in the lifespan of patients (Swinnen and Robberecht, 2014). Subgroups of patients exist which present with very rapid or slow disease progression rates,with accompanying life expectancies ranging from only 1.5 years to more than 18 years (Ratovitski et al., 1999; Grohme et al., 2001; Czaplinski et al., 2006). In addition to being a challenge for patients and clinicians, this incredible variabili-ty has been identified as a factor that complicates clinical trials (de Carvalho and Swash, 2006; Swinnen and Robberecht,2014; Wolf et al., 2014). Genetic studies have determined that a small portion (10%) of ALS cases are inherited (familial ALS [fALS]); whereas the majority (90%) are sporadic(sALS). While some patients with inherited ALS-causing mutations do display some uniformity in their progression rates, a majority of patients, even those possessing the same mutation, display progression rates that are exceedingly variable (Abe et al., 1996; Maeda et al., 1997; Broom et al., 2006;Piaceri et al., 2012).
The variability in disease progression rates displayed by ALS patients carrying the same gene mutation suggests that there is no straightforward relationship between genetic cause and phenotype. It is likely that environmental and/or genetic factors modify the age of onset and disease progression. Identification of these modifiers could lead to therapeutic targets with the potential to delay onset or attenuate disease progression rates (Swinnen and Robberecht, 2014).In an effort to control for or reduce genetic heterogeneity and environmental factors, researchers are studying single families with the same, inherited ALS-causing mutation, but high intrafamilial phenotypic variability (Regal et al., 2006;Kim et al., 2007; Lopate et al., 2010; Penco et al., 2011).
Studying disease phenotypes in patients is confounded by numerous environmental factors, genetic heterogeneity,small sample sizes, and limitations of in vivo cellular or tissue analysis that can be performed throughout the disease course. Fortunately, ALS mouse models expressing fALS mutations, such as the superoxide dismutase-1, glycine 93 to alanine mutation (mSOD1G93A), emulates the pathological disease progression seen in patients (Gurney et al., 1994; Chiu et al., 1995; Saeed et al., 2009). mSOD1G93Amice, referred to as mSOD1 mice throughout this manuscript, appear to develop normally into adulthood but, around 100 days of age,display gross motor impairments and reveal significant MN loss in the lumbar spinal cord and brainstem nuclei (Chiu et al., 1995).
Research has determined that the background strain of the ALS mouse model can impact disease progression (Heiman-Patterson et al., 2005). In an effort to study the variability in disease progression and search for disease modifiers in mice, scientists have been analyzing the genomes of mSOD1 mice on different background strains with differences in lifespan (Nardo et al., 2013). Our laboratory has been utilizing mSOD1 mice on the B6SJL hybrid background because these mice display relatively high variability with respect to symptom onset and survival compared to other background strains (Hamson et al., 2002; Heiman-Patterson et al., 2005,2011; Knippenberg et al., 2010). Therefore, studying the B6SJL mSOD1 model offers the desired, inherent variability in survival while greatly reducing confounding genetic heterogeneity. However, the challenges of utilizing this model for studying differences in the severity of disease progression mirror those challenges experienced by those studying ALS patients. Unless the study is restricted to post-mortem analysis, it requires accurate identification of the severity of disease progression rate in vivo and prediction of survival,particularly for testing the effects of therapeutics on specific subgroups or analyzing gene expression difference throughout disease progression.
Using the B6SJL mSOD1 mouse, our laboratory has previously identified two subpopulations with different disease progression rates, a fast progression group (FPG) and a slow progression group (SPG; Haulcomb et al., 2015). Specifically,we utilized six behavioral tests in combination to generate a motor score, which was used to calculate the rate of mSOD1 motor function decline from 98 to 112 days of age. Using the rate of motor score decline, we performed a two-step cluster analysis and identified the presence of two mSOD1 subgroups. At 112 days of age, increased disease-induced molecular expression within the facial motor nucleus of the FPG, confirmed the presence of a more severe disease phenotype in comparison with that of the SPG.
In the present study, we employed an external, longitudinal behavioral assessment paradigm in order to accomplish two major aims.e first aim was to investigate and assess the evolution of biomechanical and locomotor changes that occur throughout disease progression. A greater understanding of the symptomatic patterns will be important for not only researchers utilizing rodent models, but also for future development of patient-focused programs for early identification and diagnosis of ALS, as well as for monitoring disease progression rate. Interestingly, our findings revealed that early disease-induced effects lead to alterations in the most basic biomechanical components, which represent compensatory mechanisms, rather than direct measures of motor deficits. Much later changes represent the classic symptoms of motor deficits commonly associated with MN degenerative diseases. A more thorough understanding of how the degree of motor weakness is reflected by changes in biomechanics and locomotor parameters will allow for ongoing assessment of disease progression rate and potentially,early prediction of overall disease severity.
Our second major aim was to utilize the wealth of behavioral data generated to identify and validate a more inclusive cluster method, comprising a combination of individual trajectory-based locomotor data sets, to assign mSOD1 mice to their respective subgroups. After analyzing hundreds of locomotor variable combinations, we successfully identified four variables for use in our trajectory-based cluster method;maximum speed, body weight, motor score, and print positions right. Following group assignments, we confirmed that the more severe disease phenotype, displayed by the FPG,correlated with a significant decrease in survival, compared to the SPG. We also identified a key set of additional locomotor variables that proved useful for monitoring disease progression rates among these subgroups. Surprisingly, the variables that identified the early disease-induced compensatory changes in mSOD1 mice, compared to WT, were distinguished from the variables used to identify the mSOD1 subgroups, as well as those variables that most accurately monitor differences in FPG and SPG disease progression.The ability to identify mSOD1 subgroups with the same background strain, but different inherent disease progression rates, which correlate with survival, presents a unique opportunity to search for genetic modifiers that could lead to potential therapeutic targets capable of attenuating disease progression rates or furthering our understanding of disease mechanisms. In addition, identification and monitoring of gait abnormalities in ALS patients, which are able to predict disease progression rates and disease severity, could have a powerful impact on patient care and may lead to more effective patient-focused treatment programs.
Materials and Methods
Animals
For all experiments, female B6SJL wild-type (WT; No.100012; n = 16) and B6SJL transgenic mSOD1G93Ahigh copy number (B6SJL-Tg[SOD1-G93A]1Gur; No. 002726; n =24) mice were purchased frome Jackson Laboratory (Bar Harbor, ME, USA). All 40 mice had the same date of birth and were included in this study at five weeks of age (approximately 16 g in body weight). Large groups of mice were used for the behavioral assessments, as suggested by the guidelines for preclinical animal research in ALS (Ludolph et al.,2007, 2010). All animal procedures were performed in accordance with institutional and National Institutes of Health guidelines for the Care and Use of Laboratory Animals for research purposes and were approved by the Institutional Animal Care and Use Committee (approval protocol 11227).Mice were housed under a 12-hour light/dark cycle in autoclaved microisolator cages, and autoclaved pellets and drinking water were provided ad libitum.e housing facility was equipped with a laminar flow system to maintain a pathogen-free environment. Mice were permitted to acclimate to their environment for three days prior to any procedures or testing. Female mice were used for all experiments to maintain consistency with previous studies and because of their reduced aggressive behavior, relative to males, during group housing (Batka et al., 2014; Haulcomb et al., 2014, 2015).
All animal handling and behavioral testing was performed by the same three female researches at the same time on each testing day, approximately four hours into the light cycle.e order in which the mice were tested was rotated every testing day, and the mouse strain and identification information was coded by an uninvolved investigator prior to the onset of testing. Body weight (g) was assessed daily for each subject, from 50 days of age until euthanasia. Mice were provided with an initial six day training period where they were exposed to, and trained to perform, the various behavioral tests. Following the training period, mice were tested daily from 50 days of age until they were physically unable to complete the specific behavioral test (retirement date).e retirement date for an individual mSOD1 with respect to the specific test was solely dependent on the subject’s physical inability to successfully complete the behavioral task. In order to balance the weight of the groups, sets of WT mice(randomly selected, individual WT mice) were retired from certain tests aer a comparable percentage of mSOD1 mice had reached retirement. Similarly, groups of WT mice were euthanized after a comparable percentage of mSOD1 mice reached end-stage criteria and were euthanized.
mSOD1 mice were monitored daily for moribund criteria(end-stage disease), which consisted of an inability to right themselves within 30 seconds aer being placed on their side(Yang et al., 2011). Aer these criteria were met, mice were euthanized by CO2asphyxiation. Tissue samples were collected, flash frozen, and stored at –80°C for analysis in future studies.e first mSOD1 mouse reached end-stage and was euthanized at 120 days of age and the last mSOD1 mouse survived until 164 days of age.
Behavioral assessment: Open Field Activity
Open field activity was assessed, for individual mice, as a general measure of locomotor function and voluntary activity. For two minutes, mice were permitted to move freely within a clean, transparent acrylic box (46 × 33 × 19 cm3).The test was video recorded from above and mice were tracked using ANY-maze Video Tracking Software version 4.73 (Stoelting Co., Wood Dale, IL, USA). Eight variables were measured: mean speed (cm/s), distance traveled (cm),maximum (max) speed (cm/s), number of mobile episodes,time inactive (s), time immobile (s), time mobile (s), and time active (s). Mice were tested every other day starting at 50 days of age. Retirement dates for mSOD1 mice began as early as 118 days of age and ended when the last set of mice were retired at 164 days of age.
Mice were observed for motor impairments and manually scored using a combination of six scored assessments yielding a motor score, as previously described (Haulcomb et al.,2015). This particular variable measures a combination of motor deficits in terms of muscle strength, balance, coordination, dysmetria, body posture, smoothness of movements and the ability to support body weight. For an in-depth description see Haulcomb et al. (2014) and Haulcomb et al.(2015). In the present study, motor score assessment was performed every other day and video recorded, beginning on day 50 and continuing until retirement. Retirement dates for mSOD1 mice began as early as 118 days of age and ended when the last set of mice were retired at 164 days of age.
Behavioral assessment: Grip Strength Test
As an additional measure of neuromuscular impairment,mice were assessed weekly using the Grip Strength Test (BIOSEB, Vitrolles, France). The Grip Strength Test measures the maximal peak force (g) of the rodent’s grip at a sampling resolution of 1,000 Hz. Two separate attachments were used on alternative testing days to assess the force exerted by a different combination of paws.e bar accessory is a stainless steel attachment comprising an 80 mm bar, allowing the mouse to grip with both front paws. The animal handler,holding the mouse by the tail, allows the mouse to grip the bar with both front paws, then pulls the mouse away from the apparatus until the mouse releases. The maximal peak force of the combined front paws is generated.e second accessory, the grid attachment, is a stainless steel grid (200× 80 mm2; angled 20°) that provides a combined measure of maximal peak force generated from all four paws as the handler pulls the mouse away from the apparatus. Individual mice generated two, repeated Grip Strength measures each testing day which were averaged.
Initially, mice were tested daily using the grid attachment on even days and the bar attachment on odd days. However,after 10 days of testing, it was clear that the Grip Strength measurements from all 40 mice, including WT, were on a consistent and steady decline. We determined that although the mice were placing their paws on the attachments, they were not actually gripping. We concluded that daily testing for the Grip Strength test was too frequent and we changed the testing interval for both the bar and the grid to weekly,as opposed to daily. Weekly testing for the Grip Strengthbar commenced at 67 days of age, while the Grip Strengthgrid testing began at 68 days of age.e first mSOD1 mouse was retired from the Grip Strength-bar testing at 116 days of age and the last group of mice were tested at 158 days of age.e first mSOD1 mouse was retired from the Grip Strengthgrid testing at 117 days of age and the last group of mice were tested at 152 days of age. Only 23 mSOD1 mice were included in the Grip Strength analyses because one mouse developed a tail wound and could no longer perform these tests.
Behavioral assessment: gait analysis
Gait analysis was performed using the CatWalk Automated Gait Analysis System (Noldus Information Technology, Leesburg, VA, USA; soware version XT 9.1). Mice were tested once every other day, using the same procedures and criteria as previously described (Batka et al., 2014). Testing began at 51 days of age and continued until individual mSOD1 mice were unable to generate compliant runs and were subsequently retired.e first mSOD1 mouse was retired from CatWalk as early as 109 days of age and the last set of mice were tested at 153 days of age. Aer testing at 75 days of age,we experienced a failure of one of the light components on the apparatus, which was replaced within five days, however,there was no data regarding CatWalk collection performed on the two testing days corresponding to 77 and 79 days of age.
Catwalk data collection and variable exclusion
For every compliant run acquired for an individual mouse,CatWalk generates data for 185 separate variables. We required a minimum of three compliant runs per mouse per day and accepted a maximum of 10 runs per mouse per day. Compliant run criteria were set at a minimum of 12 consecutive steps and 40% maximum speed variation per run. All individual runs were coded and assessed by a blind analyst to verify that all paws were correctly identified by the soware; lefront (LF),right front (RF), lehind (LH), and right hind (RH).
Although CatWalk generates 185 separate variables, we limited the number of extraneous and redundant variables used in further statistical analysis. Since the CatWalk data would later be normalized to the speed of the animal, we excluded the average speed variable and eight individual body speed-to-paw variables. Maximum variation and average run duration variables were also not assessed. In addition, we also excluded 11 variables requiring additional manual classification; sciatic functional index (FI), peroneal FI, posterior tibial FI, toe spread, paw angle body axis, and various individual paw angle movement vectors. Coupling patters and phase dispersions measure the timing of placement between two paws and comprise a total of 56 variables. Because these measures are somewhat redundant, we eliminated the 18 phase dispersions and 25 of the coupling pattern variables.While each coupling pattern yields a separate variable for the normal mean, CStat (circular statistic) mean and CStat R(variation; Batka et al., 2014), only the coupling pattern variables reflecting the normal mean were included for analysis,resulting in 11 distinct variables representing the different anchor paw ☒ target paw sequences. Among the remaining 120 variables, 22 variables are specific paw/limb variables,yielding a total of 88 individual variables for each of the four paws/limbs (LF, RF, LH, and RH). Since no lateral differences were identified between contralateral paws or limbs,variables for the right and lepaws/limbs were averaged together, resulting in 22 front paw/limb variables and 22 hind paw/limb variables. Thus, a total of 109 CatWalk variables were excluded, leaving 76 variables for future analysis.
Normalization for speed and weight
We have previously shown that a large majority of CatWalk reported variables are significantly related to speed (Batka et al., 2014).e speed-dependency relationship is not uniform and is often unique to each variable with respect to magnitude, direction, mathematical function, and graphical appearance.us, we developed a statistical method that allowed for these variables to be analyzed in the context of speed by first linearizing the individual speed-variable relationships and then used a linear mixed model (LMM) with speed included as a covariate (Batka et al., 2014). Within a study by Batka et al. (2014), we demonstrated the necessity of including speed as a covariate by comparing front swing speed of the fastest-running mice vs. the slowest-running mice. Without normalizing the data for variations in the animal’s speed, we detected a significant difference between the groups. However, aer including speed as a covariate, no differences were identified between front swing speed of the fast-running group compared to that of the slower group. While this method provided a notable approach to locomotion analysis, it was time-demanding and required multiple data processing steps.In the present study, we have identified a more automated method, using regression analysis that allows for the inclusion of covariates. For the CatWalk variables, we not only included speed as a covariate, but also elected to include body weight because 1) numerous CatWalk variables are influenced by the amount of pressure applied to the paws and 2) it is well-established that while young adult WT mice will be increasing in body weight longitudinally, mSOD1 mice will experience a significant decrease (Azzouz et al., 1997). The regression analysis was performed on individual CatWalk variables using a set of independent variables: body weight, speed, speed2,speed3, and the common logarithm of speed.ese variables were used to identify the best fitting curve-linear relationship between speed and weight on each CatWalk variable.The difference between the new predicted value from the regression line and the actual data point yielded a residual for every CatWalk run. A positive or negative residual indicates whether the observed value was above or below the expected value based on the animal’s speed. Adjusted values were then created by adding the residual to the overall mean for each variable, which converts the residual back to the scale of the original data (SAS/STAT, Cary, NC, USA; software version 9.4). The result is speed and weight neutralized data which provides assurance that decreases in speed and body weight of mSOD1 mice with time are not revealed as biomechanical changes (Batka et al., 2014). Also, importantly, the speed and weight neutralized data preserves the number of data points per mouse while retaining the original scale. The maximal peak force measurements obtained from Grip Strength can also be influenced by significant differences in body weight,thus, Grip Strength data was normalized for body weight in the same manner as the CatWalk data. The remaining variables, body weight, motor score, and the eight ANY-maze variables, were not normalized for speed or weight.
Additional Catwalk data processing
Subsequent to the normalization, the multiple CatWalk data points which were generated per mouse, per day, per variable, as a result of multiple runs, were averaged together to yield one data point, per variable, per mouse, per testing day.
Generating individual variable trajectories
For all 88 variables (76 CatWalk, eight ANY-maze, two Grip Strength, one motor score, and one body weight), plots of individual trajectories were created for each animal across all testing days (SAS/GRAPH Cary, NC, US; soware, version 9.4).
Baseline adjustment
We limited the scope of our analysis to deviations of the mSOD1 group, with respect to WT, to aer behavioral testing had begun. Therefore, all variables underwent baseline adjustment, using the first three consecutive days of testing for CatWalk (51, 53, and 55 days of age), ANY-maze, and motor score (50, 52, and 55 days), the first five consecutive days of testing for body weight (50–55 days), and the first testing day/week for the two Grip Strength measures (67 and 68 days). Any differences in the WT vs. mSOD1 baselines were split and the values were uniformly subtracted from the mice in each group across all data points for that particular variable.us, for every variable, the WT and mSOD1 groups began at the same baseline and therefore, we could effectively limit our assessment to any changes or deviations in the trajectories of the mSOD1 group thereaer.
Further restrictions on variable inclusion
During data processing, it was determined that some variables were not used by mice or the measurements obtained were negligible. For these reasons the following 11 variables were excluded from further analysis: support four, normal step sequence patterns (NSSP) Ra and Rb (rotary step patterns), girdle support, lateral support, front and hind terminal dual stance, front and hind stand index, as well as front and hind initial dual stance. In addition, we excluded several variables that appeared redundant and are as follows: Print positions left was excluded in lieu of print positions right,number of steps was excluded in lieu of cadence (steps/s),and mean speed was eliminated in lieu of max speed. Many paw intensity and paw contact variables are generated for an individual run. We restricted number of paw print variables to include front and hind paw print length (cm), width (cm),and area (cm2); front and hind max contact at (%); front and hind max intensity at (%), for a total of 10 variables. We excluded variations of these measurements: front and hind max contact area, front and hind max contact max intensity, front and hind max contact mean intensity, front and hind min intensity, front and hind mean intensity, front and hind mean intensity 15, and front and hind max intensity (a total of 17 variables excluded). For variable descriptions see Batka et al.(2014) or Noldus (2011). Aer this additional limitation, 48 CatWalk or 60 total variables remained for further analysis.
Statistical analysis: wTvs.mSOD1 groups
WT and mSOD1 group comparisons were analyzed, for each variable, using a Repeated Measures (RM) LMM with post-hoc tests, for each testing day (SAS/STAT software,version 9.4). High variability in symptom progression among mSOD1 mice on the B6SJL hybrid background (Heiman-Patterson et al., 2005; Haulcomb et al., 2015) and the relatively high frequency of testing performed, required a defined criteria to confirm the presence of mSOD1 and WT differences. Statistically significant differences (p ≤ 0.05)between means of mSOD1 and WT groups over three consecutive testing days was considered the onset of changes for that particular variable. Identification of three consecutive testing days with non-significant differences was considered the end of group differences for that particular variable.is additional requirement for identifying the presence of group differences serves the purpose of substantiation and reduces the likelihood of false positives.
Based on the LRT criteria, and a lack of differences as determined by the LMM, the following variables revealed no notable differences between mSOD1 mice and WT across time: mobile episodes, time active, time immobile, time inactive, time mobile, support zero, support single, support three,hind base of support (BOS; cm), number of patterns, NSSP Ab (alternate step pattern), NSSP Ca and Cb (cruciate step patterns), girdle couplings RH☒LH, LH☒RH, LF☒RF, and diagonal coupling RF☒LH, front stand phase, front and hind paw print width, and max contact at hind (data not shown).Of importance is the finding that the five ANY maze variables (listed above), which analyze voluntary activity, did not reveal any measurable differences between WT and mSOD1 mice across the study. These variables were purposefully included and analyzed up to this point in order determine whether mSOD1 mice would reduce their activity level with disease progression and motor impairments. However, no differences were identified between WT and mSOD1 mice for activity-related variables: mobile episodes, time active, time immobile, time inactive, and time mobile (data not shown).us, based on our additional limitation criteria we excluded 21 variables from the WT vs. mSOD1 analysis, although several of these excluded variables are discussed within the results section in the context of other, related changes. The remaining more manageable set of variables were used for the WT vs. mSOD1 analysis, the mSOD1 cluster analysis,and the subsequent FPG vs. SPG analysis. These remaining 39 variables include: 33 CatWalk, two ANY-maze, two Grip Strength, motor score, and body weight.
Classification of variables
Many of the CatWalk variables measure biomechanical components, which make up the basic step cycle.e step cycle,depicted in Figure 1, is defined as the duration (s) between two consecutive contacts of the same paw (a front or hind paw) and can be broken down into a stand or stance phase and a swing phase. Stand phase is the duration of paw contact, while swing phase is the duration of the elevated and accelerating paw (Scholle et al., 2010). During the swing phase, swing speed (cm/s), or the velocity of the elevated paw, can be measured (swing speed = stride length/swing),while several paw print-related variables are analyzed during the stand phase. When a paw is in contact with the glass surface, paw print length (cm) and area (cm2) can be measured.In addition, max contact at (%) and max intensity at (%) are both assessed during stand and are based on the percentage of the stand phase where the paw is at maximum contact(max contact at) or maximum intensity (maximum intensity at). Max contact at is important for determining the percentage of the stand phase where the paw makes full contact.Max intensity at is an assessment of the pressure placed on the paw throughout the stand phase, providing a measure for changes in leg loading or weight bearing (Noldus, 2011).Slight changes in the duration of the stand and/or swing phases can be readily assessed by calculating duty cycle.Duty cycle is defined as the percentage of the step cycle devoted to the stand phase vs. the swing phase (duty cycle % =stand phase/step cycle).
We adopted a functional classification method in order to analyze and discuss the results of the different behavioral tests performed in the present study. Biomechanical component variables include both a front and hind of the following: swing speed, swing phase, stand phase, duty cycle, max intensity at, max contact at, paw print length, width, and area. Fundamental locomotor elements are variables that are essential for maintenance of normal gait patterns and basic locomotion. Fundamental locomotor elements include: cadence, print positions right, regularity index (%), inter-paw coupling patterns, and front and hind components of stride length (cm), step cycle, and single stance (s). Fundamental locomotor elements are dependent on and maintained by the combined actions of biomechanical components. Gross motor parameters are made up of variables that measure defined gait patterns, muscle strength and mass, as well as gross locomotion. Gross motor parameters include: NSSP, motor score, max speed, distance, body weight, Grip Strength, and BOS.
Identification of mSOD1 subgroups
Previously, we used cluster analysis on the rate of motor score decline (from 98 days of age, or symptom onset, to 112 days of age) in order to identify two mSOD1 subgroups with different symptom progression rates (Haulcomb et al., 2015).In the present study, we have expanded this method to use the entire mouse trajectory, as opposed to just slope, and, in addition, combined a set of variables in order to assign individual mSOD1 mice to the FPG or SPG.is approach provides an objective and more reliable method to identify and classify individual subjects into groups based on changes in functional disease markers.
An exhaustive number of different variable combinations were evaluated using the K-Means for Joint Longitudinal Data (KML3D; R Foundation, Vienna, Austria, R software version 3.2.2; Genolini et al., 2015). Variables were first selected as candidates based only on a showing of significant LRT differences in the GCA models. Groups of candidate variables (ranging from 16, down to just three) were entered into the KMLD3 function which generates a set of possible two cluster solutions. Cluster solutions were ranked by the Calinski and Harabasz criterion to indicate solution quality (Calinski and Harabasz, 1974). We rejected any cluster solution where one cluster comprised ≤ six mice (25% of the total mSOD1); so as not to inadvertently identify outliers as one of the mSOD1 subgroups.e variable selection process for use in the cluster analysis included several approaches.Variables were ranked in order of degree of general separation between WT and mSOD1 trajectories in GCA analyses,those with higher mSOD1 variability compared to WT,variables with very early mSOD1 changes, variables that are functionally related, and several combinations of the aforementioned.e FPG and SPG groups created in the cluster analyses were then analyzed using euthanasia date. Survival analysis was performed using the Logrank (Mantel-Cox) test(GraphPad Prism, La Jolla, CA, USA; soware version 6.07).
Statistical analysis: FPGvs.SPG
Once mSOD1 groups were assigned, the 60 variables from the behavioral analysis, minus the four variables used in the cluster analysis, were re-analyzed for differences between FPG and SPG. Trajectories were observed graphically as well as analyzed using the LMM to identify significant differences between FPG and SPG, as described above. Variables with the most significant differences and those which displayed a clear divergence between the group trajectories were selected.ese variables verified that the cluster analysis was successful in not only separating the mSOD1 subgroups based on survival, but also on the severity of disease progression,as measured by numerous biomechanical and locomotor variables. These selected variables were also identified as potentially useful for assessing disease progression rates of mSOD1 subgroups in future studies. Linear regression analysis was performed using individual mSOD1 data points and a 95% confidence interval (GraphPad Prism, version 6.07).
Msod1gene copy number analysis
Differences in Msod1 transgene copy number affect disease phenotypes and survival in mSOD1 mouse models (i.e.,high copy vs. low copy number mSOD1 mice; Dal Canto and Gurney, 1995). Although we have previously shown that slight variations in Msod1 copy number do not correlate with differences in disease progression rates (Haulcomb et al., 2015), in the present study we again performed Msod1 copy number analysis among mSOD1 mice. We obtained tail samples (0.5 cm) at 38 days of age, and a second tail sample(0.5 cm) from each individual mSOD1 mouse, immediately following euthanasia (for control purposes). All tail samples were analyzed to determine Msod1 copy numbers using the method previously described (Haulcomb et al., 2015). No differences in copy number were detected between the two tail samples for individual subjects, so the two values were averaged together to generate an Msod1 copy number for each mouse. To verify that slight differences in Msod1 copy numbers did not correlate with survival or end-stage, a linear regression analysis was performed with the Msod12–ΔCtvs. euthanasia date (GraphPad Prism version 6.07). Results revealed no correlation between Msod1 copy number and euthanasia date; Slope = –0.005 ± 0.016, R2= 0.004, p = 0.768(data not shown).
Results
Initial biomechanical changes included mSOD1 hindlimb foot drop and a forelimb compensatory mechanism at 61 days of age
Disease-induced changes were first detected 11 days into our comprehensive behavioral assessment. These initial changes included nine biomechanical components. Significant changes in a set of biomechanical components all at once are oen representative of a compensatory mechanism.Alterations in various biomechanical components can work together to compensate for biological changes while maintaining the fundamental locomotor elements and ultimately gross motor parameters.
An increase in hind paw print length during the stand phase (Figure 2A) in mSOD1 mice was identified as early as 61 days of age (WT, 0.685 ± 0.021; mSOD1, 0.740 ± 0.017;p = 0.038), in comparison to WT mice.ese changes persisted until late disease stage or 129 days of age (LRT diff =101.88; p < 0.001). Subsequently, hind paw print area was also increased in mSOD1 mice, compared to WT (LRT diff = 95.92; p < 0.001), starting at 69 days of age (data not shown).ese changes in the context of the additional forelimb biomechanical component alterations are likely to be an indicator of the classic gait abnormality, foot drop. Foot drop is an indication of muscle weakness or a loss of control necessary for plantarflexion during the heel strike and oen causes the foot to slap the floor (Djekidel and Harb, 2006).
Changes in seven additional biomechanical components accompanying the identification of the foot drop symptom were also identified at this time. In combination, this set of changes, described below, suggests a forward-shift in the mSOD1 center-of-gravity as a compensatory mechanism to counteract disease-induced weakness of the hindlimbs. At 61 days of age, the mSOD1 group experienced a significant decrease in front swing phase duration compared to WT(LRT diff = 113.37; p < 0.001;Figure 2B), which persisted until end-stage disease (WT, 0.088 ± 0.002; mSOD1, 0.080± 0.001; p < 0.001). This decrease in time spent in front swing phase duration was achieved by an increase in front swing speed (Figure 2C). At 61 days of age, mSOD1 mice displayed an increase in front swing speed (WT, 110.890 ±0.989; mSOD1, 115.910 ± 0.802; p < 0.001). Significant differences between WT and mSOD1 mice (LRT diff = 33.07;p < 0.001) persisted until 147 days of age. Interestingly, no differences in front stand phase were observed between WT and mSOD1 mice (data not shown; LRT diff = 113.65; p <0.001). Collectively, these findings are corroborated by the increase in mSOD1 front duty cycle, compared to WT (Figure 2D; LRT diff = 40.32; p < 0.001). An increase in front duty cycle verifies a shiwithin the forelimb step cycle such that SOD1 mice are increasing time spent in stand vs. swing phase. From 61 to 91 days of age, we identified a modest and consistent increase in mSOD1 front duty cycle (61 days of age: WT, 39.559 ± 0.591; mSOD1, 42.257 ± 0.479; p < 0.001).Again, at 101 days of age (WT, 39.332 ± 0.580; mSOD1,41.826 ± 0.479; p = 0.001) and thereaer, a marked separation between WT and mSOD1 trajectories existed, which persisted until end-stage (up to 149 days of age).
Together, the temporal forelimb biomechanical changes that appear concurrently with the hindlimb foot drop present as a quickening in the steps of the forelimbs (increasing front swing speed/decreasing front swing duration) allowing the mouse to carry more weight on the forelimbs (during stand phase) in order to reduce stress on the hindlimbs.ese forelimb biomechanical alterations likely compensate for the hindlimb muscle weakness, identified by others at this time point (Hegedus et al., 2007), allowing fundamental locomotor parameters, such as stride length or step cycle, to remain unaffected.
In further support that these changes are representative of a forward-shiin mSOD1 center-of-gravity, an increase in mSOD1 front paw print length (LRT diff = 43.40; p < 0.001;Figure 2E) was identified at 61 days of age, compared to WT (WT, 0.818 ± 0.019; mSOD1, 0.869 ± 0.015; p = 0.037).A corresponding increase in front paw print area (LRT diff= 45.44; p < 0.001) was also detected a short time later at 69 days of age (data not shown); of which both continued until late disease stage. No differences in paw print width for the front or hind paws were identified throughout disease progression (data not shown). If the mSOD1 forelimb changes identified thus far constitute a forward-shift in mSOD1 center-of-gravity to counteract disease-induced hindlimb weakness, as evidenced by the foot drop symptom (increased hind paw print length;Figure 2A), we also expected to see corresponding changes in mSOD1 paw print intensities.As expected, the data revealed a significant and consistent decrease in the pressure applied by the hind paws (max intensity at hind;Figure 2F).is decrease in max intensity at hind (LRT diff = 63.35; p < 0.001) was significant at 65 days of age (WT, 47.100 ± 1.968; mSOD1, 40.885 ± 1.607; p =0.015) and persisted until end-stage (153 days of age). Max intensity at front showed a trend of increased pressure of the front paws in mSOD1 mice compared to WT (LRT diff= 24.31; p < 0.001), however, these differences were not significant (data not shown).us, these early changes in both front and hind paw print size and intensity during the stand phase are consistent with the forelimb swing phase changes.Suggesting that with the quickening of front stepping (increased front swing speed), the front paws are experiencing more leg loading (increased front paw print length and decreased hind paw max intensity at). The increased body weight placed on the forelimbs helps to explain why the duration of the front stand phase remains unchanged, while a significant increase in the front swing speed or decrease in swing phase duration (increased front duty cycle) minimally alters the biomechanical components of the step cycle without altering fundamental locomotor parameters.
From 69–85 days of age, mSOD1 mice displayed a temporary, hindlimb compensatory mechanism that resembled an exaggerated steppage gait
For the mSOD1 group as a whole, 69 days of age marked major changes in a set of hindlimb biomechanical components. Interestingly, these changes were temporary and were only maintained for approximately two weeks, adding further to the theory that these adjustments in biomechanical components are compensatory mechanisms in response to progressive disease-induced effects.
While the foot drop symptom and exaggerated steppage gait are normally identified together in patients, from the present longitudinal study, it is revealed that the foot drop symptom appears first, along with the forelimb compensatory mechanism, at approximately 61 days of age (Figure 2).Shifting some of the body weight to the forelimbs appears to effectively compensate for the hindlimb weakness and hind step cycle components remain unchanged. However,after one week, disease progression has likely resulted in further weakness and loss of control during plantarflexion and dorsiflexion, requiring additional adjustment in the hindlimb biomechanical components.e exaggerated steppage gait involves more substantial changes to the temporal components of the step cycle than those involved in the forward-shicenter-of-gravity mechanism described earlier,however, without kinematic measurements, these changes may not appear to be as robust.e quickened step, involved in the hindlimb exaggerated steppage gait, requires picking up the hind paw high enough to prevent tripping during the swing phase (compensation for a loss in dorsiflexion).is motion involves increasing the swing speed (Figure 3B),decreasing the swing phase duration (Figure 3A), increasing hind duty cycle (Figure 3D), and increasing the stand phase duration (Figure 3C).e increased stand phase duration is typical for an exaggerated steppage gait and is oen an indication of further muscle weakness and a loss of control necessary for plantarflexion during the heel strike or breaking phase (Djekidel and Harb, 2006). No significant differences in max contact at hind were identified (LRT diff = 56.40; p< 0.001), suggesting that no adjustments were made within the hind stand phase or that due to the forward-shift center-of-gravity compensatory mechanism, any changes in the temporal components within the hind stand phase were not detectable.
Interestingly, unlike the initial set of forelimb biomechanical changes, these collective changes in mSOD1 hind step cycle components were only temporary. Aer 85 or 87 days of age, hind swing phase, hind stand phase, hind swing speed, and hind duty cycle returned to WT levels (Figure 3)and the mSOD1 mice no longer displayed the exaggerated steppage gait. No differences in any of these hind step cycle biomechanical components were detected until much later and importantly, this later deviation from WT was in the opposite direction from the temporary changes displayed from 69 to 85 days of age.
Hind stand phase (Figure 3C) decreased in mSOD1 mice compared to WT at 117 days of age, (WT, 0.064 ± 0.002;mSOD1, 0.052 ± 0.002; p < 0.001) and continued until endstage. Aer 113 days of age, mSOD1 hind swing speed (Figure 3B) decreased significantly from the WT group (WT,116.400 ± 1.599; mSOD1, 109.920 ± 1.394; p = 0.002; at 115 days of age), and remained consistent until end-stage was reached. Hind swing phase (Figure 3A) duration remained steady, longitudinally, from 89 days of age until end-stage,with no differences between mSOD1 and WT groups, however, hind duty cycle (Figure 3D) trajectories revealed a decrease in the mSOD1 group starting at 127 days of age (WT,39.817 ± 1.129; mSOD1, 34.302 ± 1.107; p = 0.001). These findings suggest that disease progression has led to further muscle weakness and loss of control and the hindlimb steppage gait is no longer able to effectively compensate.
By 85 days of age, fundamental locomotor parameters are no longer maintained by compensatory mechanisms in mSOD1 mice
During the time period from 69 to 85 days of age, mSOD1 mice maintained the temporary, hind exaggerated steppage gait (Figure 3), as well as the 61 days of age forelimb compensatory changes (Figure 2). Although mSOD1 mice consistently presented with the hind foot drop, for nearly a two-week period (69–85 days of age), no other additional symptoms or compensatory changes were evident. Up to this point no changes in fundamental locomotor parameters (e.g.,stride length, cadence, etc.) or gross motor parameters (e.g.,distance travelled, max speed, etc.), had been detected, suggesting that the forelimb and hindlimb compensatory mechanisms were sufficient to counteract the disease-induced muscle weakness. However, by approximately 85 days of age,it was apparent that the compensatory mechanisms were no longer effective, the hindlimb changes associated with the temporary steppage gait (Figure 3), reverted back to WT levels. At this time, we also identified the first significant changes in fundamental locomotor parameters.
Starting at 83 days of age, mSOD1 mice displayed a significant increase in cadence (Figure 4A; LRT diff = 27.54; p< 0.001) compared to WT, until the mSOD1 mice reached end-stage (WT, 26.984 ± 0.300; mSOD1, 27.817 ± 0.245; p =0.025). Also, beginning at 83 days of age, mSOD1 hind stride length (Figure 4B; LRT diff = 68.52; p < 0.001) became significantly reduced, in comparison to WT hind stride length(WT, 9.226 ± 0.096; mSOD1, 8.947 ± 0.079; p = 0.025), and this difference was sustained throughout disease progression. The most common coupling pattern used by mice in the present study was one of the four diagonal paw coupling relationships, RH☒LF. At 85 days of age, the mSOD1 group displayed a decrease in the percent frequency of diagonal coupling RH☒LF (Figure 4C; LRT diff = 70.52; p < 0.001),compared to WT (WT, 101.810 ± 0.834; mSOD1, 99.584± 0.681; p = 0.039), until end-stage. While these changes in fundamental locomotor parameters could be defined as compensatory mechanisms to counter the disease process,they are an important indicator that the weakness and loss of motor control have reached a point where collective adjustments of biomechanical components are not effective and/or no longer sustainable.
Major changes in gross motor parameters appear with mSOD1 disease progression
Starting at 88 days of age, mSOD1 mice displayed a significant and steady decline in motor score (Figure 5A; LRT diff= 1052.67; p < 0.001; WT, 33.309 ± 0.974; mSOD1, 29.733 ±0.795; p = 0.005). In addition, while in the open field, the total distance travelled by mSOD1 mice (Figure 5B; LRT diff =114.15; p < 0.001) was significantly reduced by 92 days of age(WT, 781.900 ± 73.429; mSOD1, 533.580 ± 59.955; p = 0.009)in comparison to WT, until end-stage. At 95 days of age,we detected a significant reduction in the maximum peak force generated by the mSOD1 forelimbs (Grip Strengthbar;Figure 5C; LRT diff = 51.59; p < 0.001), vs. WT (WT,50.243 ± 3.467; mSOD1, 38.371 ± 2.831; p = 0.008). These findings suggest the mSOD1 mice were experiencing either forelimb muscle weakness or an overall general weakness at 95 days of age.is muscle weakness, as identified by the Grip Strength-bar continued until the mSOD1 mice were retired, aer 158 days of age. Interestingly, grip strength testing is routinely used in ALS patient treatment programs (Dal Bello-Haas et al., 1998). Max speed, achieved in the open field (Figure 5D; LRT diff = 375.81; p < 0.001), was significantly reduced, starting at 102 days of age in mSOD1 mice(WT, 46.884 ± 2.114; mSOD1, 40.624 ± 1.726; p = 0.022) vs.WT, until end-stage. At nearly the same time, mSOD1 mice revealed a change in the relative positions of the right paws,as identified by the CatWalk variable, print positions right(Figure 5E; LRT diff = 266.68; p < 0.001), which showed a significant increase in mSOD1 mice (WT, –0.104 ± 0.076;mSOD1, 0.214 ± 0.062; p = 0.001), from 103 days of age until the mice were retired. While WT mice continued to increase in body weight throughout the study, the mSOD1 group trajectory for body weight diverged from that of the WT group(Figure 5F; LRT diff = 1, 721.06; p < 0.001); becoming statistically significant by 110 days of age (WT, 21.366 ± 0.375;mSOD1, 20.211 ± 0.306; p = 0.017). After 110 days of age,mSOD1 mice experienced a steady decline in body weight.
In addition to these selected variables described, 16 additional variables were significantly different between WT and mSOD1 mice (p ≤ 0.05) aer 99 days of age.ese variables included both gross motor parameters and fundamental locomotor elements suggesting that impairment of gait, coordination, and muscle strength are detectable only in later stages of disease. Data is not shown for these variables, but the age range (days) of significant differences is included as well as the direction of the divergence of the mSDO1 group trajectory vs. WT trajectory. Inter-paw coordination variables showed late differences starting at 103 days of age and included: four lateral coupling patters (RF☒RH: ↑ mSOD1 vs. WT from 107–153 days; LF→LH: ↓ mSOD1 vs. WT from 111-153 days; LH☒LF: ↓ mSOD1 vs. WT from 111–153 days; RH☒RF: ↑ mSOD1 vs. WT from 111–153 days), two diagonal coupling patters (LF→RH: ↑ mSOD1 vs. WT from 113–151 days; LH☒RF: ↓ mSOD1 vs. WT from 111–151 days), diagonal support (↓ mSOD1 vs. WT from 115–143 days), NSSP Aa (alternate step pattern; ↓ mSOD1 vs. WT from 111–145 days), and regularity index (↓ mSOD1 vs. WT from 103–153 days). Gross motor parameters, Grip Strengthgrid (↓ mSOD1 vs. WT from 110–152 days) and front BOS (↑mSOD1 vs. WT from 99–153 days) also showed differences between WT and mSOD1 trajectories during late disease stage. Lastly, several fundamental locomotor elements related to the step cycle, also revealed late differences in mSOD1 mice: hind step cycle (↓ mSOD1 vs. WT from 105–153 days),hind single stance (↓ mSOD1 vs. WT from 105–153 days),front single stance (↓ mSOD1 vs. WT from 117–153 days),front stride length (↓ mSOD1 vs. WT from 105–153 days),and front step cycle (↓ mSOD1 vs. WT from 105–151 days).
mSOD1 subgroups displayed significant differences in survival and disease progression rates
In addition to identifying symptom onset and disease progression, behavioral testing can also be useful in determining disease progression rates and predicting disease severity and lifespan. Our lab has previously identified two mSOD1 subgroups, an FPG and an SPG, with different disease phenotypes at 112 days of age (Haulcomb et al., 2015).e present study determined that a combination of four variables (body weight,motor score, print positions right, and max speed) could be used in a cluster analysis to classify the mSOD1 mice into their respective subgroups (SPG n = 15; FPG n = 9). Survival analysis (Figure 6) revealed a significant difference between the FPG and SPG (Chi square = 24.52; p < 0.0001).e FPG displayed a severe disease phenotype with a median survival of only 133 days of age; mean survival age 129 ± 2.59 (SEM).The SPG showed a more mild disease phenotype surviving more than two weeks longer than the FPG; median survival of 146 days of age; mean survival age 148 ± 2.25 (SEM).

Figure 1 Depiction of the rodent step cycle.

Figure 2 mSOD1G93A hindlimb foot drop and forelimb compensatory mechanism.
In addition to confirming that the mSOD1 subgroups displayed a difference in overall survival, we also analyzed the FPG and SPG trajectories for all 88 variables (previously analyzed in the WT and mSOD1 groups), but excluded the four variables used in the cluster analysis. We determined that a subset of variables revealed the most significant differences between the FPG and SPG.ese variables, discussed below, are likely to be useful for monitoring disease progression rates among the mSOD1 subgroups. Importantly, we determined that the biomechanical components involved in the early mSOD1 compensatory mechanisms (Figures 2–3) were not particularly useful in identifying differences between the subgroups.is suggests that programs used to monitor disease progression rates in ALS patients may need to focus on distinct gait abnormalities than those identified as useful for diagnosis.
Front stride length (Figure 7A) was significantly reduced in the FPG vs. the SPG from as early as 55 days of age (SPG,9.068 ± 0.102; FPG, 8.642 ± 0.132; p = 0.011). Over the 34 Catwalk testing days, from 55 until 121 days of age (when the entire FPG had been retired), front stride length was significantly decreased in the FPG, compared to the SPG, for a total of 29 days (p ≤ 0.05 on the following: 55, 57, 59, 61,65, 67, 71, 73, 75, 81, 83, 85, 87, 89, 91, 95, 97, 99, 101, 103,105, 107, 109, 111, 113, 115, 117, 119, and 121 days of age).Hind stride length (Figure 7B) was also identified as significantly shorter in the FPG compared to the SPG beginning at 55 days of age (SPG, 9.050 ± 0.108; FPG, 8.603 ± 0.139; p =0.011). Over the 34 Catwalk testing days, hind stride length was significantly decreased in the FPG, compared to the SPG, for a total of 19 days (p ≤ 0.05 on the following: 55, 57,59, 61, 67, 71, 75, 83, 87, 89, 91, 95, 97, 101, 103, 111, 113,115, and 117 days of age).
Front step cycle duration (Figure 7C)was significantly decreased in the FPG compared to the SPG beginning at 57 days of age (SPG, 0.149 ± 0.002; FPG, 0.135 ± 0.003; p <0.001). Over the 34 Catwalk testing days, front step cycle was significantly decreased in the FPG, compared to the SPG, a total of 14 days (p ≤ 0.05 on the following: 57, 61, 83, 89, 97,99, 105, 107, 109, 113, 115, 117, 119, and 121 days of age).Hind step cycle (Figure 7D) was significantly shorter in the FPG vs. the SPG over a total of eight testing days, with the earliest differences detected at 57 days of age (SPG, 0.149 ±0.002; FPG, 0.136 ± 0.003; p = 0.003). Hind step cycle differences were identified on the following days of age: 57, 61, 71,97, 113, 115, 117, and 119 (p ≤ 0.05).
Front swing phase duration (Figure 7E) was significantly decreased in the FPG, compared to the SPG, from the very first CatWalk testing day, 51 days of age (SPG, 0.092 ± 0.002;FPG, 0.084 ± 0.003; p = 0.016). Throughout the Catwalk testing days (55–121 days of age), the FPG front swing phase was significantly shorter in duration, than that of the SPG,over 22 testing days (p ≤ 0.05 on the following: 51, 55, 57, 59,63, 67, 75, 83, 89, 95, 97, 101, 103, 105, 107, 109, 111, 113,115, 117, 119, and 121 days of age).
Consistent with the differences between mSOD1 subgroup trajectories thus far, the FPG displayed an increase in cadence, compared to the SPG (Figure 7F).e earliest significant increase in cadence was detected at 53 days of age (SPG,27.601 ± 0.341; FPG, 28.879 ± 0.440; p = 0.022). Fourteen out of 34 testing days revealed significant differences (p ≤ 0.05 on the following: 53, 57, 59, 61, 67, 75, 83, 89, 97, 101, 111,113, and 117 days of age).
Two variables in particular stood out as revealing late, but significant differences in rates of decline between the mSOD1 subgroups.ese two variables, hind single stance and hind stand phase, may prove useful in studies focused on altering disease progression rates after the onset of symptoms. Hind single stance (Figure 7G) duration revealed no difference between mSOD1 subgroups until 93 days of age (SPG, 0.058± 0.002; FPG, 0.052 ± 0.002; p = 0.039). Starting at 97 days of age, the FPG displayed a rapid, and consistent decline in hind single stance duration, until the last of the FPG mice were retired, at 121 days of age (days of age with significant differences: 93, 97, 99, 101, 103, 105, 107, 109, 111, 113, 115,117, 119, and 121; p ≤ 0.05). Linear regression analysis of hind single stance from 97 days of age until both groups were retired from CatWalk (153 days of age) revealed a significant difference in the slopes (F1,379= 5.160; p = 0.024; SPG, slope =–0.000416, R2= 0.265; FPG, slope = –0.000757, R2= 0.212).
Hind stand phase (Figure 7H) duration revealed no difference between mSOD1 subgroups until 97 days of age (SPG,0.070 ± 0.003; FPG, 0.057 ± 0.003; p = 0.002). Aer which,the FPG displayed a rapid and consistent decline in hind stand phase duration over the following days: 97, 99, 101,103, 105, 107, 111, 113, 115, 117, 119, and 121; p ≤ 0.05. Linear regression analysis of hind single stance from 97 days of age until groups were retired from CatWalk (153 days of age)did not reveal significant differences in the slopes (F1,379=3.2713; p = 0.071; SPG, slope = –0.000772, R2= 0.347; FPG,slope = –0.00117, R2= 0.225). However, when the slopes were compared from 97 until the FPG was retired (121 days of age), significant differences in the slopes were apparent(F1,277= 14.03; p < 0.001; SPG, slope = –0.000430, R2= 0.132;FPG, slope = –0.00117, R2= 0.225).us, for actively monitoring disease progression between groups within a study,the slopes of hind stand phase and hind single stance would likely prove to be very useful.
Discussion
Motor impairments and compensatory changes in mSOD1 mice
We have performed an extensive longitudinal biomechanical analysis in mSOD1 mice using multiple behavioral tests to assess motor deficits, changes in gait, and locomotor function. In the first aim of this study, we identified distinct patterns of symptomatic changes in mSOD1 mice throughout the course of the disease.ese disease-induced effects began with significant alterations in basic biomechanical components, then later developed into changes in fundamental locomotor elements, and ultimately impaired mSOD1 locomotion. Our results demonstrate that a majority of the early changes are compensatory in nature rather than direct measures of motor deficits.
Rodent locomotion is a complex process that can be broken down into fundamental elements and further, into more basic mechanical components. In order for the animal to adapt to environmental or internal changes that affect locomotion, the animal makes voluntary and involuntary adjustments to basic biomechanical components. Collectively,these adjustments are compensatory mechanisms that allow the animal to maintain the more fundamental locomotor elements, such as stride length and coupling patterns, which are responsible for energy-efficient and effective locomotion. We have classified our behavioral measurements, or variables, into three groups: biomechanical components,fundamental locomotor elements, and gross motor parameters (see materials and methods: classification of variables).We hypothesized that early, disease-induced effects would be revealed as compensatory mechanisms and restricted to adjustments in distinct sets of biomechanical components,while later changes will include fundamental locomotor elements and finally, changes in gross motor parameters will become apparent as paralysis occurs.
For a limited time, these initial mSOD1 forelimb changes appear to compensate for the progressive, underlying disease-induced weakness, as no additional changes in biomechanical components were identified and, more importantly,fundamental locomotor parameters were maintained, as compared to WT. However, starting at 69 days of age, we identified a second set of adjustments in biomechanical components that appear to be representative of a hindlimb compensatory mechanism. These hindlimb changes somewhat mirrored the earlier forelimb biomechanical component adjustments and included increased swing speed, decreased swing phase duration, and increased duty cycle (Figure 3).Although, these hindlimb changes were more encompassing in that they also included an increase in stand phase duration, which was not seen as part of the forelimb compensatory changes. Notably, the significant shito more time spent in hind stand phase was not accompanied by an increase in hind paw intensity. To the contrary, the decreased intensity of the hind paw prints, identified with the initial forelimb center-of-gravity shift, experienced an even further reduction in hind paw print intensity at 69 days of age (Figure 2F).ese data reveal that mSOD1 mice are compensating for further disease-induced changes by utilizing an exaggerated steppage gait, which is seen in ALS patients and oen accompanies the foot drop gait abnormality (Ben Hamida et al., 1990; Rainero et al., 1994; Alexander and Goldberg,2005).
Again, for a period of time, the combination of the mSOD1 compensatory mechanisms, i.e., a forward-shiin center-of-gravity and exaggerated hind steppage gait, appeared to successfully compensate for disease progression as no additional changes in other variables were identified,fundamental locomotor parameters were maintained, and gross motor parameters remained unaffected. However, at 85 days of age, it became evident that the severity of muscle weakness and loss of motor control had reached a stage where mSOD1 mice were no longer able to maintain the hind steppage gait (Figure 3), or it was no longer effective,and significant changes were seen in fundamental locomotor parameters.ese changes included an increase in cadence,a decrease in hind stride length, and a reduction in the most common inter-paw coupling pattern (Figure 4). While these changes are oen viewed as more significant and have been traditionally considered motor impairments, they are still arguably a method of compensation.ese changes in fundamental locomotor parameters allow the mice to maintain gross motor parameters, such as distance travelled and max speed in the open field.
Starting at 88 days of age, and thereaer, it was apparent that disease progression had resulted in significant motor impairment and compensatory mechanisms, even those involving adjustments in fundamental locomotor elements,were insufficient to counteract the loss of motor control,muscle strength, coordination, etc. (Figure 5).
We conclude that compensatory mechanistic changes dominate the initial, disease-induced changes. These early symptomatic changes are restricted to alterations in sets of biomechanical components which allow for the maintenance of more complex locomotor variables. In mSOD1 studies and in the clinical setting, programs that specifically monitor the progression of disease should be geared towards detecting and evaluating compensatory changes, particularly at early stages of disease. At later stages of disease, these patterns in locomotor changes can be especially useful in identifying disease progression rates.
Variability in disease progression and survival
It is well established that the variability in disease progression and the severity of ALS poses challenges to patients,physicians, and for studies such as clinical trials. However,this variability also implies the existence of disease modifiers that have a significant impact on disease progression and survival.us, there is a need to identify non-invasive tests to monitor symptom progression and, therefore, predict disease progression rates of patients. Classifying these patients may further our understanding of the impact of genetics and environmental factors that might affect disease severity.
While studies focused on underlying mechanisms of disease variability in patients are confounded by genetic heterogeneity and uncontrolled environmental factors, research using the mSOD1 mouse model has revealed great potential.For example, Nardo et al. (2013) performed transcriptome analysis throughout disease on spinal cord tissue of mSOD-1G93Amice on the C57 background (slowly progressing) and the 129Sv background (rapidly progressing), and identified increased expression of immune-related genes in the slowly progressing group. While this comparison is useful, searching for genetic differences between two different background strains still involves challenges in determining of which strain-specific differences contribute to the disparities in disease progression and survival. It is well known that the B6SJL hybrid background displays a relatively high variability in disease progression compared to other background strains, providing a unique opportunity to search for genetic modifiers of disease (Hamson et al., 2002; Heiman-Patterson et al., 2005., 2011).e challenge in using a single strain as a model for disease variability is the necessity to accurately identify the subgroups and to do so at a relatively early time point, such that subsequent analysis can be performed during disease progression.
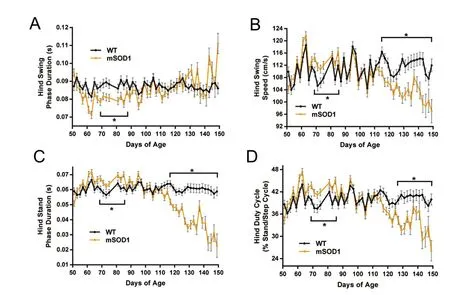
Figure 3 Temporary hindlimb steppage gait in mSOD1G93A mice.

Figure 4 Fundamental locomotor parameters are impaired in mSOD1G93A mice as the earlier hindlimb compensatory changes fade.
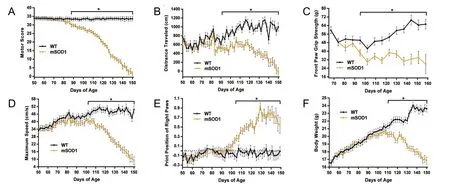
Figure 5 Gross motor impairments and muscular deficits apparent in mSOD1G93A mice between 88–110 days of age.

Figure 7 Fundamental locomotor parameters revealed significant differences in disease progression between mSOD1G93A subgroups: the fast progression group (FPG) and the slow progression group (SPG).

Figure 6 Survival analysis of mSOD1G93A subgroups.
Using the SJLB6 hybrid background, our lab has previously used cluster analysis to identify two mSOD1 subgroups (FPG and SPG), with different disease progression rates, based on analysis of motor score.e more rapid disease progression rate of the FPG correlated with increased disease-induced mRNA expression in the facial motor nucleus at 112 days of age (Haulcomb et al., 2015). In the second aim of the present study, we utilized the wealth of behavioral data generated and improved upon our previous method of B6SJL mSOD1 subgroup identification. In this study, we identified a set of four variables that, when used in combination with the KML3D cluster analysis, can demarcate the FPG and SPG.e FPG displayed a more severe disease phenotype, complete with a mean and median survival age that was more than two weeks earlier than that of the SPG. In addition, mouse trajectories of fundamental locomotor elements revealed an increase in the severity of symptoms and a steeper decline in motor function, between the FPG and SPG. Interestingly, the set of variables that identified the early disease-induced compensatory changes in mSOD1 mice vs. WT were different than the variables used to identify the mSOD1 subgroups,as well as those variables that most accurately analyze the differences in disease progression among the mSOD1 subpopulations.is suggests that while compensatory changes may be useful in identifying disease onset, impairments in gross motor parameters or fundamental locomotor ele-ments, should be considered when the focus is on disease progression and identifying subgroups.e ability to identify mSOD1 subgroups with the same background strain, but different disease phenotypes, presents a unique opportunity to search for genetic modifiers or other factors that may be enhancing or slowing disease progression.ese unknown factors are possible therapeutic targets with the potential to slow disease progression and/or provide insight into the underlying pathology and disease mechanisms.
Conclusion
Author contributions:All authors had full access to all the data in the study and take responsibility for the integrity of the data and the accuracy of the data analysis. MMH and KJJ were guarantors. MMH and KJJ were responsible for study concept, design and intellectual content. MMH,RMM, WMM, KPM and TJB were in charge of data acquisition. MMH,XW, WTB and SLD were in charge of statistical analysis of data. MMH prepared the paper. MMH, SLD, VMS and KJJ edited the paper. MMH,RMM, WMM, KPM, MJH, XW, WTB, SLD, TJB, VMS, KJJ reviewed the paper. KJJ supervised the study. All authors approved the final version of this paper.
Conflicts of interest:We have no conflict of interests.
Research ethics:The study procedures were performed in accordance with institutional and NIH guidelines for the Care and Use of Laboratory Animals for research purposes and were approved by the Institutional Animal Care and Use Committee (approval protocol 11227).
Data sharing statement:Datasets analyzed during the current study are available from the corresponding author on reasonable request.
Plagiarism check:Checked twice by ienticate.
Peer review: Externally peer reviewed.
Open access statement:is is an open access article distributed under the terms of the Creative Commons Attribution-NonCommercial-ShareAlike 3.0 License, which allows others to remix, tweak, and build upon the work non-commercially, as long as the author is credited and the new creations are licensed under identical terms.
Abe K, Aoki M, Ikeda M, Watanabe M, Hirai S, Itoyama Y (1996) Clinical characteristics of familial amyotrophic lateral sclerosis with Cu/Zn superoxide dismutase gene mutations. J Neurol Sci 136:108-116.
Alexander NB, Goldberg A (2005) Gait disorders: search for multiple causes. Cleve Clin J Med 72:586, 589-590, 592-584 passim.
Azzouz M, Leclerc N, Gurney M, Warter JM, Poindron P, Borg J (1997)Progressive motor neuron impairment in an animal model of familial amyotrophic lateral sclerosis. Muscle Nerve 20:45-51.
Batka RJ, Brown TJ, McMillan KP, Meadows RM, Jones KJ, Haulcomb MM (2014)e need for speed in rodent locomotion analyses. Anat Rec 297:1839-1864.
Ben Hamida M, Hentati F, Ben Hamida C (1990) Hereditary motor system diseases (chronic juvenile amyotrophic lateral sclerosis).Conditions combining a bilateral pyramidal syndrome with limb and bulbar amyotrophy. Brain 113 (Pt 2):347-363.
Brooks BR (2000) Risk factors in the early diagnosis of ALS: North American epidemiological studies. ALS CARE Study Group. Amyotroph Lateral Scler Other Motor Neuron Disord 1 Suppl 1:S19-26.
Brooks BR, Miller RG, Swash M, Munsat TL, World Federation of Neurology Research Group on Motor Neuron D (2000) El Escorial revisited: revised criteria for the diagnosis of amyotrophic lateral sclerosis.Amyotroph Lateral Scler Other Motor Neuron Disord 1:293-299.
Broom WJ, Russ C, Sapp PC, McKenna-Yasek D, Hosler BA, Andersen PM, Brown RH, Jr. (2006) Variants in candidate ALS modifier genes linked to Cu/Zn superoxide dismutase do not explain divergent survival phenotypes. Neurosci lett 392:52-57.
Calinski T, Harabasz J (1974) A dendrite method for cluster analysis.Comm Stat 3:1-27.
Chaudhuri KR, Crump S, al-Sarraj S, Anderson V, Cavanagh J, Leigh PN (1995)e validation of El Escorial criteria for the diagnosis of amyotrophic lateral sclerosis: a clinicopathological study. J Neurol Sci 129 Suppl:11-12.
Chen CJ, Chou LS (2010) Center of mass position relative to the ankle during walking: a clinically feasible detection method for gait imbalance. Gait Posture 31:391-393.
Chiu AY, Zhai P, Dal Canto MC, Peters TM, Kwon YW, Prattis SM,Gurney ME (1995) Age-dependent penetrance of disease in a transgenic mouse model of familial amyotrophic lateral sclerosis. Mol Cell Neurosci 6:349-362.
Cohen AH, Gans C (1975) Muscle activity in rat locomotion: movement analysis and electromyography of the flexors and extensors of the elbow. J Morphol 146:177-196.
Czaplinski A, Yen AA, Simpson EP, Appel SH (2006) Slower disease progression and prolonged survival in contemporary patients with amyotrophic lateral sclerosis: is the natural history of amyotrophic lateral sclerosis changing? Arch Neurol 63:1139-1143.
Dal Bello-Haas V, Kloos AD, Mitsumoto H (1998) Physical therapy for a patient through six stages of amyotrophic lateral sclerosis. Physer 78:1312-1324.
Dal Canto MC, Gurney ME (1995) Neuropathological changes in two lines of mice carrying a transgene for mutant human Cu,Zn SOD,and in mice overexpressing wild type human SOD: a model of familial amyotrophic lateral sclerosis (FALS). Brain Res 676:25-40.
de Carvalho M, Swash M (2006) Can selection of rapidly progressing patients shorten clinical trials in amyotrophic lateral sclerosis? Arch Neurol 63:557-560.
Desai J, Swash M (1999) Extrapyramidal involvement in amyotrophic lateral sclerosis: backward falls and retropulsion. J Neurol Neurosurg Psychiatry 67:214-216.
Djekidel M, Harb W (2006) A case of foot drop as an expression of brain metastases? Neurologist 12:274-275.
Genolini C, Alacoque X, Sentenac M, Arnaud C (2015) kml and kml3d:R Packages to Cluster Longitudinal Data. J Stat Sow 65:1-34.
Grohme K, Maravic MV, Gasser T, Borasio GD (2001) A case of amyotrophic lateral sclerosis with a very slow progression over 44 years.Neuromuscul Disord 11:414-416.
Gurney ME, Pu H, Chiu AY, Dal Canto MC, Polchow CY, Alexander DD, Caliendo J, Hentati A, Kwon YW, Deng HX, et al. (1994) Motor neuron degeneration in mice that express a human Cu,Zn superoxide dismutase mutation. Science 264:1772-1775.
Hamson DK, Hu JH, Krieger C, Watson NV (2002) Lumbar motoneuron fate in a mouse model of amyotrophic lateral sclerosis. Neuroreport 13:2291-2294.
Haulcomb MM, Mesnard NA, Batka RJ, Alexander TD, Sanders VM,Jones KJ (2014) Axotomy-induced target disconnection promotes an additional death mechanism involved in motoneuron degeneration in amyotrophic lateral sclerosis transgenic mice. J Comp Neurol 522:2349-2376.
Haulcomb MM, Mesnard-Hoaglin NA, Batka RJ, Meadows RM, Miller WM, McMillan KP, Brown TJ, Sanders VM, Jones KJ (2015) Identification of B6SJL mSOD1(G93A) mouse subgroups with different disease progression rates. J Comp Neurol 523:2752-2768.
Hegedus J, Putman CT, Gordon T (2007) Time course of preferential motor unit loss in the SOD1 G93A mouse model of amyotrophic lateral sclerosis. Neurobiol Dis 28:154-164.
Heiman-Patterson TD, Sher RB, Blankenhorn EA, Alexander G, Deitch JS, Kunst CB, Maragakis N, Cox G (2011) Effect of genetic background on phenotype variability in transgenic mouse models of amyotrophic lateral sclerosis: a window of opportunity in the search for genetic modifiers. Amyotroph Lateral Scler 12:79-86.
Heiman-Patterson TD, Deitch JS, Blankenhorn EP, Erwin KL, Perreault MJ, Alexander BK, Byers N, Toman I, Alexander GM (2005) Background and gender effects on survival in the TgN(SOD1-G93A)1Gur mouse model of ALS. J Neurol Sci 236:1-7.
Horak FB, Dimitrova D, Nutt JG (2005) Direction-specific postural instability in subjects with Parkinson’s disease. Exp Neurol 193:504-521.
Kim W, Kim JS, Lee KS, Gwoun YJ, Kim JM, Lee KH (2007) Anticipation and phenotypic heterogeneity in korean familial amyotrophic lateral sclerosis with superoxide dismutase 1 gene mutation. J Clin Neurol 3:38-44.
Lavelle JM, McKeigue ME (2009) Musculoskeletal dysfunction and drop foot: diagnosis and management using osteopathic manipulative medicine. J Am Osteopath Assoc 109:648-650.
Liu XX, Zhang J, Zheng JY, Zhang S, Xu YS, Kang DX, Fan DS (2009)Stratifying disease stages with different progression rates determined by electrophysiological tests in patients with amyotrophic lateral sclerosis. Muscle Nerve 39:304-309.
Lopate G, Baloh RH, Al-Lozi MT, Miller TM, Fernandes Filho JA, Ni O, Leston A, Florence J, Schierbecker J, Allred P (2010) Familial ALS with extreme phenotypic variability due to the I113T SOD1 mutation. Amyotroph Lateral Scler 11:232-236.
Ludolph AC, Bendotti C, Blaugrund E, Hengerer B, Loffler JP, Martin J, Meininger V, Meyer T, Moussaoui S, Robberecht W, Scott S, Silani V, Van Den Berg LH, Preclinical EGftEoGftCo, Proof of Concept Studies in ALSMNDM (2007) Guidelines for the preclinical in vivo evaluation of pharmacological active drugs for ALS/MND: report on the 142nd ENMC international workshop. Amyotroph Lateral Scler 8:217-223.
Ludolph AC, Bendotti C, Blaugrund E, Chio A, Greensmith L, Loeffler JP, Mead R, Niessen HG, Petri S, Pradat PF, Robberecht W, Ruegg M,Schwalenstocker B, Stiller D, van den Berg L, Vieira F, von Horsten S (2010) Guidelines for preclinical animal research in ALS/MND: A consensus meeting. Amyotroph Lateral Scler 11:38-45.
Maeda T, Kurahashi K, Matsunaga M, Inoue K, Inoue M (1997) On intra-familial clinical diversities of a familial amyotrophic lateral sclerosis with a point mutation of Cu/Zn superoxide dismutase (Asn 86-Ser). Brain Nerve 49:847-851.
Moon Y, Sung J, An R, Hernandez ME, Sosnoff JJ (2016) Gait variability in people with neurological disorders: A systematic review and meta-analysis. Hum Mov Sci 47:197-208.
Morgan D, Funk M, Crossley M, Basran J, Kirk A, Dal Bello-Haas V(2007)e potential of gait analysis to contribute to differential diagnosis of early stage dementia: current research and future directions.Can J Aging 26:19-32.
Naganska E, Matyja E (2011) Amyotrophic lateral sclerosis - looking for pathogenesis and effective therapy. Folia Neuropathol 49:1-13.
Nardo G, Iennaco R, Fusi N, Heath PR, Marino M, Trolese MC, Ferraiuolo L, Lawrence N, Shaw PJ, Bendotti C (2013) Transcriptomic indices of fast and slow disease progression in two mouse models of amyotrophic lateral sclerosis. Brain 136:3305-3332.
Noldus (2011) CatWalk XT Reference Manual Version 9.1. Noldus Information Technology bv http://wwwnolduscom/knowledge-base/catwalk-xt-91-reference-manual-toc
Penco S, Lunetta C, Mosca L, Maestri E, Avemaria F, Tarlarini C, Patrosso MC, Marocchi A, Corbo M (2011) Phenotypic heterogeneity in a SOD1 G93D Italian ALS family: an example of human model to study a complex disease. J Mol Neurosci 44:25-30.
Piaceri I, Del Mastio M, Tedde A, Bagnoli S, Latorraca S, Massaro F,Paganini M, Corrado A, Sorbi S, Nacmias B (2012) Clinical heterogeneity in Italian patients with amyotrophic lateral sclerosis. Clin Genet 82:83-87.
Rainero I, Pinessi L, Tsuda T, Vignocchi MG, Vaula G, Calvi L, Cerrato P, Rossi B, Bergamini L, McLachlan DR, et al. (1994) SOD1 missense mutation in an Italian family with ALS. Neurology 44:347-349.
Ratovitski T, Corson LB, Strain J, Wong P, Cleveland DW, Culotta VC,Borchelt DR (1999) Variation in the biochemical/biophysical properties of mutant superoxide dismutase 1 enzymes and the rate of disease progression in familial amyotrophic lateral sclerosis kindreds.Hum Mol Genet 8:1451-1460.
Regal L, Vanopdenbosch L, Tilkin P, Van den Bosch L,ijs V, Sciot R,Robberecht W (2006)e G93C mutation in superoxide dismutase 1: clinicopathologic phenotype and prognosis. Arch Neurol 63:262-267.
Saeed M, Yang Y, Deng HX, Hung WY, Siddique N, Dellefave L, Gellera C, Andersen PM, Siddique T (2009) Age and founder effect of SOD1 A4V mutation causing ALS. Neurology 72:1634-1639.
Scholle HC, Jinnah HA, Arnold D, Biedermann FH, Faenger B,Grassme R, Hess EJ, Schumann NP (2010) Kinematic and electromyographic tools for characterizing movement disorders in mice.Mov Disord 25:265-274.
Senda J, Atsuta N, Watanabe H, Bagarinao E, Imai K, Yokoi D, Riku Y,Masuda M, Nakamura R, Watanabe H, Ito M, Katsuno M, Naganawa S, Sobue G (2017) Structural MRI correlates of amyotrophic lateral sclerosis progression. J Neurol Neurosurg Psychiatry Epub.
Sinaki M, Mulder DW (1978) Rehabilitation techniques for patients with amyotrophic lateral sclerosis. Mayo Clin Proc 53:173-178.
Smith RA, Norris FH, Jr. (1975) Symptomatic care of patients with amyotrophic lateral sclerosis. JAMA 234:715-717.
Swinnen B, Robberecht W (2014)e phenotypic variability of amyotrophic lateral sclerosis. Nat Rev Neurol 10:661-670.
Verghese J, Ambrose AF, Lipton RB, Wang C (2010) Neurological gait abnormalities and risk of falls in older adults. J Neurol 257:392-398.
Verghese J, Lipton RB, Hall CB, Kuslansky G, Katz MJ, Buschke H (2002)Abnormality of gait as a predictor of non-Alzheimer’s dementia. N Engl J Med 347:1761-1768.
Verghese J, LeValley A, Hall CB, Katz MJ, Ambrose AF, Lipton RB (2006)Epidemiology of gait disorders in community-residing older adults. J Am Geriatr Soc 54:255-261.
Wijesekera LC, Leigh PN (2009) Amyotrophic lateral sclerosis. Orphanet J Rare Dis 4:3.
Wolf J, Safer A, Wohrle JC, Palm F, Nix WA, Maschke M, Grau AJ (2014)Factors predicting one-year mortality in amyotrophic lateral sclerosis patients--data from a population-based registry. BMC Neurol 14:197.
Yang WW, Sidman RL, Taksir TV, Treleaven CM, Fidler JA, Cheng SH,Dodge JC, Shihabuddin LS (2011) Relationship between neuropathology and disease progression in the SOD1(G93A) ALS mouse.Exp Neurol 227:287-295.
*Correspondence to:
Melissa M. Haulcomb, Ph.D.,mhaulcom@iupui.edu.
orcid:
0000-0001-6464-8402
(Melissa M. Haulcomb)
10.4103/1673-5374.217346
Accepted: 2017-08-28
Edited by Li CH, Song LP, Zhao M
杂志排行

中国神经再生研究(英文版)的其它文章
- Matrix bound vesicles and miRNA cargoes are bioactive factors within extracellular matrix bioscaffolds
- Diffusion tensor tractography studies on mechanisms of recovery of injured fornix
- Using 3D bioprinting to produce mini-brain
- Beta secretase activity in peripheral nerve regeneration
- Embracing oligodendrocyte diversity in the context of perinatal injury
- On the road towards the global analysis of human synapses