Age-related connectivity differences between attention deficit and hyperactivity disorder patients and typically developing subjects: a resting-state functional MRI study
2017-11-08JisuJongBoyongParkJwanhoChoJyunjinPark
Jisu Jong, Bo-yong Park, Jwan-ho Cho, Jyunjin Park,
1 Department of Electronic, Electrical and Computer Engineering, Sungkyunkwan University, Suwon, Korea
2 Center for Neuroscience Imaging Research (CNIR), Institute for Basic Science, Suwon, Korea
3 School of Electronic and Electrical Engineering, Sungkyunkwan University, Suwon, Korea
How to cite this article: Hong J, Park BY, Cho HH, Park H (2017) Age-related connectivity differences between attention deficit and hyperactivity disorder patients and typically developing subjects: a resting-state functional MRI study. Neural Regen Res 12(10):1640-1647.
Funding: is work was supported by the Institute for Basic Science [grant No. IBS-R015-D1] and the National Research Foundation of Korea(grant No. NRF-2016R1A2B4008545).
Age-related connectivity differences between attention deficit and hyperactivity disorder patients and typically developing subjects: a resting-state functional MRI study
Jisu Jong1,2, Bo-yong Park1,2, Jwan-ho Cho1,2, Jyunjin Park2,3,*
1 Department of Electronic, Electrical and Computer Engineering, Sungkyunkwan University, Suwon, Korea
2 Center for Neuroscience Imaging Research (CNIR), Institute for Basic Science, Suwon, Korea
3 School of Electronic and Electrical Engineering, Sungkyunkwan University, Suwon, Korea
How to cite this article: Hong J, Park BY, Cho HH, Park H (2017) Age-related connectivity differences between attention deficit and hyperactivity disorder patients and typically developing subjects: a resting-state functional MRI study. Neural Regen Res 12(10):1640-1647.
Attention deficit and hyperactivity disorder (ADHD) is a disorder characterized by behavioral symptoms including hyperactivity/impulsivity among children, adolescents, and adults.ese ADHD related symptoms are influenced by the complex interaction of brain networks which were under explored. We explored age-related brain network differences between ADHD patients and typically developing (TD) subjects using resting state fMRI (rs-fMRI) for three age groups of children, adolescents, and adults. We collected rs-fMRI data from 184 individuals (27 ADHD children and 31 TD children; 32 ADHD adolescents and 32 TD adolescents; and 31 ADHD adults and 31 TD adults).e Brainnetome Atlas was used to define nodes in the network analysis. We compared three age groups of ADHD and TD subjects to identify the distinct regions that could explain age-related brain network differences based on degree centrality, a well-known measure of nodal centrality.e lemiddle temporal gyrus showed significant interaction effects between disease status (i.e., ADHD or TD) and age (i.e., child, adolescent, or adult) (P < 0.001). Additional regions were identified at a relaxed threshold (P < 0.05). Many of the identified regions (the leinferior frontal gyrus,the lemiddle temporal gyrus, and the leinsular gyrus) were related to cognitive function.e results of our study suggest that aberrant development in cognitive brain regions might be associated with age-related brain network changes in ADHD patients.ese findings contribute to better understand how brain function influences the symptoms of ADHD.
nerve regeneration; attention deficit and hyperactivity disorder; cognitive function; connectivity;resting-state fMRI; Brainnetome Atlas; whole brain analysis; disease-aging interaction effect; neuroscience;neural regeneration
Introduction
Attention deficit and hyperactivity disorder (ADHD) is a brain disorder that is characterized by the symptoms of inattention and hyperactivity/impulsivity (Schneider et al., 2006;Subcommittee on Attention-Deficit/Hyperactivity Disorder,2011; Castellanos and Proal, 2012). In addition to inattentive or hyperactive behaviors, ADHD is also known to be highly associated with cognitive dysfunction (Wilens et al., 1999;Segen, 2006; Rostain and Ramsay, 2006; Solanto et al., 2008;Knouse and Safren, 2010; Castellanos and Proal, 2012).Castellanos et al. (2006) suggested that ADHD-related studies should consider cognitive deficits in ADHD patients to better quantify their neurobehavioral symptoms. Previous studies have adopted cognitive behavioral treatment (CBT)approaches to treat ADHD patients (Wilens et al., 1999;Rostain and Ramsay, 2006; Solanto et al., 2008; Knouse and Safren, 2010). Solanto et al. (2008) found enhanced executive skills in ADHD patients who received CBT and others found a significant reduction in ADHD-related symptoms aer receiving combined medication and CBT (Rostain and Ramsay, 2006).ese studies suggested that ADHD is highly related to dysfunctions in cognitive processes.
ADHD is a lifetime mental disorder and it has been found that patients show distinct behavioral symptoms across different age groups (Bresnahan and Barry, 2002; Schneider et al., 2006; Hurtig et al., 2007; Subcommittee on Attention-Deficit/Hyperactivity Disorder, 2011; Castellanos and Proal, 2012; Park et al., 2016).ese ADHD related symptoms are influenced by the complex interaction of brain networks which are typically explored using neuroimaging approaches (Zang et al., 2007; Tian et al., 2008; Cortese et al., 2012). Most ADHD studies have focused on exploring the differences in brain function in limited age groups (i.e.,only in children or adolescents) and studies investigating brain networks among a wide spectrum of age groups (i.e.,from children to adults) have been largely lacking (Wilens et al., 1999; Castellanos et al., 2006; Knouse and Safren, 2010;Konrad and Eickhoff, 2010; Uekermann et al., 2010). ADHD patients show age dependent alterations in brain networks which have not been fully explored. Here, we aimed to explore the age-related functional changes in brain networks in ADHD patients.
We explored the age-related brain network differences between ADHD patients and typically developing (TD) subjects using resting state functional magnetic resonance imaging(rs-fMRI). Rs-fMRI is an effective tool for analyzing neurobehavioral disorders such as ADHD (dos Santos Siqueira et al., 2014). One study reported that rs-fMRI demonstrated enhanced brain activation in the sensory-related cortices of adolescent ADHD patients (Tian et al., 2008). Another study found that a feature derived from rs-fMRI known as amplitude of low-frequency revealed significant differences between children with ADHD and TD children (Zang et al., 2007).
We assessed functional brain network differences using a network centrality measure which has been widely used to assess regional importance (Bullmore et al., 2009; Rubinov and Sporns, 2010; Ferreira and Busatto, 2013). We hypothesized that there would be age-related functional network differences between ADHD patients and TD subjects. In this study, we aimed to explore functional brain network changes related to ADHD among a wide spectrum of age groups.
Subjects and Methods
Subjects and imaging data
The Institutional Review Board (IRB) of Sungkyunkwan University approved our retrospective study (#2015-09-007).Our study was performed in full accordance with the principles of the Declaration of Helsinki, and informed consent was obtained from all subjects. We collected raw T1-weighted structural MRI and rs-fMRI data from the ADHD-200 database (ADHD-200 Consortium, 2012; Bellec et al., 2017).We also obtained structural and functional MRI data from the Human Connectome Project (HCP) database (Van Essen et al., 2013). The ADHD-200 database provided the child and adolescent data and the HCP database provided the adult data.e subjects were recruited via advertisement and further details were available (ADHD-200 Consortium,2012; Van Essen et al., 2013). Scores related to ADHD symptoms were measured using Conner’s Parent Rating Scale Revised, Long Version (CPRS-LV) for the ADHD-200 dataset and Diagnostic and Statistical Manual of Mental Disorders,Fourth Edition (DSM-IV) for the HCP data (American Psychiatric Association, 1994; Conners et al., 1998). With both the ADHD-200 and HCP datasets, subjects with T-scores greater than or equal to 65 on at least one measure of the ADHD-related index were selected as ADHD patients. Subjects with a secondary diagnosis were excluded along with subjects who did not have ADHD-related scores. Based on these criteria, we classified subjects into the ADHD (n = 90)and TD groups (n = 94). Each group was further divided into child, adolescent, and adult groups based on age. Subjects under 10 years of age were considered children, and subjects between 10 and 19 years of age were classified as adolescents. Finally, 27 ADHD children, 32 ADHD adolescents, 31 ADHD adults, 31 TD children, 32 TD adolescents,and 31 TD adults were included in the study. Comparison of the sex ratio did not yield significant differences among the groups. Detailed participant information is given inTable 1.
Although the ADHD-200 database consists of eight data collection sites, data from only two sites were retained aer adopting the criteria mentioned above: the Kennedy Krieger Institute (KKI) and New York University Child Study Center (NYU). The T1-weighted structural data from the KKI were acquired with the following imaging parameters:repetition time (TR) = 8.0 ms; echo time (TE) = 3.7 ms; field of view (FOV) = 256 × 256 mm2; and voxel resolution = 1.0× 1.0 × 1.0 mm3.e rs-fMRI functional data from the KKI were acquired with the following imaging parameters: TR= 2,500 ms; TE = 30 ms; FOV = 256 × 256 mm2; number of slices = 72; and voxel resolution = 2.67 × 2.67 × 3.0 mm3.The T1-weighted structural data from NYU were acquired with the following imaging parameters: TR = 2,530 ms; TE= 3.25 ms; FOV = 256 × 256 mm2; and voxel resolution =1.3 × 1.0 × 1.3 mm3.e rs-fMRI functional data from NYU were acquired with the following imaging parameters: TR= 2,000 ms; TE = 15 ms; FOV = 240 × 192 mm2; number of slices = 33; and voxel resolution = 3.0 × 3.0 × 4.0 mm3.e T1-weighted structural data from the HCP were acquired with the following imaging parameters: TR = 2,400 ms; TE =2.14 ms; FOV = 224 × 224 mm2; and voxel resolution = 0.7 ×0.7 × 0.7 mm3. Finally, the rs-fMRI functional data from the HCP were acquired with the following imaging parameters:TR = 720 ms; TE = 33.1 ms; FOV = 208 × 180 mm2; number of slices = 72; and voxel resolution = 2.0 × 2.0 × 2.0 mm3.The TD-child group included 16 subjects from the KKI site and 15 subjects from the NYU site.e TD-adolescent group included 16 subjects from the KKI site and 16 subjects from the NYU site. The TD-adult group included 31 subjects from the HCP site. The ADHD-child group included 6 subjects from the KKI site and 21 subjects from the NYU site.e ADHD-adolescent group included 5 subjects from the KKI site and 27 subjects from the NYU site.e ADHD-adult group included 31 subjects from the HCP site.
Imaging preprocessing
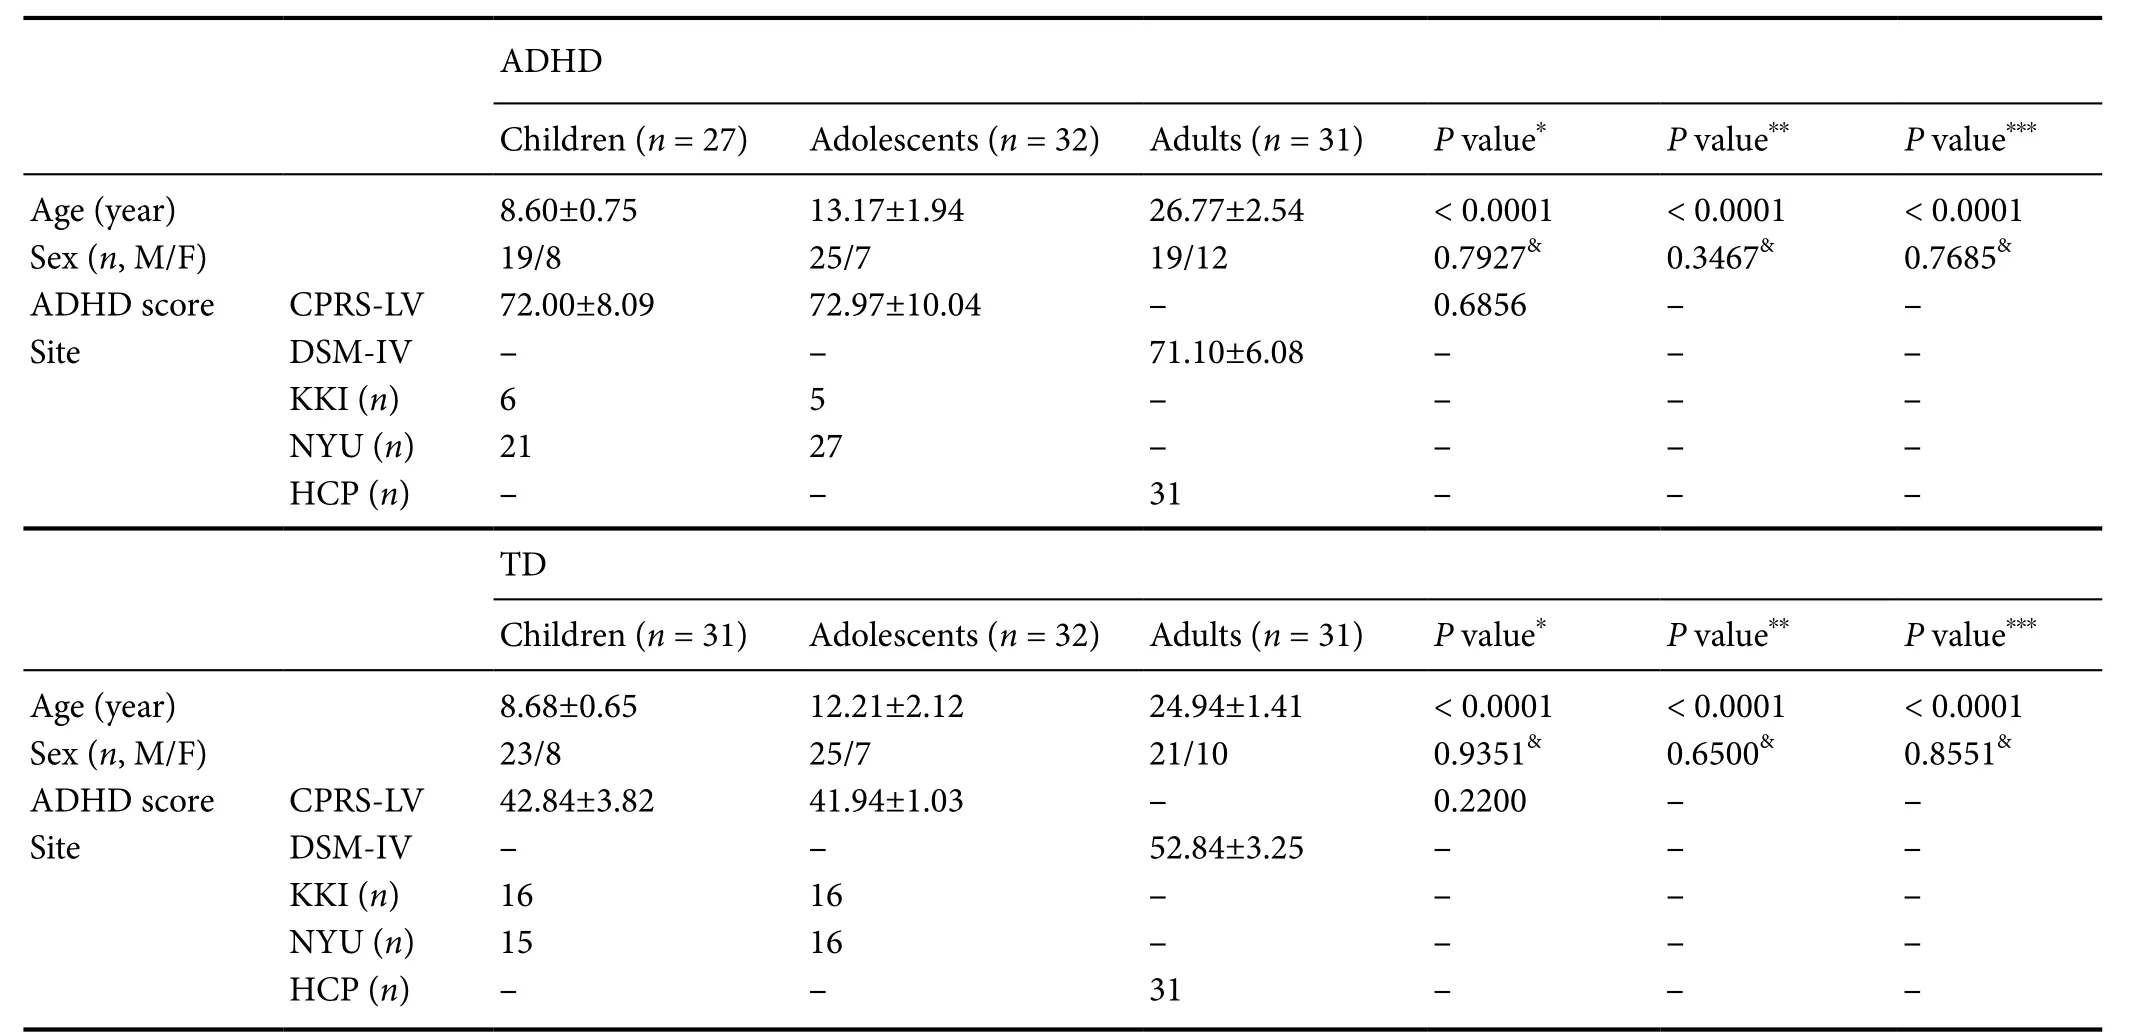
Table 1 Demographic data of children, adolescents, and adults in the ADHD and TD groups

Table 2 Identified regions with significant interaction effects of age-by-status
Network construction
To construct the functional network from the images, connectivity analysis was performed with regions of interest(ROIs) specified by the Brainnetome Atlas.e Brainnetome Atlas is a structural atlas that consists of 246 regions (Fan et al., 2016). Connectivity information was assessed with a graph structure using nodes and edges.e nodes were 246 ROIs derived from the Brainnetome Atlas. Pearson correlation values of the time series between two nodes were used as edges.e edge values were filled into the matrix as elements and the matrix was referred to as the correlation matrix. We adopted the weighted and un-directional network model. Sothresholding was used to prevent binarizing of the correlation matrix using the following equation (1).

Connectivity measures
We used degree centrality (DC) to assess the regional connectivity of brain networks (Lohmann et al., 2010; Fransson et al., 2011). The DC value for a node i is defined as the number of links connected directly to the node (Rubinov and Sporns, 2010). We used MATLAB (version 2016; Mathworks Inc., Natic, MA, USA) to compute the DC values (e Mathworks Inc., 2016).
Multi-site effect
Since our neuroimaging data was acquired from different sites, we adopted a dummy coding regression model to remove multi-site effects from the DC values using the following equation (2).

Statistical analysis
We used MATLAB for statistical analysis (version 2016;Mathworks Inc.).e two-way analysis of variance (ANOVA) was used to explore differences in age-related DC patterns between the ADHD and TD groups (Fujikoshi, 1993).e DC values were set as the dependent variables, and disease status (ADHD or TD) and age group (child, adolescent,or adult) were set as the independent variables.e significance of the interaction effects of disease and age group was quantified using P values (P < 0.001). We adopted an uncorrected P value of 0.001 due to the exploratory nature of our study. We applied a stringent P value threshold of 0.001 compared to the conventional 0.05 since our study was an exploratory study investigating 246 regions covering the whole brain. We also reported results using a relaxed P value of 0.05. Chi-square tests were applied to assess differences in sex among comparison groups.
Results
Motion scrubbing
We calculated the FD for each volume from the rs-fMRI data. Two children from the TD group had part of the frames scrubbed.Figure 1shows the FD of these two subjects. We removed 13 frames from one child in the TD group and 5 frames from the other child in the TD group.
Connectivity differences
We performed a two-way ANOVA to determine the brain regions that showed significant interaction effects of disease status and age. The left superior frontal gyrus, left inferior frontal gyrus, right inferior frontal gyrus, right precentral gyrus, left superior temporal gyrus, left middle temporal gyrus, right postcentral gyrus, leinsular gyrus, lemedioventral occipital cortex, right medioventral occipital cortex,leamygdala, and lebasal ganglia showed significant interaction effects (P < 0.05) (Table 2).Figure 2ashows the locations and their P values of the identified regions. Among the identified regions, the lemiddle temporal gyrus showed the most significant interaction effects (P < 0.001;Figure 2b). Further post-hoc tests were not conducted because there were no significant main effects of disease status and age.
Age-related patterns
We show regions that have significant age-by-status interaction for each age group inFigure 3.
Discussion
The main purpose of this study was to determine if there were age-related network differences between ADHD patients and TD subjects. We divided the subjects into six groups based on disease status (i.e., ADHD or TD) and age(i.e., children, adolescents, and adults) to form comparison groups. From the two-way ANOVA results, we found significant interaction effects of disease status and age. Since this was an exploratory study investigating hundreds of brain regions, we relaxed the constraint of the P value and found significant interaction effects of disease status and age based on functional connectivity.
Among the identified regions, the leinferior frontal gyrus, the lemiddle temporal gyrus, which showed the most significant interaction effects, and the leinsular gyrus were known to be related to cognitive function (Vandenberghe et al., 1996; Goel and Dolan, 2001; Swick et al., 2008; Fan et al.,2016). Swick et al. (2008) reported that subjects with damage in the left inferior frontal gyrus and left insula region had higher error rates than controls in a response inhibition task.e response inhibition task is known as a major task that can discriminate between ADHD and TD subjects(Nigg, 1999; Epstein et al., 2001; Tamm et al., 2004). Tamm et al. (2004) also found significant differences in brain activation in the middle temporal gyrus between subjects with ADHD and TD subjects in a behavioral response inhibition task.Figure 4Bshows the locations of these regions.ere is a noticeable overlap between the region previously reported in the literature and the region we found as shown inFigure 4A.e cognitive system plays an important role in typical development from childhood through adolescence to adulthood (Blakemore and Choudhury, 2006).us, aberrant development in the cognitive brain regions that we identified between ADHD and TD groups implies that impairment in cognitive function might be associated with age-related brain network changes in ADHD patients.

Figure 1 e plot of the FD values for two children from TD group whose frames were partly censored.
In this study, we used multi-center neuroimaging data to obtain a sufficient number of samples. Although the differences in imaging parameters were relatively small, this could lead to different amounts of noise and distortions in the data, making a fair comparison difficult.e high-resolution data from the HCP were resampled and pre-processed to low-resolution ADHD-200 data so that data can be fairly compared. We applied the common image processing steps performed on the low quality (i.e., low resolution ADHD-200) spatial reference space so that high quality (i.e., high resolution HCP) data was effectively rendered to low quality data. Such approaches have been successfully applied in other studies (Fennema-Notestine et al., 2007; Di Martino et al., 2014; Bellec et al., 2017). We visually confirmed similar image qualities by computing the average of T1-weighted structural data for each subgroup as shown inFigure 5and they all appeared similar in the low resolution common space. Furthermore, we used the correlation of rs-fMRI time series between two different brain regions as the main feature in this study. Each region contained over hundreds of voxels, hence the regional average time series might reduce the potential differences in image quality. Finally, we also performed a multi-site regression using the dummy-coding to remove the potential multi-site effects from the centrality measurement.e dummy-coding regression approach has been applied in other studies comparing data from different sites (Hardy, 1993; Sanfilipo et al., 2004).

Figure 2 Brain regions that showed a significant age-by-status interaction by the two-way analysis of variance (ANOVA) test using degree centrality (DC).
We used Brainnetome atlas to specify the ROIs for child,adolescent, and adult groups. The Brainnetome atlas was derived from adults and thus application to adults is natural. We investigated if a single atlas could specify the ROIs for various age groups. We registered T1 anatomical images onto a common space for each age group and then compared averaged images with one another. The average images for each age group appeared quite similar and those for each group were compared with overlaid ROIs from the atlas and they seemed reasonable as well.
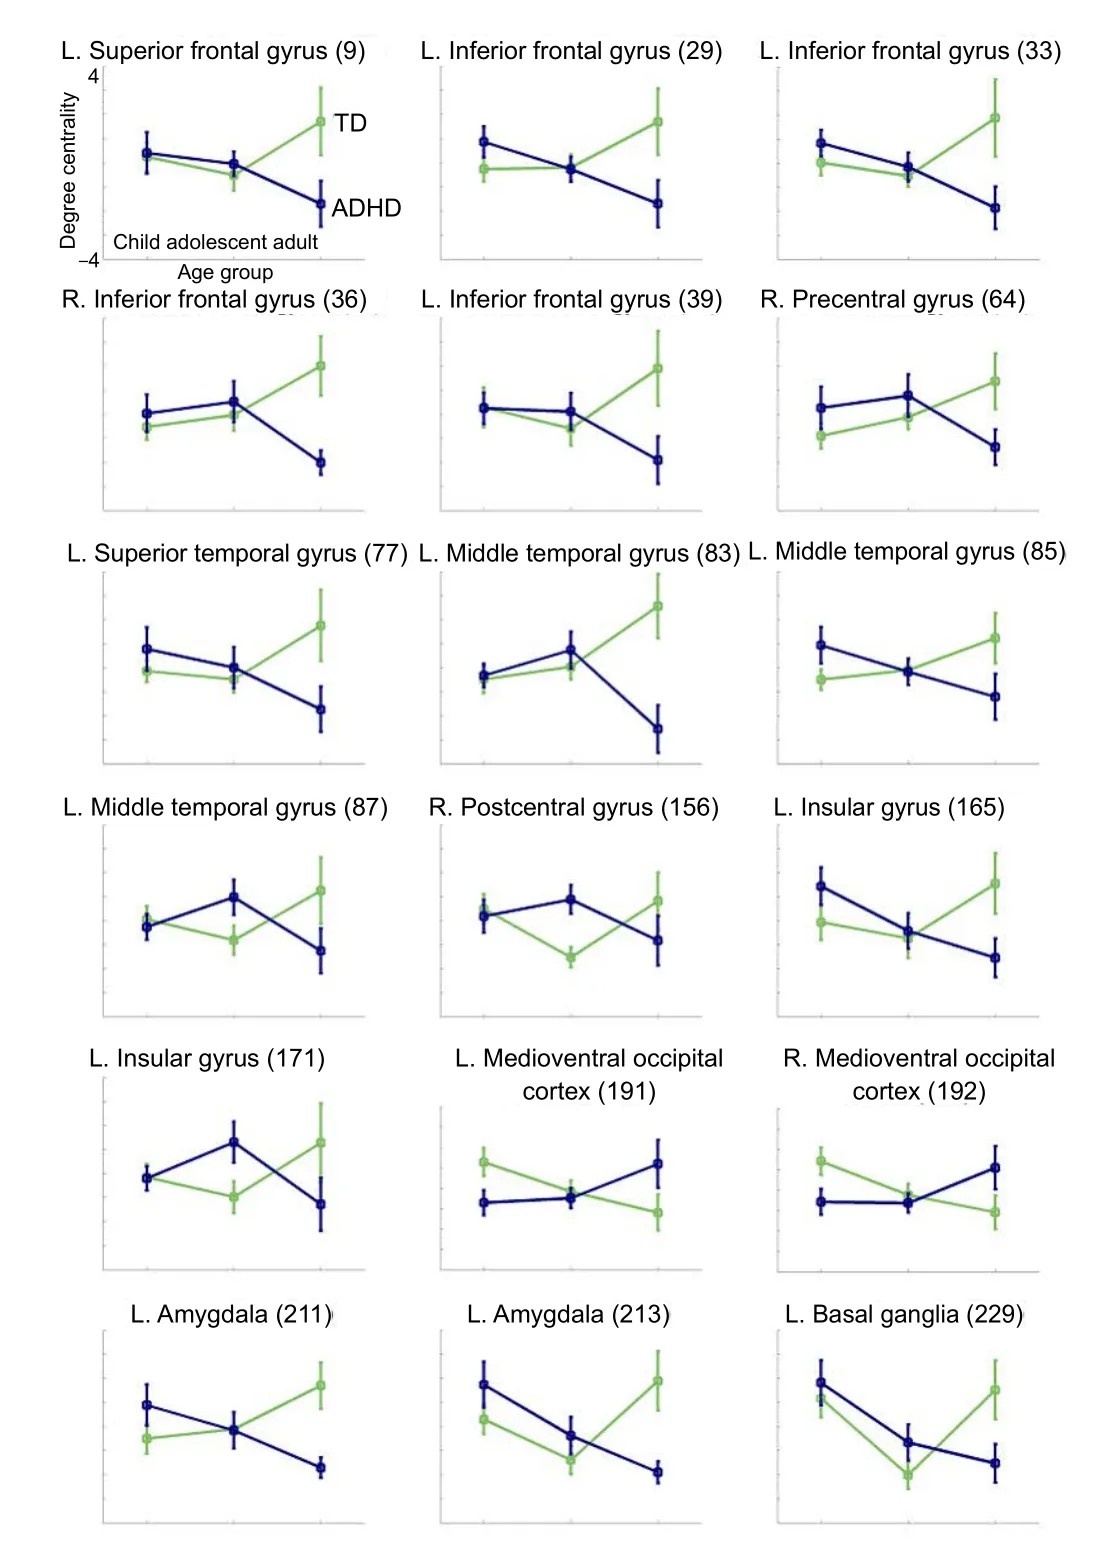
Figure 3 Age-related degree centrality patterns of the identified regions.
Our study adopted an uncorrected P value of 0.001 for statistical significance. We had limited samples but explored hundreds of regions and thus we chose to adopt an uncorrected P value. Use of an uncorrected P value is rather common in many exploratory studies involving the whole brain(Konishi et al., 1999; Anand et al., 2005).
Our study has some limitations. First, rs-fMRI was the only modality used. Using multi-modal imaging data might provide complementary information that could better describe the differences between the ADHD and TD groups.Second, the sample size might be insufficient due to the limitation of available cases from the online databases. A future study performed on a larger cohort is necessary to confirm our findings with higher statistical power. Third, we could not compute the correlation between DC and ADHD scores,because we used two types of ADHD related scores coming from two research databases. Finally, we did not consider longitudinal data for our study, as we are not aware of any openly accessible research database housing longitudinal ADHD neuroimaging data. Thus, we performed our study in a cross-sectional fashion with comparison of different age groups within the ADHD and TD groups. Ideally, a future study should consider longitudinal cases so that age-related brain network differences in ADHD could be better assessed.
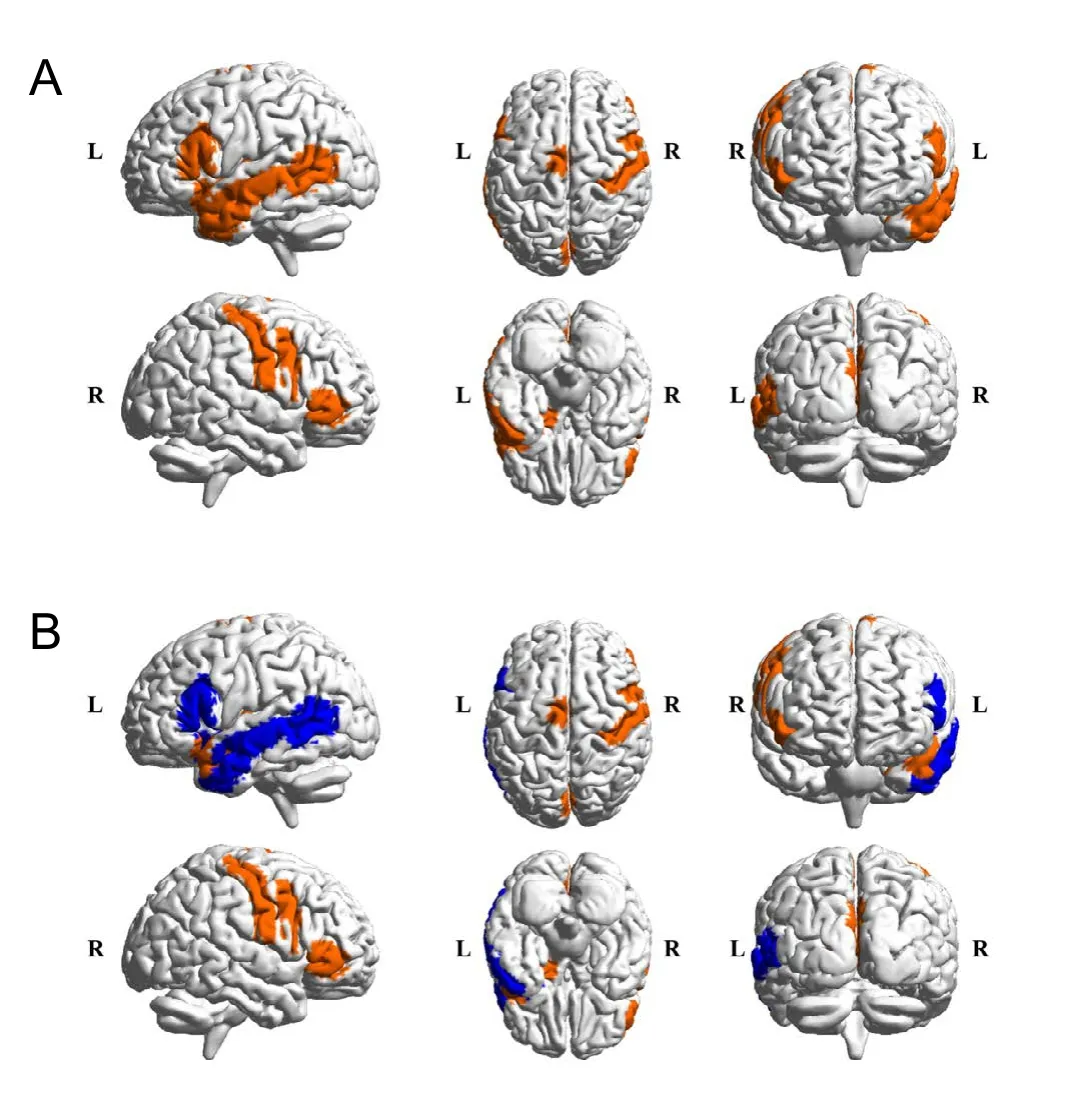
Figure 4 Comparison between identified regions and known regions related to cognitive functions.

Figure 5 e average T1 structural images of each subgroup aer we applied the common anatomical preprocessing steps.
In summary, our study suggested a possible statistical link between ADHD disease status and the brain network for three age groups. The main finding of our study was that connectivity differences in cognitive system could be biomarkers for distinguishing ADHD and TD subjects. It has been shown that behavioral patterns and psychopathology of ADHD patients for different developmental stages are strongly related to impairments of the cognitive system(Blakemore and Choudhury, 2006; Singh et al., 2015; Huang et al., 2016). Huang et al. (2016) found that the impairment of inhibition function which is involved in the cognitive system was significantly different between child ADHD and TD groups, and the difference decreased when subjects develop from children to adolescents.is study suggested that the developmental differences in cognitive functions should be considered to better understand the psychiatric symptoms of ADHD patients. Our results found that the cognitive dysfunction might be associated with age-related brain network changes in ADHD patients, and hence, thus our results might provide complementary information for understanding developmental ADHD psychopathology.ADHD is one of the many brain disorders affected by neuroplasticity and thus our study might be loosely related to neuroplasticity and neural regeneration research (Gevensleben et al., 2014; Cowley et al., 2016; Liu et al., 2017; Van Doren et al., 2017)
Acknowledgments:Data were provided by the Neuro Bureau, the ADHD 200 consortium, and Virginia Tech’s ARC. Data were also provided by the Human Connectome Project, WU-Minn Consortium (Principal Investigators: David Van Essen and KamilUgurbil;1U54MH091657) funded by the 16 NIH Institutes and Centers that support the NIH Blueprint for Neuroscience Research and by the McDonnel Center for Systems Neuroscience at Washington University.
Author contributions:JH and HP designed the study and collected, analyzed, and interpreted the data. BYP reviewed the paper. HHC contributed to the discussion and edited the paper. HP is the guarantor of this work and, as such, had full access to all the data in the study and takes responsibility for the integrity of the data and the accuracy of the data analysis. All authors approved the final version of this paper.
Conflicts of interests: None declared.
Research ethics:e Institutional Review Board (IRB) of Sungkyunkwan University approved our study (#2015-09-007). Our study was performed in full accordance with local IRB guidelines and the principles of the Declaration of Helsinki, and informed consent was obtained from all subjects.
Declaration of participant consent:e authors certify that they have obtained all appropriate consent forms of participant or their guardians. In the form, participants or guardians have given their consent for participants’ images and other clinical information to be reported in the journal. Participants or guardians understand that participants’ names and initials will not be published and due efforts will be made to conceal their identity, but anonymity cannot be guaranteed.
Data sharing statement:Datasets analyzed during the current study are available from the corresponding author on reasonable request.
Plagiarism check: Checked twice by ienticate.
Peer review: Externally peer reviewed.
Open access statement:is is an open access article distributed under the terms of the Creative Commons Attribution-NonCommercial-ShareAlike 3.0 License, which allows others to remix, tweak, and build upon the work non-commercially, as long as the author is credited and the new creations are licensed under identical terms.
Open peer reviewer: Hao Chen, Shanghai 6th Peoples Hospital Affiliated to Shanghai Jiao Tong University School of Medicine, China.
Additional file: Open peer review report 1.
ADHD-200 Consortium (2012)e ADHD-200 Consortium: a model to advance the translational potential of neuroimaging in clinical neuroscience. Front Syst Neurosci 6:62.
American PsychiatricAssociation (1994) Diagnostic and Statistical Manual of Mental Disorders (DSM IV), 4thed.
Anand A, Li Y, Wang Y, Wu J, Gao S, Bukhari L, Mathews VP, Kalnin A,Lowe MJ (2005) Activity and connectivity of brain mood regulating circuit in depression: A functional magnetic resonance study. Biol Psychiatry 57:1079-1088.
Bellec P, Chu C, Chouinard-Decorte F, Benhajali Y, Margulies DS,Craddock RC (2017) The neuro bureau ADHD-200 preprocessed repository. Neuroimage 144(Pt B):275-286.
Blakemore SJ, Choudhury S (2006) Development of the adolescent brain: implications for executive function and social cognition. J Child Psychol Psychiatry 47:296-312.
Bresnahan SM, Barry RJ (2002) Specificity of quantitative EEG analysis in adults with attention deficit hyperactivity disorder. Psychiatry Res 112:133-144.
Bullmore E, Bullmore E, Sporns O, Sporns O (2009) Complex brain networks: graph theoretical analysis of structural and functional systems. Nat Rev Neurosci 10:186-198.
Castellanos FX, Proal E (2012) Large-scale brain systems in ADHD:beyond the prefrontal-striatal model. Trends Cogn Sci 16:17-26.
Castellanos FX, Sonuga-Barke EJ, Milham MP, Tannock R (2006)Characterizing cognition in ADHD: beyond executive dysfunction.Trends Cogn Sci 10:117-123.
Conners CK, Sitarenios G, Parker JD, Epstein JN (1998)e revised Conners’ Parent Rating Scale (CPRS-R): factor structure, reliability,and criterion validity. J Abnorm Child Psychol 26:257-268.
Cortese S, Kelly C, Chabernaud C, Proal E, Di Martino A, Milham MP,Castellanos FX (2012) Toward systems neuroscience of ADHD: a meta-analysis of 55 fMRI studies. Am J Psychiatry 169:1038-1055.
Cowley B, Holmström É, Juurmaa K, Kovarskis L, Krause CM (2016)Computer enabled neuroplasticity treatment: a clinical trial of a novel design for neurofeedback therapy in adult ADHD. Front Hum Neurosci 10:205.
Cox RW (1996) AFNI: software for analysis and visualization of functional magnetic resonance neuroimages. Comput Biomed Res 29:162-173.
Di Martino A, Yan CG, Li Q, Denio E, Castellanos FX, Alaerts K, Anderson JS, Assaf M, Bookheimer SY, Dapretto M, Deen B, Delmonte S, Dinstein I, Ertl-Wagner B, Fair DA, Gallagher L, Kennedy DP,Keown CL, Keysers C, Lainhart JE, et al. (2014)e autism brain imaging data exchange: towards a large-scale evaluation of the intrinsic brain architecture in autism. Mol Psychiatry 19:659-667.
dos Santos Siqueira A, Biazoli Junior CE, Comfort WE, Rohde LA, Sato JR (2014) Abnormal functional resting-state networks in ADHD:graph theory and pattern recognition analysis of fMRI data. Biomed Res Int 2014:380531.
Epstein JN, Johnson DE, Varia IM, Conners CK (2001) Neuropsychological assessment of response inhibition in adults with ADHD. J Clin Exp Neuropsychol 23:362-371.
Fan L, Li H, Zhuo J, Zhang Y, Wang J, Chen L, Yang Z, Chu C, Xie S, Laird AR, Fox PT, Eickhoff SB, Yu C, Jiang T (2016)e human brainnetome atlas: a new brain atlas based on Connectional Architecture. Cereb Cortex 26:3508-3526.
Fennema-Notestine C, Gamst AC, Quinn BT, Pacheco J, Jernigan TL,al L, Buckner R, Killiany R, Blacker D, Dale AM, Fischl B, Dickerson B, Gollub RL (2007) Feasibility of multi-site clinical structural neuroimaging studies of aging using legacy data. Neuroinformatics 5:235-245.
Ferreira LK, Busatto GF (2013) Resting-state functional connectivity in normal brain aging. Neurosci Biobehav Rev 37:384-400.
Fransson P, Aden U, Blennow M, Lagercrantz H (2011)e functional architecture of the infant brain as revealed by resting-state fMRI.Cereb Cortex 21:145-154.
Fujikoshi Y (1993) Two-way ANOVA models with unbalanced data.Discrete Math 116:315-334.
Gevensleben H, Kleemeyer M, Rothenberger LG, Studer P, Flaig-Röhr A, Moll GH, Rothenberger A, Heinrich H (2014) Neurofeedback in ADHD: Further pieces of the puzzle. Brain Topogr 27:20-32.
Goel V, Dolan RJ (2001)e functional anatomy of humor: segregating cognitive and affective components. Nat Neurosci 4:237-238.
HardyMA (1993) Regression with dummy variables. Sage Univ Pap Ser Quant Appl Soc Sci DOI: http://dx.doi.org/10.4135/9781412985628
Huang F, Sun L, Qian Y, Liu L, Ma QG, Yang L, Cheng J, Cao QJ, Su Y,Gao Q, Wu ZM, Li HM, Qian QJ, Wang YF (2016) Cognitive function of children and adolescents with attention deficit hyperactivity disorder and learning difficulties: a developmental perspective. Chin Med J (Engl) 129:1922-1928.
Hurtig T, Ebeling H, Taanila A, Miettunen J, Smalley SL, McGough JJ, Loo SK, Järvelin MR, Moilanen IK (2007) ADHD symptoms and subtypes: relationship between childhood and adolescent symptoms.J Am Acad Child Adolesc Psychiatry 46:1605-1613.
Jenkinson M, Beckmann CF, Behrens TE, Woolrich MW, Smith SM(2012) FSL. Neuroimage 62:782-790.
Knouse LE, Safren SA (2010) Current status of cognitive behavioral therapy for adult attention-deficit hyperactivity disorder. Psychiatr Clin North Am 33:497-509.
Konishi S, Nakajima K, Uchida I, Kikyo H, Kameyama M, Miyashita Y(1999) Common inhibitory mechanism in human inferior prefrontal cortex revealed by event-related functional MRI. Brain 122 (Pt 5):981-991.
Konrad K, Eickhoff SB (2010) Is the ADHD brain wired differently? A review on structural and functional connectivity in attention deficit hyperactivity disorder. Hum Brain Mapp 31:904-916.
Liu ZX, Lishak V, Tannock R, Woltering S (2017) Effects of working memory training on neural correlates of Go/Nogo response control in adults with ADHD: A randomized controlled trial. Neuropsychologia 95:54-72.
Lohmann G, Margulies DS, Horstmann A, Pleger B, Lepsien J, Goldhahn D, Schloegl H, Stumvoll M, Villringer A, Turner R (2010) Eigenvector centrality mapping for analyzing connectivity patterns in fMRI data of the human brain. PLoS One5:e10232.
Mumford JA, Horvath S, Oldham MC, Langfelder P, Geschwind DH,Poldrack RA (2010) Detecting network modules in fMRI time series:a weighted network analysis approach. Neuroimage 52:1465-1476.
Nigg JT (1999)e ADHD response-inhibition deficit as measured by the stop task: replication with DSM-IV combined type, extension,and qualification. J Abnorm Child Psychol 27:393-402.
Park BY, Hong J, Lee SH, Park H (2016) Functional connectivity of child and adolescent attention deficit hyperactivity disorder patients:Correlation with IQ. Front Hum Neurosci 10:565.
Power JD, Barnes KA, Snyder AZ, Schlaggar BL, Petersen SE (2012)Spurious but systematic correlations in functional connectivity MRI networks arise from subject motion. Neuroimage 59:2142-2154.
Rostain AL, Ramsay JR (2006) A combined treatment approach for adults with ADHD--results of an open study of 43 patients. J Atten Disord 10:150-159.
Rubinov M, Sporns O (2010) Complex network measures of brain connectivity: Uses and interpretations. Neuroimage 52:1059-1069.
Sanfilipo MP, Benedict RH, Zivadinov R, Bakshi R (2004) Correction for intracranial volume in analysis of whole brain atrophy in multiple sclerosis: the proportion vs. residual method. Neuroimage 22:1732-1743.
Schneider M, Retz W, Coogan A,ome J, Rösler M (2006) Anatomical and functional brain imaging in adult attention-deficit/hyperactivity disorder (ADHD)--a neurological view. Eur Arch Psychiatry Clin Neurosci 256 Suppl 1:i32-41.
Schwarz AJ, McGonigle J (2011) Negative edges and sothresholding in complex network analysis of resting state functional connectivity data. Neuroimage 55:1132-1146.
Segen JC (2006) Concise Dictionary of Modern Medicine. Mc-Graw-Hill. Available at: https://books.google.co.kr/books?id=vVN-qAAAAMAAJ.
Singh A, Yeh CJ, Verma N, Das AK (2015) Overview of attention deficit hyperactivity disorder in young children. Health Psychol Res 3:2115.
Solanto MV, Marks DJ, Mitchell KJ, Wasserstein J, Kofman MD (2008)Development of a new psychosocial treatment for adult ADHD. J Atten Disord 11:728-736.
Subcommittee on Attention-Deficit/Hyperactivity Disorder; Steering Committee on Quality Improvement and Management, Wolraich M,Brown L, Brown RT, DuPaul G, Earls M, Feldman HM, Ganiats TG,Kaplanek B, Meyer B, Perrin J, Pierce K, Reiff M, Stein MT, Visser S (2011) ADHD: clinical practice guideline for the diagnosis, evaluation, and treatment of attention-deficit/hyperactivity disorder in children and adolescents. Pediatrics 128:1007-1022.
Swick D, Ashley V, Turken AU (2008) Left inferior frontal gyrus is critical for response inhibition. BMC Neurosci 9:102.
Tamm L, Menon V, Ringel J, Reiss AL (2004) Event-related FMRI evidence of frontotemporal involvement in aberrant response inhibition and task switching in attention-deficit/hyperactivity disorder.J Am Acad Child Adolesc Psychiatry 43:1430-1440.
The Mathworks Inc. (2016) MATLAB - MathWorks [WWW Document]. www.mathworks.com/products/matlab. doi:2016-11-26
Tian L, Jiang T, Liang M, Zang Y, He Y, Sui M, Wang Y (2008) Enhanced resting-state brain activities in ADHD patients: a fMRI study. Brain Dev 30:342-348.
Uekermann J, Kraemer M, Abdel-Hamid M, Schimmelmann BG,Hebebrand J, Daum I, Wiltfang J, Kis B (2010) Social cognition in attention-deficit hyperactivity disorder (ADHD). Neurosci Biobehav Rev 34:734-743.
Van Doren J, Heinrich H, Bezold M, Reuter N, Kratz O, Horndasch S,Berking M, Ros T, Gevensleben H, Moll GH, Studer P (2017)eta/beta neurofeedback in children with ADHD: Feasibility of a shortterm setting and plasticity effects. Int J Psychophysiol 112:80-88.
Van Essen DC, Smith SM, Barch DM, Behrens TE, Yacoub E, Ugurbil K; WU-Minn HCP Consortium (2013)e WU-Minn Human Connectome Project: an overview. Neuroimage 80:62-79.
Vandenberghe R, Price C, Wise R, Josephs O, Frackowiak RS (1996)Functional anatomy of a common semantic system for words and pictures. Nature 383:254-256.
Wilens, T.E., McDermott, S.P., Biederman, J., Abrantes, A., Hahesy, A.,Spencer, T.J., 1999. Cognitive therapy in the treatment of adults with ADHD: A systematic chart review of 26 cases. J Cogn Psychother 13:215-226.
Zang YF, He Y, Zhu CZ, Cao QJ, Sui MQ, Liang M, Tian LX, Jiang TZ, Wang YF (2007) Altered baseline brain activity in children with ADHD revealed by resting-state functional MRI. Brain Dev 29:83-91.
*Correspondence to:
Hyunjin Park, Ph.D.,hyunjinp@skku.edu.
orcid:
0000-0001-5681-8918
(Hyunjin Park)
10.4103/1673-5374.217339
Accepted: 2017-09-19
Copyedited by Li CH, Song LP, Zhao M
杂志排行

中国神经再生研究(英文版)的其它文章
- Matrix bound vesicles and miRNA cargoes are bioactive factors within extracellular matrix bioscaffolds
- Diffusion tensor tractography studies on mechanisms of recovery of injured fornix
- Using 3D bioprinting to produce mini-brain
- Beta secretase activity in peripheral nerve regeneration
- Embracing oligodendrocyte diversity in the context of perinatal injury
- On the road towards the global analysis of human synapses