Large eddy simulation of turbulent flow structure and characteristics in an annular jet pump*
2017-09-15MaosenXu徐茂森XuelongYang杨雪龙XinpingLong龙新平Qiao吕桥
Mao-sen Xu (徐茂森), Xue-long Yang (杨雪龙), Xin-ping Long (龙新平), Qiao Lü(吕桥)
1.HubeiKey Laboratory for Waterjet Theory and New Technology, Wuhan University, Wuhan 430072, China
2.School of Power and Mechanical Engineering, Wuhan University, Wuhan 430072, China, E-mail: xumaosen@whu.edu.cn
3.Research Institute of Nuclear Power Operation, Wuhan 430074, China
Large eddy simulation of turbulent flow structure and characteristics in an annular jet pump*
Mao-sen Xu (徐茂森)1,2, Xue-long Yang (杨雪龙)3, Xin-ping Long (龙新平)1,2, Qiao Lü(吕桥)1,2
1.HubeiKey Laboratory for Waterjet Theory and New Technology, Wuhan University, Wuhan 430072, China
2.School of Power and Mechanical Engineering, Wuhan University, Wuhan 430072, China, E-mail: xumaosen@whu.edu.cn
3.Research Institute of Nuclear Power Operation, Wuhan 430074, China
The large eddy simulation(LES) of the flow characteristics in an annular jet pump (AJP) is conducted, and the flow characteristics are systematically analyzed from both time-averaged and instantaneous aspects. The jet expansion, the velocity distribution and the energy are considered to analyze the time-averaged evolution of the flow field in the AJP. The transient flow characteristics can also be acquired from the analysis of the turbulence intensity and the Reynolds stress. The simulation demonstrates that in the time-averaged characteristics, the potential cores increase linearly with the increase of the flow ratio. With the flow development, the jet half-width gradually increases and the residual energy coefficient decreases. Compared with the distribution of the time-averaged axial velocity, that of the instantaneous velocity is more complex and disorderly. The high intensity of the axial turbulence mainly occurs in the mixing layer and the near-wall regions of the diffuser. The annular distribution of the Reynolds stress is mainly in the mixing layer and the recirculation region. There is a low-stress zone between the mixing layer and the high-stress region in the wall-boundary layer. The intensity of the spanwise vortexes is larger than that of the streamwise vortexes, and therefore, the former make greater contribution to the total vorticity. This research provides a better understanding of the flow characteristics in the AJP.
Annular jet pump, large eddy simulation(LES), flow characteristics, vortex
Introduction
The jet pump is applied in several situations for its simple structure without rotating parts and for its reliable operation. Its operation principle can be simply described as transferring the momentum from the primary to secondary flows. According to the nozzle position, the jet pump can be classified into two types: the central jet pump (CJP) and the annular jet pump (AJP). Compared with the CJP, the broad flow passage of the AJP offers numerous potential applications in the solid particle conveyance, such as for potatoes, capsules and even living fish[1,2].
In the past decades, the experiment has been animportant tool to study the AJP. Shimizu et al.[3]investigated the impact of structure parameters and swirl components on the performance of the AJP. Elger et al.[4]introduced the momentum ratioJas a dimensionless parameter to evaluate the recirculation region in the AJP. Duan and Sun[5]studied the influence of compositional parameters on the performance of the AJP with a multi-nozzle. Xiao et al.[6]analyzed the cavitation performance, the inception and the development at the throat inlet and the shedding of the cavity cloud in the diffuser. They[7]also used a high-speed visualization method to study the cavitation in the AJP and captured recirculation regions in the shear layer and three types of cavity clouds.
With the development of the CFD, numerical methods are used gradually in the AJP research, along with experimental methods. Xiao et al.[8]investigated the appearance, the shape and the position of the recirculation regions in the AJP. Yang et al.[9]designed a trumpet-shaped diffuser to improve the performance ofthe AJP and analyzed the flow details.
In the recent numerical studies, the RANS model is widely used in the AJP simulation. Yet a more advanced simulation method, the large eddy simulation (LES), is rarely used in the AJP studies. The selection of an appropriate turbulence model is the crucial issue for an accurate simulation. Compared with the Reynolds averaged Navier-Stokes (RANS) model, the LES method is more suitable to capture the flow details and to study the internal flows[10-14]. The LES is a prediction method for large-scale turbulence flows. The large eddies in the energy-containing region and the small eddies in the dissipation region are solved separately. The former are directly solved by the Navier-Stokes equation and the latter are solved based on the relationship between a sub-grid model and a large eddy. The LES reduces the prediction errors caused by the inaccuracy of turbulence modeling, because the large-scale turbulent fluctuation consumes 80% of the turbulent kinetic energy. Therefore, compared with the RANS, the LES can give a more accurate calculation result and is more suitable for studies of mechanism. Luo et al.[15]used the LES to simulate the unsteady cavity shedding from a twisted hydrofoil and they[16]predicted behaviors of the cavitation shedding dynamics, including the cavity growth, the break-off and the collapse downstream.
The operation of the AJP is simple. However, the mixing of the primary and secondary flows is a severe energy-momentum exchange process, including several complex turbulent phenomena, such as the shear flow and the recirculation. Limited researches have captured the flow characteristics of the AJP, mostly without combining them with their mechanisms systematically. A series of studies focused on the performance improvement and the structural optimization of the AJP. However, very few scholars pay attention to the internal flow and relate it with the external characteristics. Therefore, based on the LES method, the present paper investigates the flow characteristics in the AJP. The jet expansion is described by the potential core length and the jet half-width. Meanwhile, a residual energy coefficientξis proposed to analyze the change of the total energy. The vorticity distributions, including the total streamwise and spanwise vorticities, are also discussed. Moreover, the turbulence intensity distribution and the Reynolds stress distribution are obtained from the numerical results to analyze the flow mechanisms in the AJP.
1. Research strategy
1.1 AJP structure
The AJP mainly comprises of a suction duct, an annular nozzle, a suction chamber, a throat and a diffuser (Fig.1). The primary flow with a high pressure accelerates through the annular nozzle and has an entrainment effect on the secondary flow. These two flows mix in the suction chamber and the throat and then flow out via the diffuser with a rise of pressure. According to our previous studies of the structural optimization[9], the main structural parameters are set as follows:Ds=50 mm ,Dd=80 mm ,Dt=40 mm ,Lt=120 mm ,α=20oandβ=6o. The area ratiomis an important parameter for the AJP and is defined as follows

whereAthandAjare the cross-sectional areas of the throat and the annular nozzle,Dinneris the outer diameter of the annular tip andDouteris the inner diameter of the suction chamber. In the present paper, the AJP withm=1.72 is considered. Other parameters, such as the flow ratioq, the pressure ratiohand the pump efficiencyη, are defined as follows:
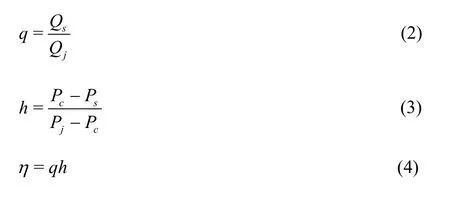
whereQsis the secondary volumetric flow rate,Qjis the primary volumetric flow rate,Pcis the total pressure of the mixed flow,Psis the total pressure of the secondary flow andPjis the total pressure of the primary flow.
1.2 Numerical method
In the simulation, the AJP is simplified as an axial symmetry model. The computational domain and the local mesh are shown in Fig.2. To ensure the calculation stability, both the suction and outlet duct lengths are set five times as long as their diameter lengths, respectively. The original point is located at the circle center of the cross-section of the throat inlet. Thex-axis is along the flow direction and they-zplane is perpendicular to thex-axis. The suction chamber profile grids and 1/4 of the cross-section grids at the nozzle in Fig.2 indicate that the grids near the axis are sparse, where the velocity gradient is small.
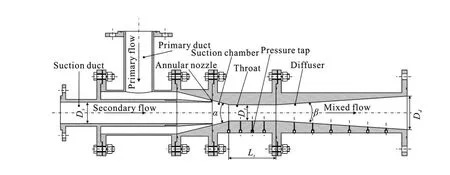
Fig.1 Schematic diagram of AJP
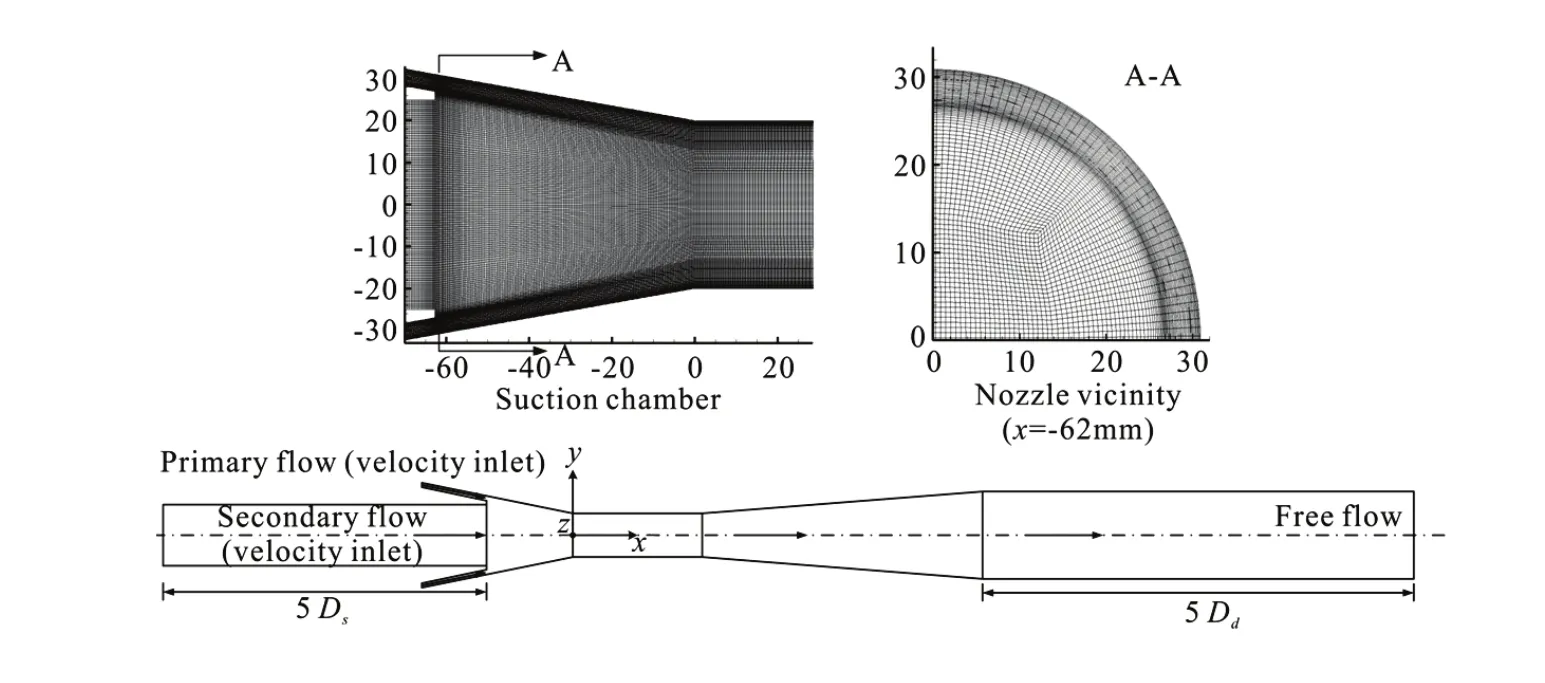
Fig.2 Computational domain and local mesh

Table 1 Grid number
However, those in the boundary and mixing layers, where a great velocity gradient is expected, are dense. The meshes used in the commercial code ANSYS ICEM are all structural hexahedral elements. After the grid independence tests[17], the final mesh has 1.172× 10⁷elements. The grid number of each part is shown in Table 1.
According to the requirements of the inertial subrange and the wall equilibrium stress model, the gridis adjusted around unity in the present paper.
As for the boundary conditions, the two inlets are set as the velocity inlets and the outlet is set as the free flow. The rate of the primary flow keeps 10 kg/s unchanged and the rate of the secondary flow varies to adjustq. The remained boundaries are walls. Though the effect of the initial condition on the numerical results can disappear after a long enough iteration time, the steady RANS computational results are adopted as the initial flow field for the LES under corresponding operation conditions to reach a steady state in the statistical significance immediately. The time step is set as 10-5s and with 20 iterative times in each time step to ensure the residual convergence of the continuity to be reached at 10-4s.
The transient-governing equation is discretized by the FVM, the second-order implicit algorithm is used for the time integration, the PISO algorithm is used to deal with the coupling of the velocity field with the pressure field; the convection term is discretized by the QUICK scheme; the pressure term is discretized by the PRESTO scheme. The numerical results of the Smagorinsky sub-grid scale (S-SGS) model with different coefficientsCsand the dynamic sub-grid scale (D-SGS) model are compared with the experiment results. The erroreis defined as follows

where LES is the AJP efficiency based on the numeri-cal simulation result and Exp. is the AJP efficiency according to the experiment result. As shown in Table 2, the AJP efficiency obtained by the numerical simulation results is higher than that based on the experiment results. The result of the S-SGS model withCs=0.25 is close to the experiment result, so it is chosen in the present paper.

Table 2 The calculation error of SGS models
The data acquisition time or period is usually measured by the through-flow timeTfand is defined as the quotient of the computational domain length and the mean bulk velocity. However, the mean bulk velocities are different in some parts of the AJP, because the sectional areas are different in those parts. The primary study regions include the suction chamber, the throat and the diffuser. Thus,Tfin the AJP can be obtained by the sum of the through-flow times in those three parts. It usually takes 5Tfto 10Tfto reach a statistical stability and then 5Tfto 100Tfto finish the data acquisition. However, because the steady RANS result is considered as the initial flow field, the time to reach a stability might be shorter. Therefore, to avoid the effect of the initial condition on the statistical result, the data acquisition begins after 5Tfand the collection time is 10Tf.
1.3 Simulation validation
The CFD results are validated against the experimental data by comparing with the variations ofηandhversusqas shown in Fig.3. The simulated results ofη-qandh-qcurves coincide well with the experimental data. However, the experimental performance is a little inferior than the simulated performance, because the friction loss caused by the rough wall is ignored in the simulation. Also, a local loss possibly occurs at the connection of the throat and the diffuser in the experimental model pump. The wall pressure coefficientCpis also used to validate the simulation and it is defined as follows

wherepxis the wall pressure,psis the secondary flow pressure at the annular nozzle,ρis the water density andUpis the primary flow velocity at the annular nozzle. Based on theCpdistribution, one sees little difference between the experiment and the simulation. This coincidence degree is higher for largerq.
The contours of the pressure coefficients (q=0.4) are shown in Fig.4. The pressure coefficient along the radial direction assumes a uniform distribution.
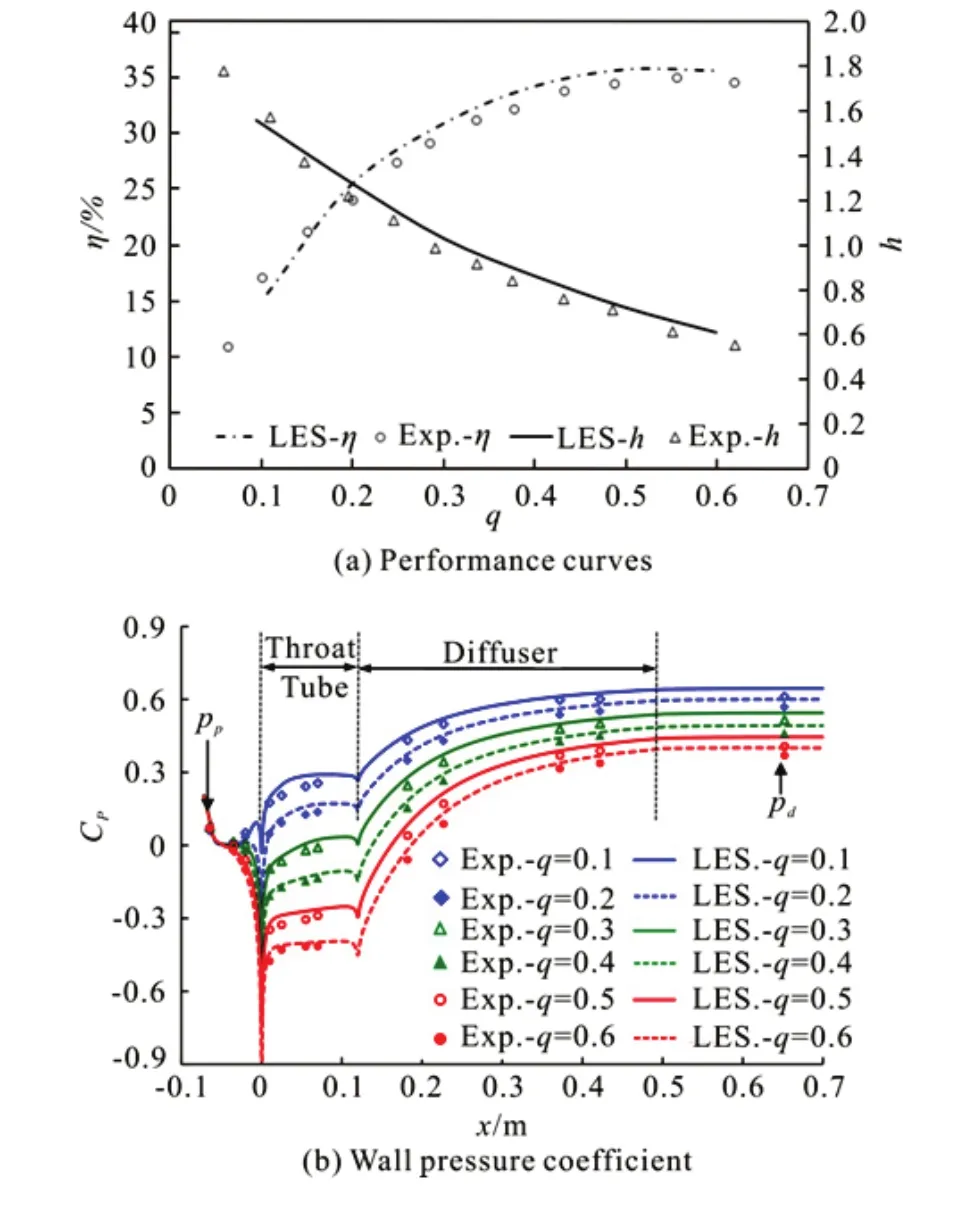
Fig.3 (Color online) Simulation validation

Fig.4 (Color online) Contours of pressure coefficients
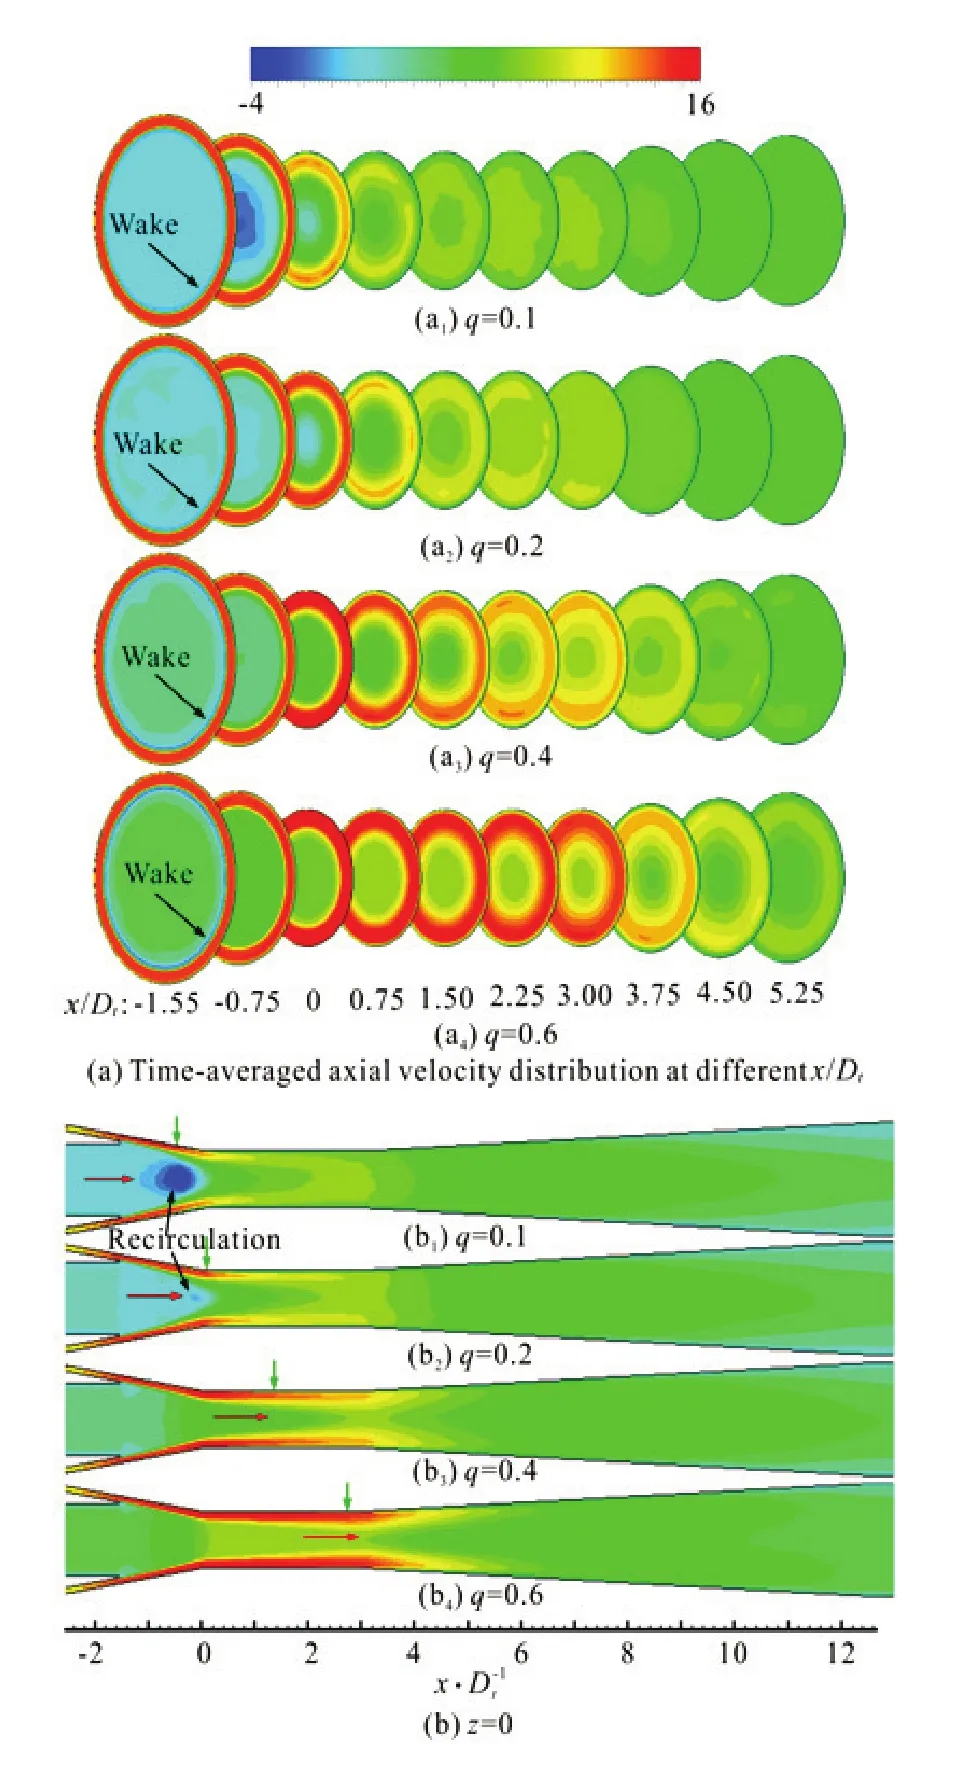
Fig.5 (Color online) Distribution of time-averaged axial velocities in AJP
2. Results and discussions
2.1 Time-averaged flow characteristics
2.1.1 Velocity distribution
After jetting out from the annular nozzle, the high-speed primary flow runs downstream and gradually expands toward the axis. The primary and secondary flows finish mixing at the throat exit or the diffuser inlet and then the velocity decreases with the pressure increase in the diffuser. The primary flow remains at a high speed and can reach the maximum. Figure 4(a) indicates the distribution of the timeaveraged axial velocityUfor differentq. In this figure,x/Dt=0 is the position of the throat inlet, wherexis the axial position. The red arrow points the annular mixing layer position of the two flows or the separation position of the recirculation region. The green arrow indicates the mixing position of the annular mixing layer and the wall-boundary layer.
Figure 5(a) shows that the time-averaged velocities at differentx/Dtare symmetrically distributed. For smallq(q=0.1 andq=0.2), there is a recirculation region in the suction chamber and it becomes more obvious with the decrease ofq. Most timeaveraged flow field regions are quite smooth, except for the recirculation region with an irregular outline, showing the complexity of the flow in this region. With the internal flow development, the primary and secondary flows sufficiently mix together and the velocity distribution becomes homogeneous gradually. The primary flow velocity for largeq(q=0.4 or 0.6) increases firstly and then decreases. Besides, the wake produced by the thickness of the nozzle is captured atx/Dt=-1.55.
The distribution of the dimensionless time-averaged axial velocityU/Upalong the radial direction is shown in Fig.6(a) (U/Upas the abscissa andy/Ras the ordinate), whereUpis the axial velocity of the primary flow at the nozzle,yis the radial position andRis the radius at different axial positions. Because the axial velocity is in a symmetrical distribution, only the upper half is shown in Fig.6(a).
Forq=0.2, the axial velocity of the primary flow remains unchanged in the regionx/Dt≤-0.25 and then decreases in the throat (0≤x/Dt≤3), forq=0.6, the axial velocity of the primary flow increases in the regionx/Dt≤0.25, but decreases in the regionx/Dt≥0.75, forq=0.2,Umaxgradually deflects toward the axis in the regionx/Dt≤0.75, and forq=0.6,Umaxgradually deflects toward the axis in the regionx/Dt≤1.5. Therefore, with the increase ofq, the high-axial velocity region of the primary flow enlarges andUmaxincreases.

Fig.6 (Color online) Distribution of time-averaged velocitiesalong radial direction
The distribution of the time-averaged radial velocity for differentqis shown in Fig.6(b). Different fromU/Up,V/Uphas a non-symmetrical distribution and its value is relatively small (about one fifth ofU/Up). In the suction chamber, the absolute value ofV/Upis relatively large with a little variation because of the shrinkage structure. Yet in the throat, the absolute value ofV/Upis relatively small with a downtrend until the mixed flow runs into the diffuser. Due to the diffuser structure,V/Upchanges from a positive value to a negative value. Except for the recirculation region, the radial velocities are in the direction of the axis in the suction chamber and the throat and they increase at the axis according to the mass conservation. On the contrary, they decrease at the axis in the diffuser where they move away from the axis. Due to the increase ofq,V/Upbecomes less in the throat, indicating that the primary flow expands inward more slowly.
2.1.2 Jet expansion
The present paper defines a potential core lengthl(the length from the nozzle exit to the endpoint, where the value of the speed changes into the value at the nozzle exit again). The endpoints are shown in Fig.5(b) such as the mixing position of the primary and secondary flows, the position of the recirculation separation pointed by a red arrow and the mixing position of the mixing and boundary layers pointed by a green arrow. According to this definition, the primary flow potential core lengthlpand the secondary flow potential core lengthlscan be obtained.

Fig.7 Potential core
When the condition of the recirculation operation is not satisfied, the secondary flow potential core can expand into the throat or even the diffuser. The speed increases firstly and then decreases, affected by the acceleration of the primary flow and the adverse pressure gradients. Different from the potential core of the submerged jets, the potential core length of the primary flow in the AJP increases approximately linearly with the increase ofq(Fig.7).
In the AJP, the primary flow is the wall jet and the secondary flow is the compound flow. Thereby, the internal flow in the AJP can be considered as a confined annular compound wall jet. The trend of the jet half-widthy1/2can be divided into two parts: one in the suction chamber and another in the throat (Fig.8(a)). With the development of the internal flow,y1/2generally increases, showing that the jet expandstoward the axis. For differentq,y1/2increases approximately linearly and it grows more rapidly for smallerq. Different fromym, the relation between the increase rate of the boundary-layer width andqseems weaker in the suction chamber. However, the width of the boundary layer increases and its increase rate is higher in the throat (Fig.8(b)). Fig.8(c) illustrates that the increase rate of the jet half-width is larger than that of the boundary layer, except in the case ofq=0.1.
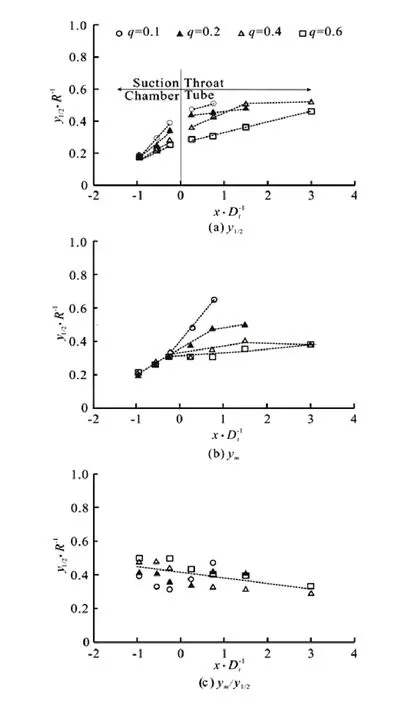
Fig.8 Jet half-width and boundary layer width
2.1.3 Total pressure distribution
For the incompressible fluid without heat transmission, the energy of the flow comes from the mechanical energy. According to the Bernoulli equation, the fluid mechanical energy, denoted by the total pressureP, consists of the pressure and kinetic energies, with the potential energy ignored. Because the kinetic energy at each cross section is mainly the kinetic energy along the flow direction,Pis defined in the present paper as

Thereby, the mass-averaged total pressurePis defined as

whereAis the section area,visthe velocity vector,ρis the fluid density and is the unit vector normal to the surface. Moreover, the residual energy coefficientξis also defined as


Fig.9 Residual energy coefficients
where the subscript ofxis for different axis positions, and it is 0 at the nozzle exit andcat the AJP exit. Figure 9 shows the variations ofξ. There are some fluctuations in the curves because the kinetic pressures produced by the radial and circumferential velocities are not included inPbut the conversion of veloci- ties towards three directions may happen. Overally,ξis in a downtrend with the flow development downstream. For a smallq, the energy loss mainly happens in the suction chamber (x/Dt<0) and even in the recirculation region,ξmay be found to be less than 0.ξdecreases at a relatively slow rate for a largeq. The energy loss mainly consists of the following four parts: the mixing loss between the primary and secondary flows, the wall friction loss, the recirculation loss and the diffusion loss in the diffuser. Different proportions of these losses lead to the energy loss diversity for differentq. The recirculation can be avoided under proper operation conditions. The diffusion loss can bereduced by setting a reasonable diffusion angle. The reduced velocity difference between the primary and secondary flows can decrease the mixing loss. The wall friction loss cannot be avoided, but can be decreased by shortening the length of the AJP.
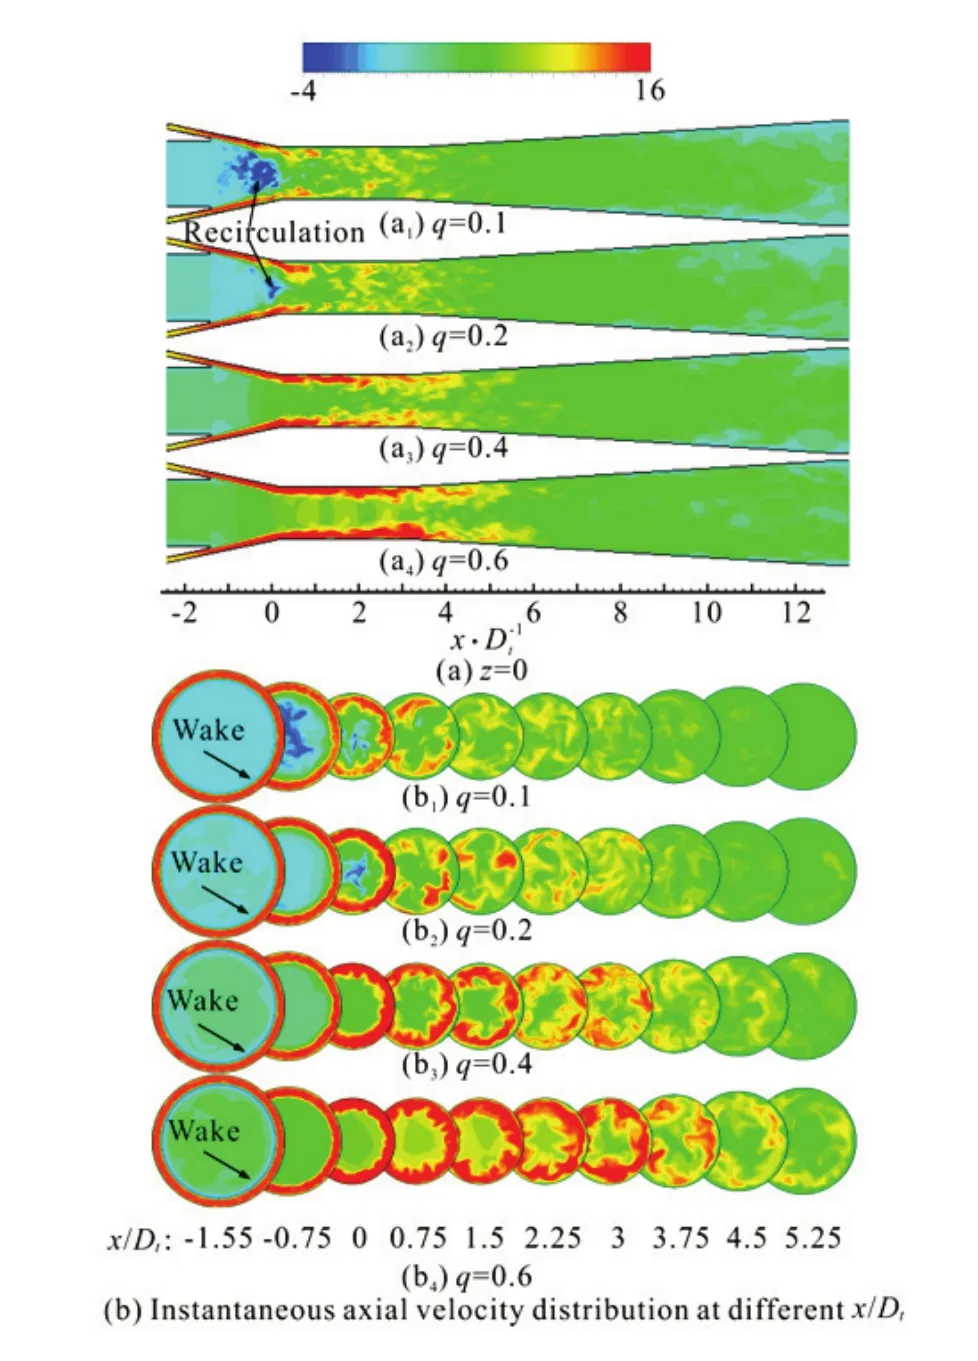
Fig.10 (Color online) Instantaneous axial velocity distributions (t=1.0s)
2.2 Turbulent flow characteristics
2.2.1 Instantaneous velocity distribution
Figure 10(a) shows the distribution of the instantaneous axial velocityu. Compared with the distribution of the time-averaged axial velocity (Fig.5(a)), that of the instantaneous velocity is more complex and disorderly. The primary flow sees fluctuation characteristics, with a discontinuous high speed region. An obvious recirculation region (u≤0) can be found in the suction chamber for smallq(q=0.1 or 0.2), where one sees a mixing process of the two flows. However, this process occurs in the throat without any recirculation region for largerq. With the increase ofq, the span of the high-speed region (red region) becomes longer. The wake effect, produced by the thickness of the nozzle, is captured at the position ofx/Dt=-1.55 (Fig.10(b)). With the flow development, the boundary of the primary and secondary flows becomes rough and staggered due to the mixing process. In the circumferential direction, the primary flow is in a discrete state and shows a strong 3-D characteristic. The axial velocity of the primary flow increases from about 14 m/s at the nozzle exit to about 16 m/s.
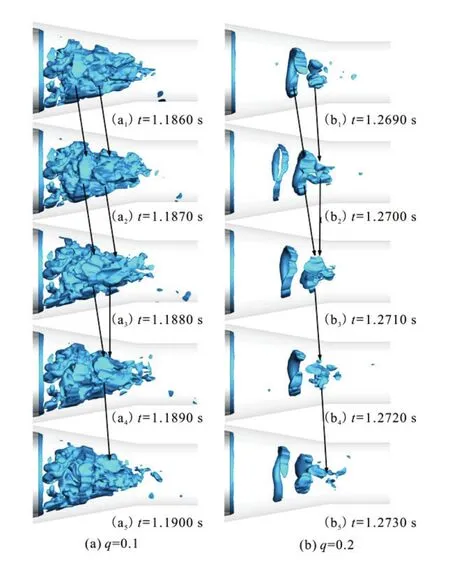
Fig.11 (Color online) Instantaneous recirculation regions (u≤-0.01m/s)
2.2.2 Turbulence intensity distribution
The turbulence intensity is an important index to describe the flow characteristics. Considering the longitudinal profile and the fact that the time-averaged radial velocityVand the time-averaged transverse velocityWcan be 0 at the axis, the time-averagedaxial velocityUis considered as the scale for the intensities of the radial and transverse turbulences to compare with the intensity of the axial turbulence. Based on the flow directions, the turbulence intensities are defined as follows:
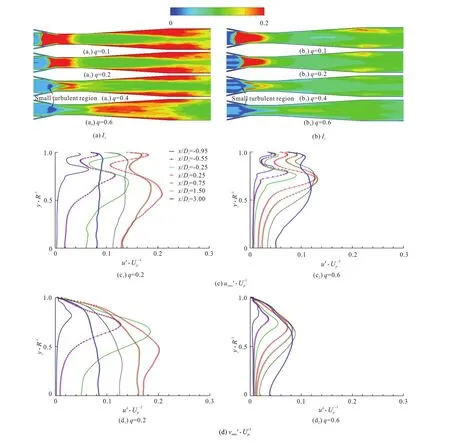
Fig.12 (Color online) Distributions of turbulence intensity


As shown in Fig.12(a), the axial high-turbulence intensity mainly occurs in the mixing layer and the near-wall regions of the diffuser. At the primary and secondary flow inlets,Ixis about 0.04 and there is a small turbulent region (Ix≤0.02) in the potential coreof the secondary flow for largeq(q≥0.4). With the increase ofq, both the potential cores of the primary and secondary flows increase and this small turbulent region also expands. For smallq, there are large turbulent regions (Ix≥0.02) in the suction chamber. Due to the recirculation region in the suction chamber, where the axial velocity is small and the turbulence velocity is large,Ixincreases. The rise ofqleads to the disappearance of the recirculation region and the highIxregion moves downstream. In the case ofq=0.6, the highIxregion moves into the diffuser.
Due to the similarity betweenIyandIz, the present study analyzesIyand its distribution (Fig.12(b)). For smallq(q≤0.2), there are highIyregions in the suction chamber because of recirculation regions, where the axial velocity is small but the radial turbulent velocity is large. With the increase ofq, the recirculation region disappears. Meanwhile, the highIyregion diminishes and moves into the diffuser forq=0.6. In addition, the highIyat the diffuser exit drops with the rise ofq. Similar toIx, a small turbulent region (Iy≤0.02) exists in the potential core of the secondary flow for largeq(q≥0.4). With the increase ofq, the lengths of the primary and secondary flow potential cores increase and the small turbulent region also expands.
Considering that the axial turbulence intensity is in the symmetrical distribution, only the upper part ofis discussed (Fig.12(c)). There are four peaks and three valleys. Compared with Fig.5(b), the peaks are on the boundary and the mixing layers and the valleys appear in the potential cores of the primary and secondary flows. With the expansion of the boundary and mixing layers, the peaks and valleys gradually move toward the axis. This movement is shown as a trend of a rise firstly and then of a drop and the turning point of this trend appears later for largerq. Peak values in the mixing layer are larger than those in the boundary layer before fully mixing. Both peak and valley values decrease with the increase ofq.
Different from thedistribution, merely two peaks are in the mixing layer and the valley is in the axial potential core in thedistribution (Fig.12(d)). In addition, there are no obvious peaks or valleys in the boundary layer or the potential core of the primary flow. However, the trend of the movement of the peak ofis similar to that of, indicating that there is a lower peak for largerq.
你知道明星跟路人合照常常遭遇什么悲惨的处境吗?就是合照之后,当我们要离开的时候,常常会被叫住说:“不行,再拍一张。”
2.2.3 Reynolds stress distribution
The Reynolds stress comes from the inhomogeneity of the flow field and represents the effect of the turbulent fluctuation on the time-averaged flow. In the Reynolds stress,denotes the correlation degree of different turbulence velocity components in the same position, which can be expressed as

where the components along the diagonal are the normal stress terms and the others are the shear stress terms. The bar above each term is omitted for a succinct expression in the following discussion.Upis treated as the scale to describe the radial distribution of the dimensionless shear stress(Fig.13(a)). Due to the symmetry, there are four peaks in the boundary and the mixing layers and two valleys in the potential core of the primary flow in thedistribution, which is similar to the distribution of. With the expansion of the boundary and mixing layers, both peaks and valleys gradually move toward the axis. This movement is shown as a trend of a rise firstly and then of a drop. The turning point of this trend appears later for largerq. Before fully mixing, the peak value in the mixing layer is larger than that in the boundary layer. Both the peak and valley values decrease with the increase ofq.
Shear stressτcan be obtained by combiningwith, which is shown as follows

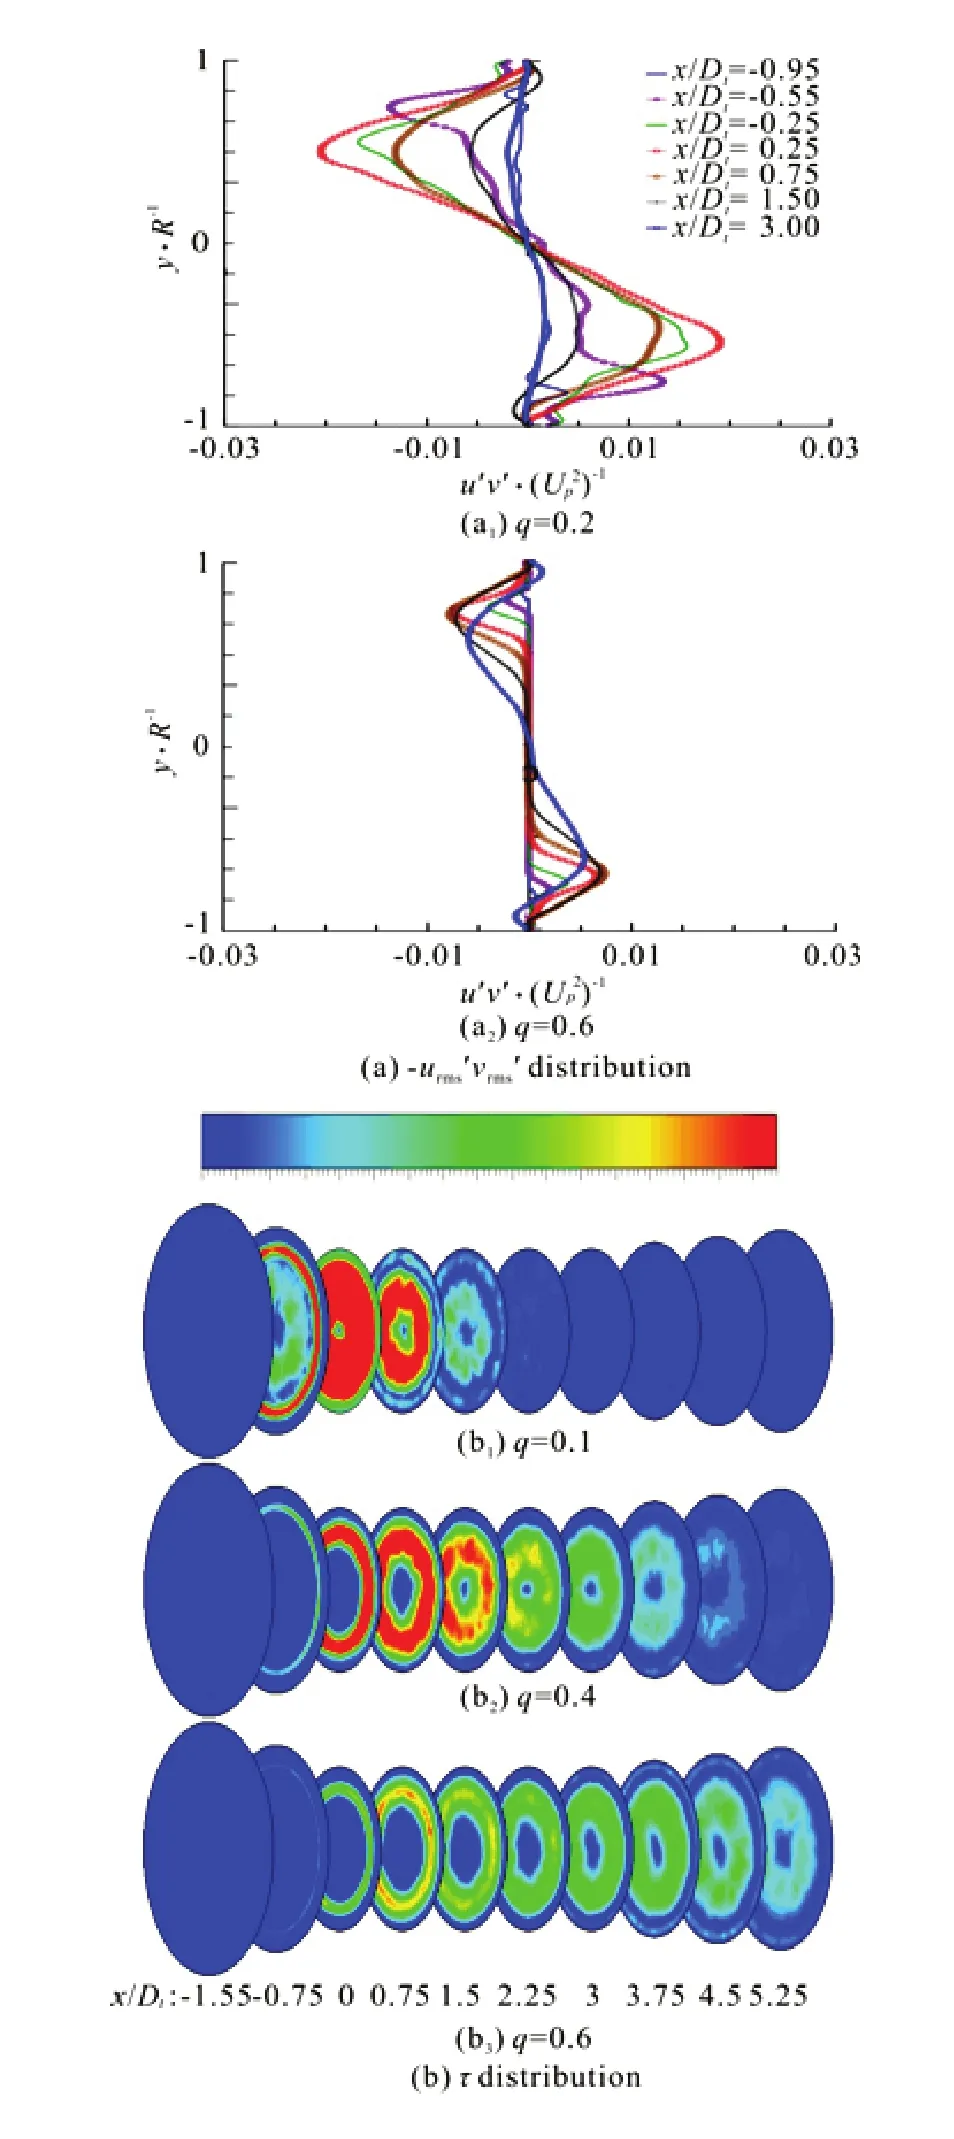
Fig.13 (Color online) Reynolds stress distributions
Annular distribution ofτis mainly in the mixing layer and the recirculation region (Fig.13(b)). Along the flow direction, the maximum in each section displays a trend of increase firstly and then of decrease. For largerq, the distribution ofτbecomes smoother and the region span is larger. Forq=0.1,τintensity gradually decreases and its region also shrinks after the mixing of the recircu- lation and largeτregion in the mixing layer. However, there is a largeτin the wall-boundary layer at the throat inlet (x/Dt=0) and its region gradually expands with the decrease of its intensity. There is a low-stress zone (τ≈0) between the mixing layer and the largeτregion in the wall-boundary layer. For largeq(q=0.4, 0.6), the largeτregion in the mixing layer gradually expands to a stable state with the drop of the intensity. However, theτregion in the boundary layer of the throat wall gradually expands, while the intensity increases at firstly and then decreases. The shear stressτis close to 0 near the axis, which indicates a low turbulence correlation of the velocity near the axis.
2.2.4 Vorticity distribution
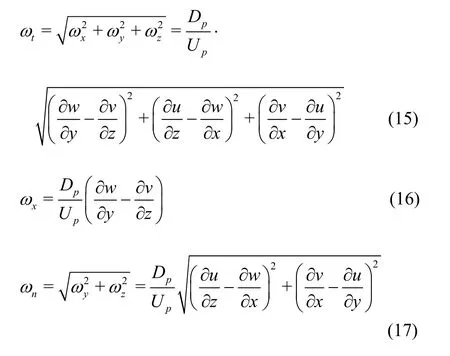
The vortex core is a vorticity concentration region in a vortex. Therefore, numerous scholars use the vorticity as a tool to identify the vortexes[18-20]. The total vorticityωt, the streamwise vorticityωxand the spanwise vorticityωnare defined as follows[21]:
A red and a green arrows point out the lengths of the potential core (lpandls) in Fig.14(a). The vorticity mainly distributes in the mixing and wallboundary layers as well as the recirculation region, where the velocity gradients are great. The secondary flow velocity increases with the rise ofq, resulting in a drop of the velocity gradient between velocities of the primary and secondary flows. Therefore, the decreased vorticity intensity leads to an increase ofandls. These two flows evenly mix downstream with a decrease of the velocity gradient. Thereby, the vorticity intensity gradually decreases in a sparse distribution and finally finishes the dissipation. Mainly produced by the shear flow, the vorticity intensity near the suction chamber wall is evenly distributed. Yet the vorticity intensity near the throat wall, induced by the vortex movement, shows an obvious fluctuation.
Figure 14(b) shows the instantaneous distribution of the total vorticity at different times. The mixing layer near the nozzle exit grows slowly and evenly. However, with the rise of disturbance, it is gradually affected by a nonlinear effect until a saturation state is reached. Then, periodically arrayed vortex structuresappear and their intensity gradually increases in the same rotation direction. Though the wall-boundary layers in the suction chamber and the mixing layer are separated by the primary flow, some periodically arrayed vortex structures, indirectly compressed by the vortexes in the mixing layer, also occur in the boundary layer. They are in the same vortex direction with those in the mixing layer. The vortex structures in the mixing and boundary layers gradually grow and even break. They rapidly integrate and dissipate in the rear end of the throat and the front end of the diffuser. Both the potential cores of the primary and secondary flows are affected by the vortex structures. Due to a narrow radial space, the primary flow is affected by the vortex development in the mixing and boundary layers, shown as a cyclic swing along the radial direction. When the vortexes in the mixing layer are combined with those in the boundary layer, the potential cores disappear. The potential core region of the secondary flow is wide and has a strong anti-interference ability. However, it gradually becomes narrow and its rear end also swings with the erosion of the vortex structures.
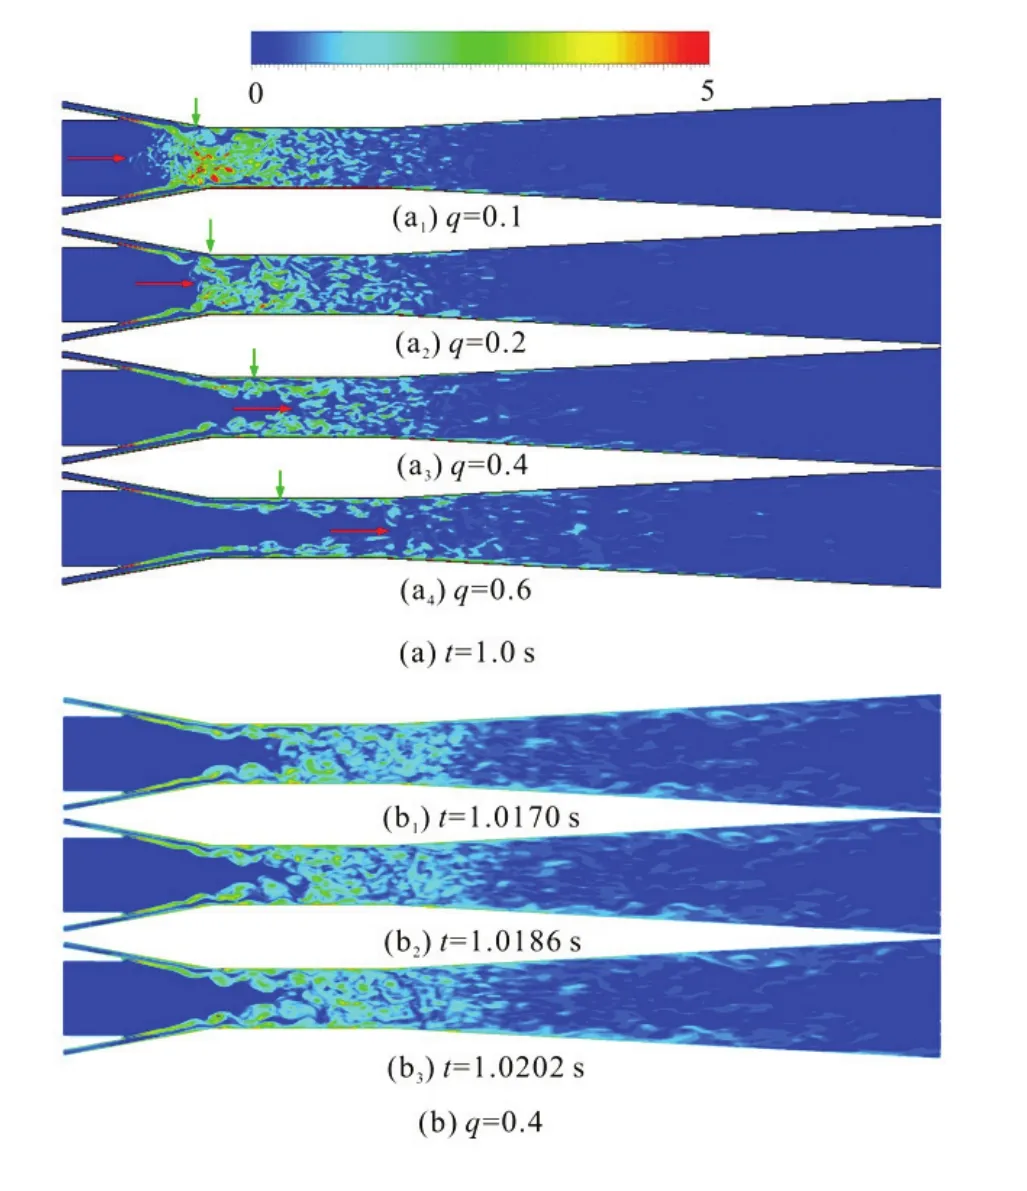
Fig.14 (Color online) Distributions of instantaneous total vortici-
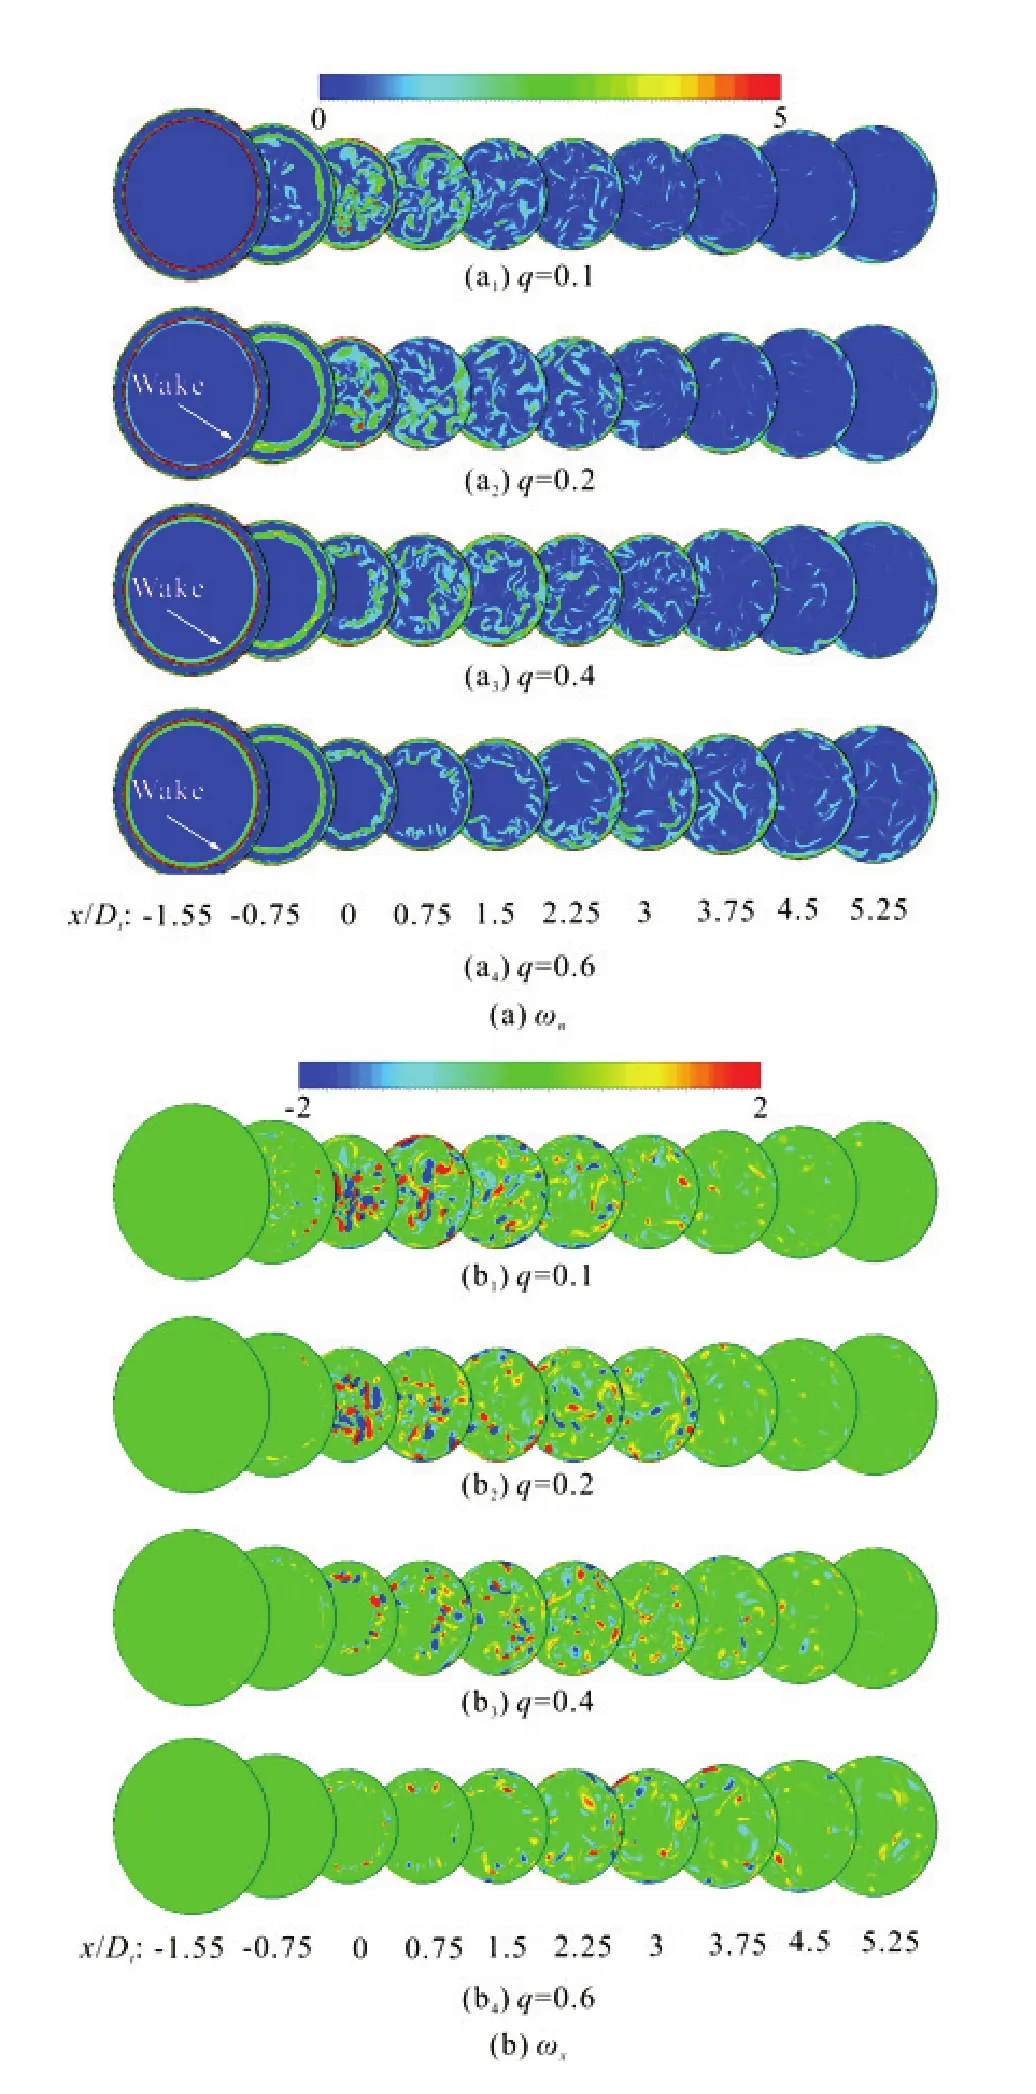
Fig.15 (Color online) Distributions of instantaneous vorticity (m=1.72,t=1.0s)
The spanwise vortexes are generated by the Kelvin-Helmholtz instability. The maximum spanwise vorticity occurs at the nozzle exit (Fig.15(a)). Intensity of spanwise vortex gradually decreases and then disappears out of the boundary layer. However, a high-velocity gradient results in the existence of spanwise vortexes in the boundary layer. Spanwise vortexes in the wake increases with the rise ofqand mixes with those in the mixing layer soon. In a short distance from the nozzle exit, the shape of spanwise vortexes remains the same with those at the nozzle exit, shown as an annular shape firstly and then changing into a complex shape. Forq≥0.6, without recirculation disturbances, spanwise vortexes expand slowly towards the wall and show a diverse and complete shape. However, extruded by the wall of suction chamber, spanwise vortexes form a petal-likeshape (x/Dt=0.75) and show a strong 3-D characteristics. Intensity of spanwise vortexes decrease. Their shapes finally break and disappear. Forq=0.1, some spanwise vortexes, with a complex shape and a disordered distribution, occur in the recirculation region. These spanwise vortexes mix with those in the mixing layer in the region of -0.75≤x/Dt≤0. Then, they mix with those in the boundary layer when they expand toward the wall (1.5≤x/Dt). Forq=0.2, though the recirculation region is small, spanwise vortexes twist and break at the nozzle inlet (x/Dt=0). Therefore, they do not keep an annular shape any more. However, they can keep an annular shape at the nozzle inlet forq≥0.4, indicating that the recirculation region strongly affects the shape of spanwise vortexes.
Similar to the spanwise vortexes, the streamwise vortexes mainly distribute in the mixing and the wall-boundary layers as well as the recirculation region (Fig.15(b)). With the increase ofq, the maximum streamwise vorticity decreases. Due to the azimuthal instability, the streamwise vortexes are formed and always in pairs. Compared with the spanwise vortexes, both the intensity and the size of the streamwise vortexes are smaller at the nozzle. However, the streamwise vorticity gradually increases and grows in size. Then it diffuses into the entire flow field from the mixing layer. When the intensity of the spanwise vorticity decreases and even disappears, the streamwise vorticity intensity remains at a high level.
3. Conclusions
The present paper analyzes the flow characteristics in the AJP from both the time-averaged and turbulent flow characteristics. Conclusions are as follows:
(1) With the increase ofq, both the potential cores of the primary and secondary flows increase linearly. With the flow development, the jet half-width gradually increases and the increase rate is higher for smallerq. In the suction chamber, the increase rate of the boundary layer width is independent ofq. But in the throat, the boundary layer width becomes thicker with the increase ofq. The increase rate of the boundary layer is less than that of the jet halfwidth. The residual energy coefficient is in a downtrend with the flow development. The decrease mainly occurs in the suction chamber for smallqandξis less than 0 in the recirculation region. With the increase ofq,ξdecreases at a lower rate. Compared with the distribution of the time-averaged axial velocity, that of the instantaneous velocity is more complex and disorderly.
(2) The distributions ofIxandIyare similar. The high intensity of the axial turbulence mainly occurs in the mixing layer and the near-wall regions of the diffuser. With the increase ofq, both the potential cores of the primary and secondary flows increase and the small turbulent region also expands. However,is different from. With the expansion of the boundary and mixing layers, both the peaks and valleys ofgradually move toward the axis. This movement is shown in a trend of rise firstly and then of drop. The turning point of this trend appears later for largerq. In thedistribution, there are merely two peaks in the mixing layer and a valley in the axial potential core.
(3) The annular distribution ofτis mainly found in the mixing layer and the recirculation region. Along the flow direction, the maximum in each section sees a trend of increase firstly and then of decrease. For largerq, the change ofτbecomes smoother and its region span is larger. There is a low-stress zone (τ≈0) between the mixing layer and the largeτregion in the wall-boundary layer. The correlation of the velocity turbulence near the axis is low.
(4) The intensity of the spanwise vortex is larger than that of the streamwise vorticity, so the former makes a greater contribution to the total vorticity. Both the instantaneous streamwise vortexes and the instantaneous spanwise vortexes distribute in the mixing and the wall-boundary layers as well as the recirculation region. The intensity of the spanwise vorticity reaches the top value at the nozzle exit and then sharply decreases with the flow development. Both of the intensity and the size of the streamwise vortexes are small at the nozzle exit with a trend of increase firstly and then of decrease with the flow development.
[1] Xiao L., Long X., Li L. et al. Movement characteristics of fish in a jet fish pump [J].Ocean Engineering, 2015, 108: 480-492.
[2] Long X., Xu M., Qiao L. et al. Impact of the internal flow in a jet fish pump on the fish [J].Ocean Engineering, 2016, 126: 313-320.
[3] Shimizu Y., Nakamura S., Kuzuhara S. et al. Studies of the configuration and performance of annular type jet pumps [J].Journal of Fluids Engineering, 1987, 109(3): 205-212.
[4] Elger D. F., Taylor S. J., Liou C. P. Recirculation in an annular-type jet pump [J].Journal of Fluids Engineering, 1994, 116(4): 735-740.
[5] Duan X. S., Sun X. Q. The Experimental study on compositional parameters of the annular multinozzle jet pump[J].Exploration Engineering, 1999, (6): 17-19(inChinese).
[6] Xiao L., Long X. Cavitating flow in annular jet pumps [J].International Journal of Multiphase Flow, 2015, 71: 116-132.
[7] Xiao L., Long X., Zhang J. Shear cavitation in an annular jet pump under recirculation conditions [J].Journal of Fluids Engineering, 2016, 138(6): 061303.
[8] Xiao L., Long X., Li X. et al. Numerical investigation on the recirculation in annular jet pumps [J].Journal of Mechanical Science and Technology, 2013, 27(6): 1603-1609.
[9] Yang X., Long X., Kang Y. et al. Application of constant rate of velocity or pressure change method to improve annular jet pump performance [J].International Journal of Fluid Machinery and Systems, 2013, 6(3): 137-143.
[10] Ji B., Luo X. W., Peng X. X. et al. Numerical Investigation of the ventilated cavitating flow around an underwater vehicle based on a three-component cavitation model [J].Journal of Hydrodynamics, 2010, 22(6): 753-759.
[11] Ji B., Luo X. W., Peng X. X. et al. Three-dimensional large eddy simulation and vorticity analysis of unsteady cavitating flow around a twisted hydrofoil [J].Journal of Hydrodynamics, 2013, 25(4): 510-519.
[12] Pendar M., Roohi E. Investigation of cavitation around 3D hemispherical head-form body and conical cavitators using different turbulence and cavitation models [J].Ocean Engineering, 2016, 112: 287-306.
[13] Roohi E., Pendar M., Rahimi A. Simulation of three-dimensional cavitation behind a disk using various turbulence and mass transfer models [J].Applied Mathematical Modelling, 2016, 40(1): 542-564.
[14] Luo X. W., Ji B., Tsujimoto Y. A review of cavitation in hydraulic machinery [J].Journal of Hydrodynamics, 2016, 28(3): 335-358.
[15] Luo X. W., Ji B., Peng X. X. et al. Numerical simulation of cavity shedding from a three-dimensional twisted hydrofoil and induced pressure fluctuation by large-eddy simulation [J].Journal of Fluids Engineering, 2012, 134(4): 041202.
[16] Ji B., Luo X. W., Arndt R. E. A. et al. Large eddy simulation and theoretical investigations of the transient cavitating vortical flow structure around a NACA66 hydrofoil [J].International Journal of Multiphase Flow, 2015, 68: 121-134.
[17] Yang X. L. Research on the flow mechanism and structure optimization of annular jet pumps [D]. Doctoral Thesis, Wuhan, China: Wuhan University, 2014(in Chinese).
[18] Ruith M., Chen P., Meiburg E. et al. Three-dimensional vortex breakdown in swirling jets and wakes: direct numerical simulation [J].Journal of Fluid Mechanics, 2003, 486: 331-378.
[19] Miller R. S., Madnia C., Givi P. Numerical simulation of non-circular jets [J].Computers and Fluids, 1995, 24(1): 1-25.
[20] Boersma B., Brethouwer G., Nieuwstadt F. A numerical investigation on the effect of the inflow conditions on the self-similar region of a round jet [J].Physics of Fluids, 1998, 10(4): 899-909.
[21] Hu H., Saga T., Kobayashi T. et al. Mixing process in a lobed jet flow [J].AIAA Journal, 2002, 40(7): 1339-1345.
(Received August 17 2016, Revised November 28, 2016)
* Project supported by the National Natural Science Foundation of China (Grant Nos. 51179134, 11472197 ).
Biography:Mao-sen Xu (1989-), Male, Ph. D. Candidate
Xin-ping Long,
E-mail: xplong@whu.edu.cn
杂志排行
水动力学研究与进展 B辑的其它文章
- Spatial relationship between energy dissipation and vortex tubes in channel flow*
- Numerical analysis of flow separation zone in a confluent meander bend channel*
- Mechanics of granular column collapse in fluid at varying slope angles*
- Numerical simulation of submarine landslide tsunamis using particle based methods*
- Double-averaging analysis of turbulent kinetic energy fluxes and budget based on large-eddy simulation*
- Prediction of the future flood severity in plain river network region based on numerical model: A case study*
