The mass and heat transfer process through the door seal of refrigeration☆
2017-05-29HaoshuTanXinzhouSongYingZhangMaogangHe
Haoshu Tan ,Xinzhou Song ,Ying Zhang ,Maogang He ,*
1 Key Laboratory of Thermal Fluid Science and Engineering of MOE,Xi'an Jiaotong University,Xi'an 710049,China
2 School of Mechanical and Electronic Engineering,Henan Institute of Science and Technology,Xinxiang 453003,China
1.Introduction
Refrigerator heat load consists of latent heat load,electric heat load and leakage heat load.Among these,leakage heat load is the biggest one,accounting for about 75%.Although refrigerator door seal can decrease leakage heat load much,there still exist mass and heat transfer through the gap between seal and chamber,which results in a lot of energy loss.In order to decrease leakage heat load as much as possible,it is ofgreatimportance to accurately predictthe mass and heattransfer through door seal.
In recentyears,a few related studies have been carried out.Afonsoet al.[1]introduced tracergas method to quantify the rate ofair in filtration through refrigerator door seal.Kimet al.[2]simulated the temperaturefield of refrigerator door seal by Fluent.Hanet al.[3]studied four kinds of common refrigerator door seal by using two-dimensional CAE models.Liet al.[4]calculated the heat leakage amount through seal on the basis ofFourier law.However,the gap between sealand chamber was not seriously considered in their models,so that mass transfer process had not been taken into consideration.
The purpose of this paper is to present a model by which the mass and heattransferprocess through refrigeratordoorsealcan be simulated with high accuracy.To verify the reliability of the proposed model,an experiment apparatus was also set up for comparison.
2.Method of Simulation
For simplification,a two-dimensionalmodelofrefrigerator door seal was set up for simulation influent.The computational domain,boundary conditions and mathematical foundations of the model are as follows.
2.1.Computational domain
The simulation model is composed of seal,door body and chamber body(Fig.1).The seal is assembled between the chamber body and door body,while a gap,the passageway of air in filtration,may occur between the seal and chamber body because of mechanical assembling(Fig.2).
As shown in Fig.1(b),anti-dew pipes are set up near the seal in the freezer chamber to prevent the door from being frozen.Table 1 tabulates the physical parameters of various materials for different parts in the model shown in Fig.1.
2.2.Boundary conditions
Pressure boundaries are used forthe inlet and outletof flow domain,while the specific parameters(temperature and pressure)are listed in Table 2.The wall of anti-dew pipes in the freezer chamber is isothermal at 38°C.Besides,Wall 1,Wall 2 and Wall 6 are assumed in the third boundary condition,and the temperatures and convection heat transfer coefficient values are presented in Table 3.
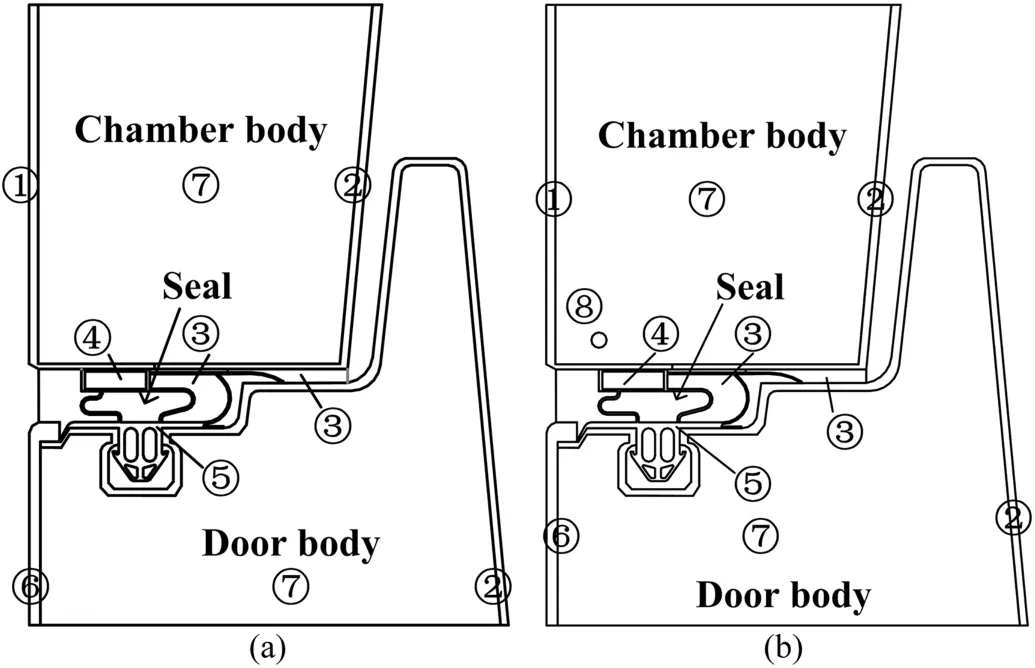
Fig.1.Calculation models of each refrigeration chamber(a)refrigeration chamber(b)freezer chamber.① Steel;② ABS;③ Air;④ Magnet;⑤ PVC;⑥ Aluminum;⑦ PU-foam;⑧Copper.
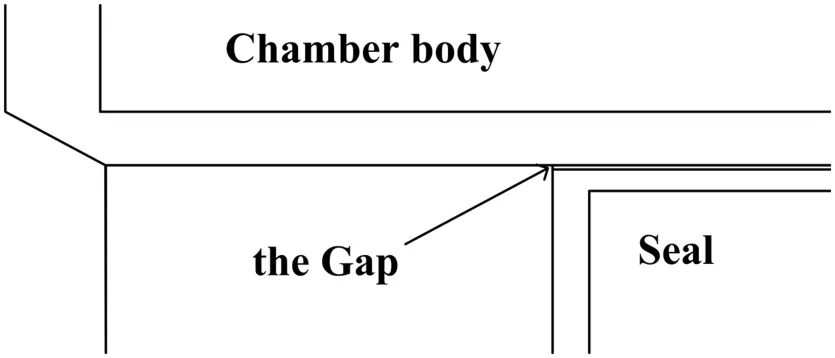
Fig.2.The gap between seal and chamber body.

Table 1Physical parameters of the materials in the models
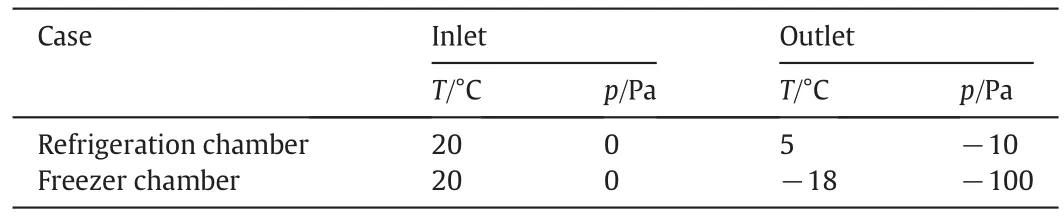
Table 2The inlet and outlet conditions of the models
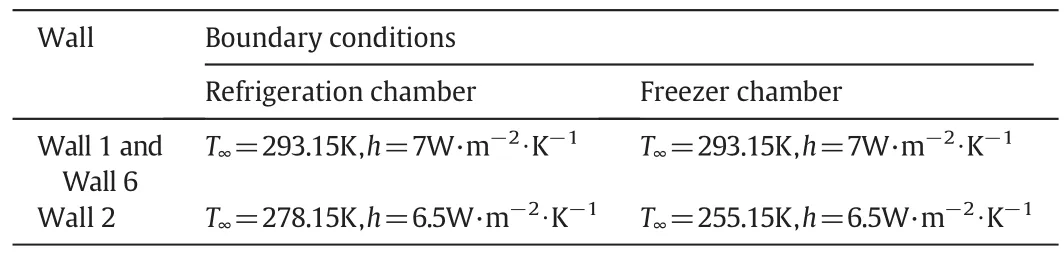
Table 3The boundary conditions of Wall 1,Wall 2 and Wall 6
2.3.Mathematical foundation
The simulation model of seal is developed under the following assumptions:
·The flow is laminar and incompressible.
·The two-dimensional flow is steady.
·Fluid properties are constant.
·Radiative transfer is neglected.
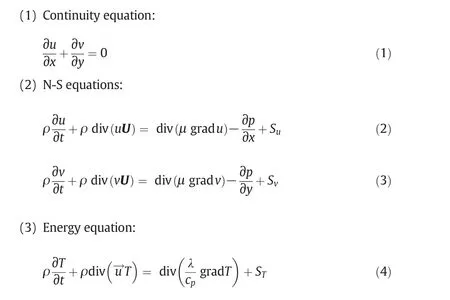
On the basis of the above assumptions,the flow in the gap is governed by the following equations,which are the continuity,the Navier–Stokes as well as energy equations.
3.Method of Experiment
3.1.Tracer gas technique
Tracer gas technique has the advantages of simple operation,uncomplicated control and relatively high accuracy.Mainly being used in buildings for energy auditing before[5–9],this method can be illustrated as follows:after one kind of gas is introduced in the space where the air in filtration is to be measured,the CO2concentration of the air in the chamber over time can be measured by an appropriate gas analyzer in this work.
When the experiment refrigerator is running stably,the mass conservation equation of CO2inside can be expressed by,
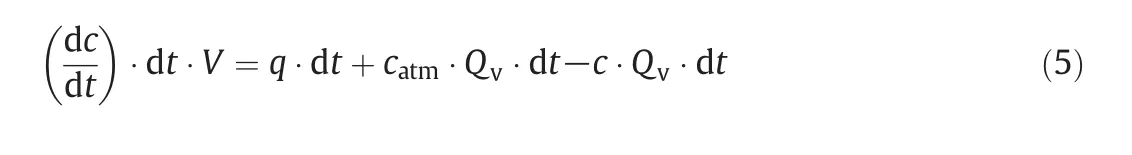
To change the concentration of CO2inside,N2with certain quantity is introduced in the tested space at the beginning.Because there is no extra production of CO2in chamber,the net production rate of CO2(q)in the chamber is null,and we can obtain the following equation,
wheret1is test time andc0is the initial CO2concentration in the tested chamber.
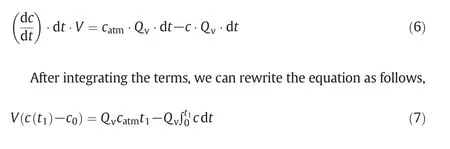
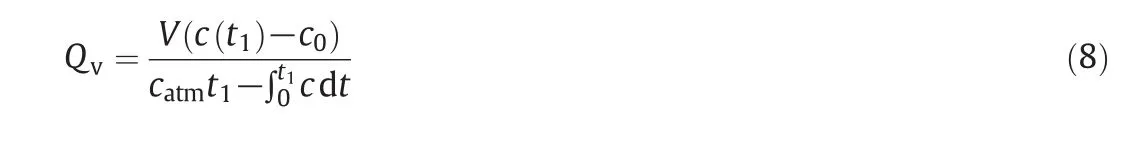
Considering that the air in filtration rateQvand the CO2concentration in aircatmare constant,thus we have
3.2.Test facilities
Fig.3 illustrates the experimental apparatus used in this study.On the basis of ASTM standard about tracer gas method[10–13],the apparatus fundamentally are consisted of a refrigerator section,a gas supply section and a sampling section.
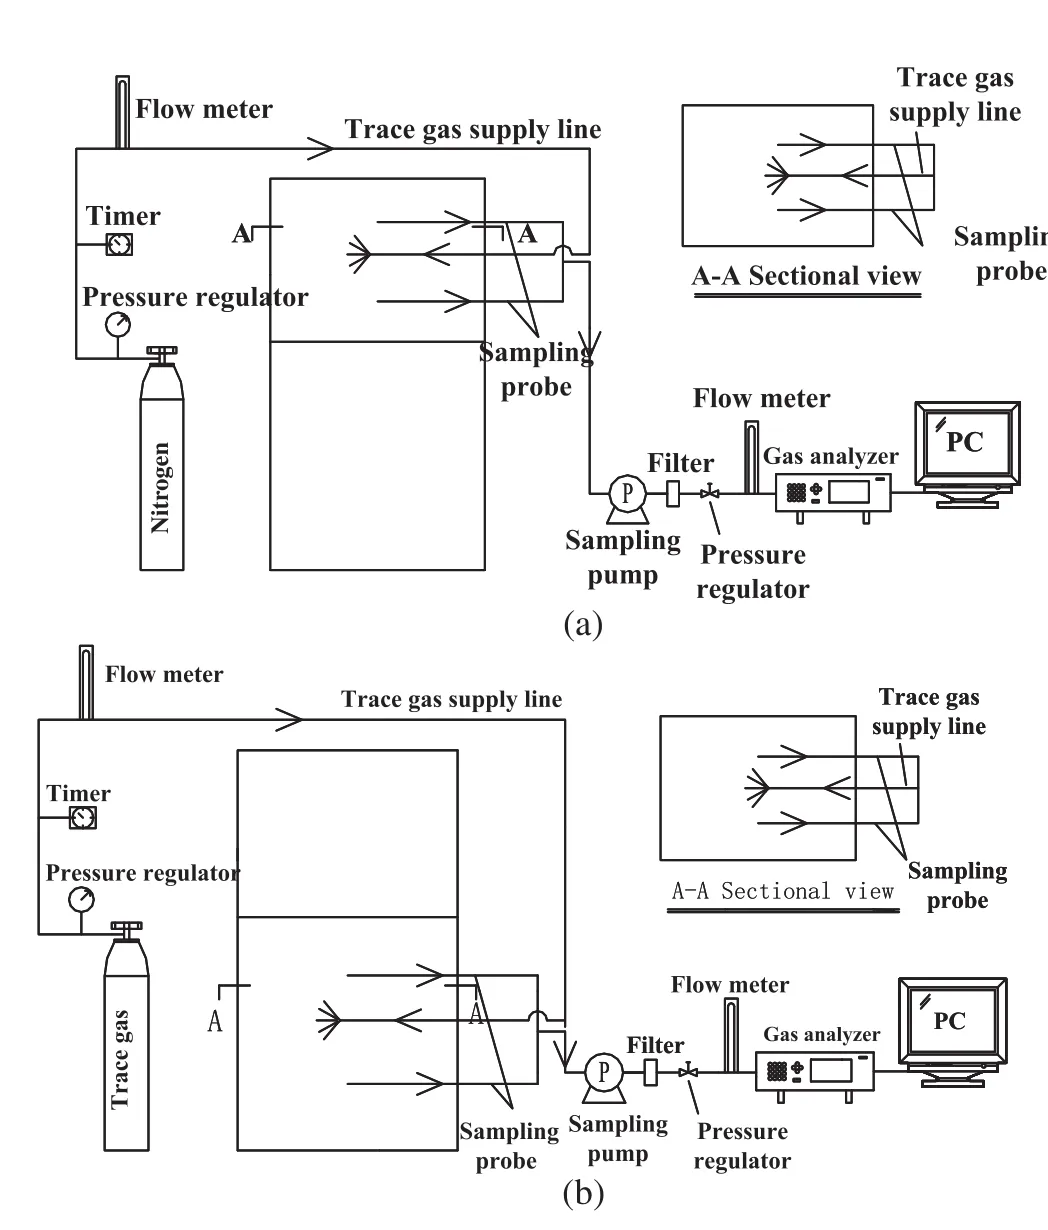
Fig.3.Schematic view of experimental system of air in filtration rate measurement on(a)refrigeration chamber and(b)freezer chamber.
In experiment,Frestec BCD217CHS2B direct cooling refrigerator was selected with one refrigeration chamber(internal volume of 131 L)and one freezer chamber(internal volume of 86 L).In order to ensure that there is no leakage through other refrigerator structures,we sealed the drainage hole that leads the condensate inside to a drying pan sitting on the top of the compressor.The air samples were collected simultaneously on four sampling points inside the chamber.Moreover,average value of the four is taken as the experimental value,for an accurate measurement of CO2concentration.
The CO2concentration was measured by a IRME-S infrared gas analyzer.The measurement range of the gas analyzer is 0-5×10⁻³m3·m-3.In addition,the repeatability and zero/span shift errors of the gas analyzer are 0.5%and 1%of the full scale value,respectively.The resolution of the instrument is 1 × 10⁻⁶m3·m-3.
At the same time,the temperatures at seal edge and the corner of chamber body(Fig.4)were measured by calibrated thermocouples(200 μm diameter,precision ±0.2 °C).

Fig.4.The location of thermocouples installed.
All thermocouples were connected to a data acquisition system that read all temperatures in interval of 20 s.
4.Results and Discussion
4.1.Air infi ltration analysis
For the reason that a two-dimensional model was applied in this study,the simulated results were expressed in per unit length,and the experimental results also are set in per unit length for unity.Table 4 listed the simulated and measured air in filtration rates through seal,together with the deviations between them.
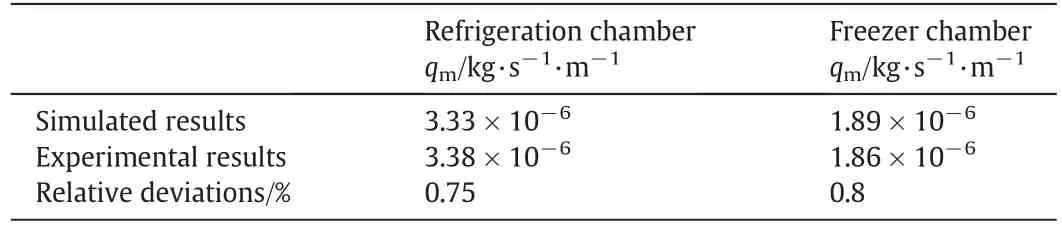
Table 4The simulated results and experimental results of air in filtration rate through seal
As to the simulated results shown in Table 4,the rate of the air infiltration on the refrigeration chamber and that on the freezer chamber were 3.33 × 10⁻⁶kg·s-1·m-1and 1.89 × 10⁻⁶kg·s-1·m-1,respectively.When the refrigerator was running stably,the corresponding experimental values were 3.38 × 10⁻⁶kg·s-1·m-1and 1.82 × 10⁻⁶kg·s-1·m-1,respectively.Both of values were extremely closed to the experimentalresults,and the relative deviations on the refrigeration chamber and on the freezer chamber were 0.75%and 0.8%,respectively.These results indicated that the simulated results were in good agreement with the experimentalresults and the model proposed in this paper could calculate the air in filtration through seal accurately.
To be more detailed,the air in filtration rate on the refrigeration chamberwasapproximately twice asmuch asthaton the freezerchamber.Itwas mainly resulted from a largerpressure difference between inside and outside air on the freezer chamber,which could cause the freezer seal to be much more compressed so that the gap between the chamber body and the seal was relatively narrower.
4.2.Temperature analysis
Fig.5 displayed the simulated temperature contour of the refrigeration chamber and that of the freezer chamber individually,while the temperatures measured by thermocouples were presented in Fig.6 for the refrigeration chamber and in Fig.7 for the freezer chamber.The comparison of calculated and measured temperatures at Point 1 and Point 2 designated in Fig.4 were tabulated in Table 5.
As shown in Fig.5,the higher temperature region was the outside wall,while the lower temperature region was the inside wall both in the refrigeration chamber and in the freezer chamber.However,the existence of the hot line(anti-dew pipes)resulted in the maximum temperature region surrounding the hot line in the freezer chamber.At Point 2,the maximum difference between measured and calculated temperatures that occurred in the freezer chamber was 2.03°C,and that in the refrigerator chamber was 1.39°C.At Point 1,both of the differences were even less than those at Point 2.
The difference between simulation results and experiment results might result from two main causes:one was because the inner wall of the chamber in simulation was supposed to transfer heat with the cooled air ata constanttemperature of5°C in the refrigeration chamber(-18°C in the freezer chamber)by convection regardless of the fact that the air temperature in the chamber was varying with time in experiment;the other was for the reason that the simulation model in this paper was two-dimensional,which would bring slight deviation as well.

Fig.5.Calculated temperature contours of(a)the refrigeration chamber and(b)the freezer chamber.

Fig.6.The history of measured temperatures at seal edge and the corner of chamber body in the refrigeration chamber.h represents hour;m represents minute.
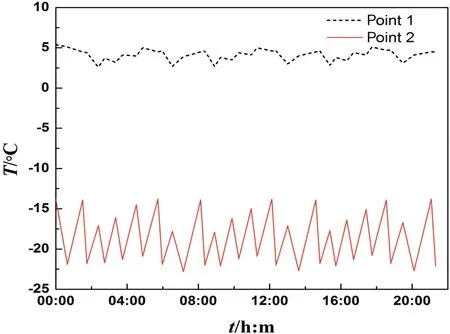
Fig.7.The history of measured temperatures at seal edge and the corner of chamber body in the freezer chamber.h represents hour;m represents minute.
Despite the unavoidable tiny deviation stated above,the simulated results are ofa higher precision compared with those in the previous related work.Also the values tabulated in Tables 4 and 5 give an evidence that the models proposed in this paper could accurately calculate the temperatures of the space both near and at seal.The optimization of the simulation model in this paper mainly comes from the improvement that the gap between the door seal and the chamber is firstly set up so that the heat and mass transfer in the gap,which has a huge influence on the simulated results,could be taken into full consideration.Additionally,the optimization on boundary conditions also works.
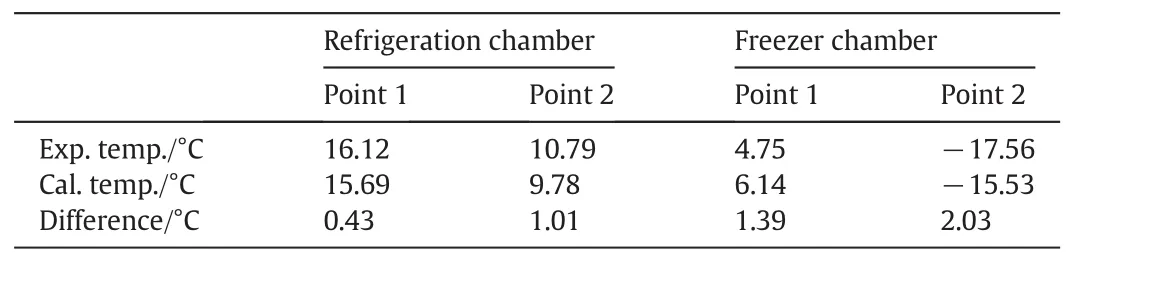
Table 5The simulated results and experimental results of temperatures at special points
5.Conclusions
In the presentpaper,the mass and heattransfer through refrigerator door seal have been studied both simulatively and experimentally.In simulation,a two-dimensional optimized refrigerator door seal model is set up.In experiment,tracer gas method is employed,and then the air in filtration and temperature atsome specialpoints in both chambers are measured.The simulated and experimental results are as follows.
As to the field of mass transfer,the simulated values of the air in filtration rates on the refrigeration chamber and on the freezer chamber were 3.33 × 10⁻⁶kg·s-1·m-1and 1.89 × 10⁻⁶kg·s-1·m-1,while the experimental values were 3.38 × 10⁻⁶kg·s-1·m-1and 1.86× 10⁻⁶kg·s-1·m-1,respectively.The relative deviationsbetween simulation and experiment on both chambers were less than 1%.
As to thefield ofheat transfer,the temperatures at the seal edge and at the corner of chamber were simulated and measured by thermocouples.The maximum difference between calculated and measured temperatures that occurred in the freezer chamber and in the refrigerator chamber were 2.03 °C and 1.39 °C,respectively,the values of which are less than those in previous work.
By comparisons,it appears that the simulated results are extremely close to the experimentalresults,which means thatthe proposed model has a good reliability.This paper initially sets up a modified model that can be used to precisely simulate mass and heat transfer through refrigerator door seal,and we may use this model to predict mass and heat transfer through door seal in other conditions as well.The innovation of this research not only lies in the modified model but also in the improvement that the air in filtration and heat loss can be analyzed simultaneously.In the future,the refrigerator door seal optimization on the basis of the model presented in this paper,will be under further study.
Nomenclature
cCO2concentration in the tested space,m3·m-3
catmCO2concentration in air,m3·m-3
cpair heat capacity,J·kg-1·°C-1
c0initial CO2concentration in the tested space,m3·m-3
ppressure,Pa
Qmmass air in filtration rate,kg·s-1
Qvvolume air in filtration flowrate,m3·h-1
qnet production flowrate of CO2in test space,m3·h-1
qmthe air in filtration rate through unit length seal,kg·m-1·s-1
STviscous dissipation term
Su,Svthe generalized source term of momentum conservation equation
Ttemperature,K or°C
T∞temperature of the fluid far from surface,outside of the thermal boundary layer,K
ttime,s
U fluid velocity vector,m·s-1
ufluid velocity component inxdirection,m·s-1
Vvolume,L
vfluid velocity component inydirection,m·s-1
λ thermal conductivity,W·m-1·K-1
μ dynamic viscosity,Pa·s
ρ density,kg·m-3
[1]C.Afonso,M.Castro,Air in filtration in domestic refrigerators:The influence of the magnetic seals conservation,Int.J.Refrig.33(4)(2010)856–867.
[2]H.S.Kim,J.S.Sim,J.S.Ha,A study on the heat transfer characteristics near the magnetic door gasket of a refrigerator,Int.Commun.Heat Mass Transfer38(9)(2011)1226–1231.
[3]L.Han,S.F.Chen,Z.G.Lv,et al.,CAE analysis of the thermalconductivity and effecting factors of the door seal of refrigerators,China ApplianceS1(2012)170–173.(in Chinese)
[4]J.S Li,Y.Y.Yang,Energy-saving design of refrigerator door seal,Household Appliances7(2001)19-19.(in Chinese)
[5]C.F.A.Afonso,E.A.B.Maldonado,E.Skåret,A single tracer-gas method to characterize multi-room air exchanges,Energy Build.9(4)(1986)273–280.
[6]B.CKWRS,New approach for measuring air flows in buildings using a per fluorocarbon tracer,Fuel Energy Abstr.36(5)(1995)380-380.
[7]K.W.Cheong,Air flow measurements for balancing of air distribution system—Tracer-gas technique as an alternative?Build.Environ.36(8)(2001)955–964.
[8]M.H.Sherman,On the estimation of multizone ventilation rates from tracer gas measurements,Build.Environ.24(4)(1989)355–362.
[9]N.O.Breum,Diagnosis of ventilation by single-tracer gas techniques,Indoor Air3(S1)(1993)5–28.
[10]ASTM,Standard Practices for Air Leakage Site Detection in Building Envelopes and Air Barrier Systems.ASTM E1186-03,ASTM,USA,2009.
[11]ASTM,Standard Test Method for Determining Air Leakage Rate by Fan Pressurization,ASTM,USA,2010.
[12]ASTM,Standard Test Method for Determining Air Change in a Single Zone by Means of a Tracer Gas Dilution,ASTM,USA,2011.
[13]ASTM,Standard Guide for Using Indoor Carbon Dioxide Concentrations to Evaluate Indoor Air Quality and Ventilation,ASTM,USA,2012.
杂志排行

Chinese Journal of Chemical Engineering的其它文章
- Step-wise synthesis of work exchange networks involving heat integration based on the transshipment model☆
- Performance of CO2 absorption in a diameter-varying spray tower☆
- Optimal design of heat exchanger header for coal gasification in supercritical water through CFD simulations☆
- Coupled simulation of recirculation zonal firebox model and detailed kinetic reactor model in an industrial ethylene cracking furnace☆
- Optimization and control of a reactive distillation process for the synthesis of dimethyl carbonate☆
- Application of the dividing wall column to olefin separation influidization methanol to propylene(FMTP)process☆