Numerical investigation of unsteady sheet/cloud cavitation over a hydrofoil in thermo-sensitive fluid *
2017-03-14TiezhiSun孙铁志ZhiZong宗智LiZou邹丽YingjieWei魏英杰YichenJiang姜宜辰
Tie-zhi Sun (孙铁志), Zhi Zong (宗智),2,3, Li Zou (邹丽),2,3, Ying-jie Wei (魏英杰),Yi-chen Jiang (姜宜辰),3
1. School of Naval Architecture, Dalian University of Technology, Dalian 116024, China,
E-mail: suntiezhi@dlut.edu.cn
2. State Key Laboratory of Structural Analysis for Industrial Equipment, Dalian 116024, China
3. Collaborative Innovation Center for Advanced Ship and Deep-Sea Exploration, Shanghai 200240, China 4. School of Astronautics, Harbin Institute of Technology, Harbin 150001, China
Introduction
The cavitation usually occurs when the pressure in a liquid drops below the vapor pressure in the local thermodynamic state[1,2]. In general, the cavitation is unavoidable and will lead to undesirable effects, such as noise, vibration and surface erosion. A comprehensive understanding of the flow mechanism of the sheet/cloud cavitation is important for the related engineering design. The production of the vapor from the cavitation absorbs the latent heat of the evaporation from the surrounding liquid, resulting in a temperature depression inside the cavity. This phenomenon is called the thermal effects of the cavitation[3].Usually, the thermal effects of the cavitation occurs in the room temperature water can be ignored and the cavitation may be assumed to be an isothermal process[4-6]. The so-called thermo-fluid means that it is thermo-sensitive, with a rapid vapor pressure variation and a low liquid to vapor density ratio, that would have substantial thermal effects due to the cavitation.Then the local flow is altered significantly and becomes more complicated[7]. The typical thermosensitive fluids include the liquid hydrogen, the liquid nitrogen and the liquid oxygen, which are proposed as the propellants for rockets and other aerospace equipment. Hence, the unsteady sheet/cloud cavitation with the thermal effects involved is an important issue.
During the past few decades, considerable efforts have been made to study the thermal effects in the cavitating flows. As early as 1956, Stahl and Stepanoff[8]introduced a B-factor method to estimate the tempera-ture drop induced by the thermal effects during the phase change process. Sarosdy and Acosta[9]conducted cavitation experiments in the water and the Freon. They found that the cavity in the Freon was indistinct and frothy, while the cavity formed in the water was relatively clear. Hord[10,11]carried out the most popular and detailed experiment in the liquid hydrogen and nitrogen, and obtained the cavity length,the temperature drop and the pressure distribution under various flow conditions. Thermal effects on the cavitation have not been effectively investigated due to the experimental difficulties. Recently, Franc et al.[12]investigated the instabilities of the cavitating flow around the inducer blades in the Freon R-114.They found that the onset of the blade cavitation was delayed and suppressed due to the thermal effects.Niiyama et al.[13]carried out experiments around a hydrofoil in the liquid nitrogen, and obtained several features of the thermal effects. They found that the mean thickness of the liquid was small, caused by the suppression of the temperature diffusivity. Because of the limitation and the safety problems of the cavitating flow experiment in cryogenic fluids such as the liquid hydrogen and nitrogen, Gustavsson et al.[14], Kelly and Segal[15,16]chose the fluoreketone as a surrogate for the cavitating liquid cryogens to investigate the cavitating flows in a wide range of cavitation numbers,temperatures and angles of attack. Unsteady cavity shapes and pressures were obtained for a qualitative and quantitative insight into the thermal cavitation.Although considerable experiment results were obtained, the thermal effects of the cavitation dynamics in different fluids, the dynamic evolution of unsteady cavitating flows, and the transition characteristics in thermo-sensitive fluids are still not well understood.
More numerical simulations are necessary to investigate the cavitating flows with thermal effects involved to fill the gap due to the lack of the measurement data and experiment techniques. Cavitation models play a significant role in the accuracy of the prediction for the cavitating flows. Generally, the present cavitation models based on the homogeneous flow method are widely used for the cavitating flows.These cavitation models are usually established as a mass/volume fraction equation, with the mass transport processes being expressed as the evaporation and condensation rates, such as the models proposed by Singhal et al.[17], Merkle et al.[18], Kunz et al.[19]and Zwart et al.[20]. Recently, Hosangadi and Ahuja[21]used the Merkle cavitation model to simulate the cavitating flows in the liquid nitrogen and hydrogen,they found that the thermal depression was enhanced at lower velocities, meanwhile, they suggested using lower parameter values for the cavitation model.Tseng et al.[22,23]investigated the modeling for the cryogenic cavitation with refined cavitation model parameters. They found that the evaporative cooling reduced the cavitation intensity and resulted in a shorter length than that under isothermal conditions.Yu et al.[24]developed a new cavitation model with consideration of the viscous effect to simulate the cavitating flow in the water in cases of large liquid temperature variation. Huang et al.[25]used a thermal cavitation model to simulate the 2-D cavitating flows in the liquid hydrogen, and evaluated the sensitivity of the response to the cavitation model parameters and the temperature-dependent material properties. Sun et al.[26]extended a cavitation model based on the transport-based cavitation model, and more accurate predictions of the thermal effects during the cavitation process were obtained. Chen et al.[27]considered the heat transfer effect during the phase transfer process,in a wide range of free-stream temperatures and velocities in the fluoroketone. These numerical studies provide some insight into the cavitating flows of thermo-sensitive fluids.
The cavitation is basically unsteady in nature and it is accompanied by a multi-scale turbulent flow,furthermore, the thermal effects will increase the difficulty in the simulations of cavitating flows in thermo-sensitive fluids. Hence, the methods of turbulence modeling are important. Mani et al.[28].numerically investigated the turbulence modeling of cavitating flows in turbopump inducers by the Reynolds averaged Navier-Stokes (RANS) method.They found that the cavitation prediction was related to the choice of the turbulence models, and the sensitivity of the turbulence model was strongly dependent on the types of cavitating flows. Zhu et al.[29]applied the large eddy simulation (LES) method to investigate the interactions of the vortices, and the thermal effects of cavitating flows in the liquid hydrogen, and a special cavitation shedding mechanism was found to reveal the complex dynamic feature of the thermal effects. Due to the over-prediction of the turbulent eddy viscosity of the RANS methods, the unsteady characteristics cannot be effectively captured.However, the LES approach is computationally too expensive. Hence, some approaches are developed to combine the advantages of the RANS and the LES.Girimaji[30]developed a hybrid method of the partially averaged Navier-Stokes (PANS) model, which can capture the unsteady features of important scales of the turbulent flow with a minimal computa- tional cost,and it has been successfully applied in various researches of unsteady cavitating flows with reasonable results[31-33].
Generally, the cavitation instability is closely related to the pressure distribution in the cavity closure region. Especially, a high adverse pressure gradient exists at the rear of cavity, and a re-entrant jet will be developed to trigger the cavity shedding[34-36].More recently, in addition to the re-entrant jet observation, Ganesh et al.[37]found that the bubbly shock waves were associated with a strong periodic cloud shedding and collapse. Arndt et al.[38]. observed two types of cavitation behavior around the hydrofoil,based on various combinations of the cavitation number and the angle of attack /2σα. Despite a growing interest in the study of cavitating flows for thermo-sensitive fluids, the dynamic evolution and the transition characteristics are still not clear.
Based on the state of the arts numerical methods,the present study focuses on the unsteady cavitating flow around the hydrofoil in thermo-sensitive fluids for a wide range of cavitation numbers and temperatures, using a thermal cavitation model and the PANS turbulent closure model. Meanwhile, the numerical framework is coupled with the energy equation, the energy source induced by the latent heat and various thermodynamic properties. The thermal effects of cavitation dynamics, the cavity evolution of unsteady cavitating flows, and the transition characteristics are analyzed to reveal the evolution mechanism of the sheet/cloud cavitation in thermo-sensitive fluids.
1. Mathematical formulations and numerical methods
1.1 Conservation of mass, momentum and energy
The continuity, momentum and energy equations are as follows:
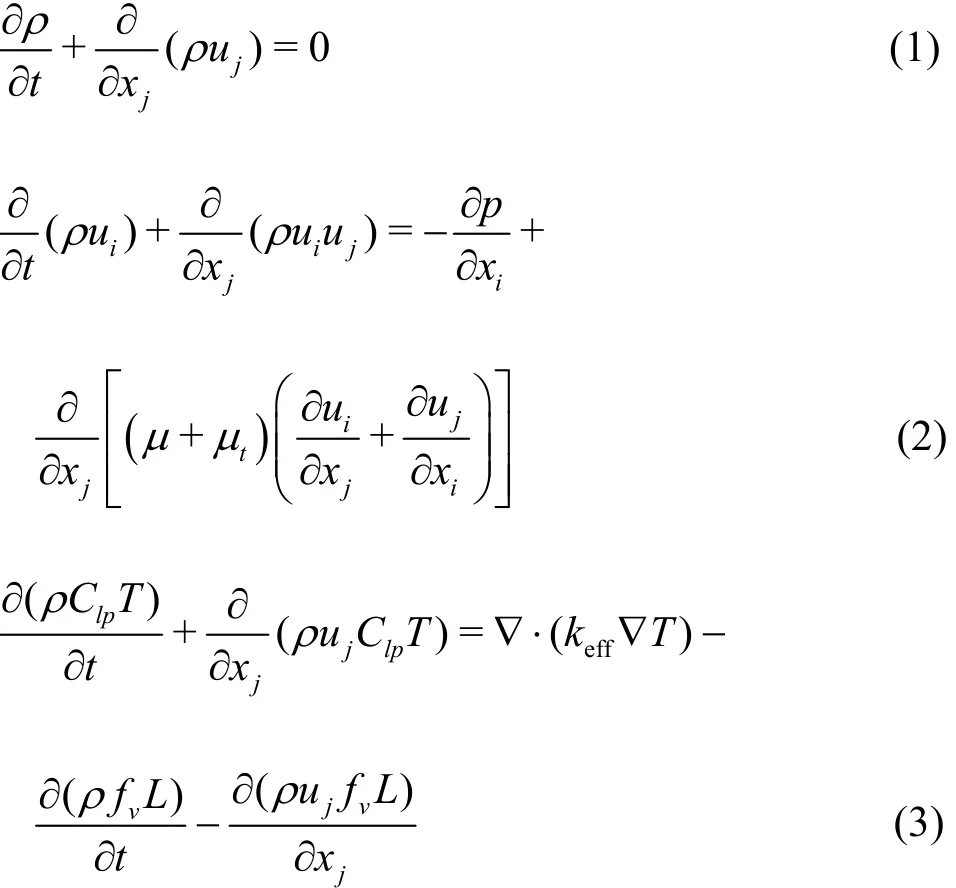
where the mixture density ρ is related to the phase densities as ρ = ρvαv+ ρl( 1 - αv), The subscripts l and v denote, respectively, the liquid phase and the vapor phase, i and j denote the coordinate directions, Clpis the specific heat, f is the mass fraction, keffis the effective thermal conductivity,L is the latent heat of the evaporation, p is the pressure,ES is the energy change of the flow field caused by the cavitation, u is the velocity, μ is the dynamic viscosity,tμ is the turbulence viscosity.
1.2 Partially averaged Navier-Stokes (PANS) closure model
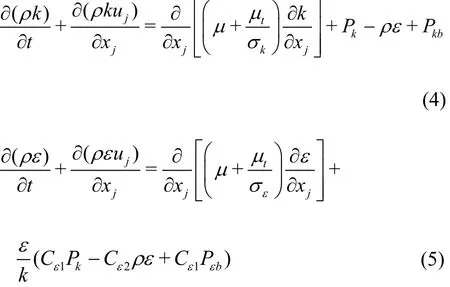
The turbulence model plays a major role in capturing the unsteady behaviors of cavitating flows.The PANS model has been used to investigate various turbulent flows. It was first proposed by Girimaji[30]as a bridging method from the RANS to the direct numerical simulations (DNS). The derivation of the governing equations in the PANS model is based on the standard -kεmodel:
The turbulence viscositytμ is a function of the total turbulence kinetic energy k and the dissipation ε k

P represents the turbulence production due to the viscous forces, which can be expressed as
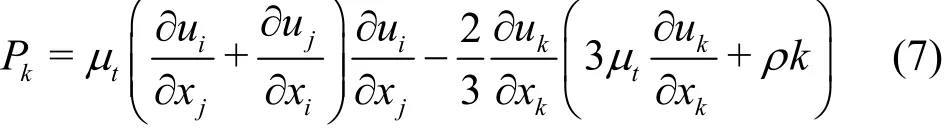
where Cε1, Cε2, Cμ, σkand σεare constants,Cε1=1.44, Cε2=1.92, Cμ= 0.09, σk=1.0 and σε=1.3, σkand σεdenote, respectively, the turbulent kinetic energy and the dissipation rate; Pkband Pεbrepresent the influences of the buoyancy forces.
The modeled-to-resolved scale ratio in the PANS is determined by the unresolved kinetic energykf and the unresolved dissipation rate fε. The two resolution control parameterskf andfεare defined as:

where the subscript n stands for the unresolved quantities, k and ε are the total turbulence kinetic energy and the dissipation rate, respectively. The model coefficients in the PANS model are:=σεin the PANS model are consistent with the standard k -ε model.
Since the parameters fkand fεcan determine the degree of the model physical resolution, for a PANS calculation, these parameters should be specified. The control parameter fk=1 indicates the RANS, and fk=0represents the DNS resolution.The PANS model has been successfully applied for simulations of cavitating turbulence flows. However,most applications of the PANS simulations are concentrated on the unsteady cavitating flow in the water. In the present study, the PANS model is extended to a large-scale fluctuation around a hydrofoil in the fluoroketone. This would help us gain an insight into its abilities in thermo-sensitive fluids.
1.3 Cavitation model for thermo-sensitive fluids
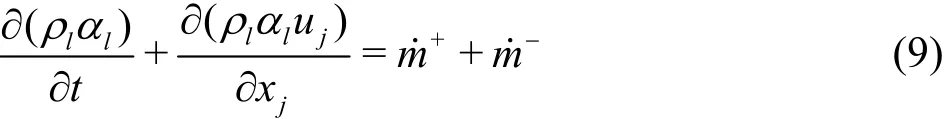
Physically, the phase change process of the cavitation is governed by kinetics and thermodynamics. The mass transfer rate between the liquid and the vapor is modeled through the source term+m˙ and the sink term m-˙, which represent, respectively,the evaporation rate and the condensation rate. A typical approach to determine the liquid volume fraction of the cavitation is to solve the transport equation, which is as follows
The cavitation model used in this study for solving m ˙+and m˙-is based on the Zwart model.This cavitation model is based on the simplified Rayleigh-Plesset equation
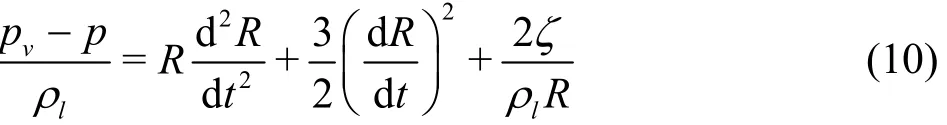
wherevp is the saturation pressure at the local temperature, p is the ambient pressure at a large distance from the bubble, R represents the bubble radius, μ is the dynamic viscosity, ζ is the surface tension between the liquid and the vapor.
Neglecting the second order terms and the surface tension, the Rayleigh-Plesset equation can be considered as a description of the bubble growth driven by the simplified expression

To simulate the cavitating flows in thermosensitive fluids, the thermal effects are important.Based on the description and the derivation in the literature, we can obtain the variation of the bubble radius induced by the thermal effects as

where aLis the thermal diffusivity of the liquid,Cplis the thermal conductivity, Levis the latent heat of the vaporization, t is the typical time taken by the bubble growth, T∞is the temperature in places far from the bubble, and T is the temperature inside the bubble.
After combining Eq.(11) and Eq.(12), the mass transfer rate is obtained as follows:

where Fvapand Fcondare the empirical constants,αnucis the volume fraction of the non-condensable gas.
1.4 Numerical setup and description
In the present study, we model the unsteady cavi-tating flows in the fluoroketone over a NACA0015 hydrofoil, which wasexperimentally investigated byKelly and .The hydrofoil chord length in the experiments is c =0.0508m and it is fixed in a closed-loop tunnel with a 0.1 m square cross section.The computational domain is identical with the tunnel configuration shown in Fig.1. The hydrofoil used in this paper is fixed with the attack angle of α = 7.5o.The inlet is 2.1c upstream from the leading edge and the outlet is 6c downstream from the leading edge.The boundary conditions of the computational domain are also shown in Fig.1. An adiabatic no-slip wall boundary condition is set on the tunnel wall and the hydrofoil surface. The inlet velocity is set to be V∞=7.5 m/s based on the experimental conditions,and the outlet pressure is set to vary according to the inlet cavitation number, which is defined as σ =[p∞-pv( T∞)]/(0.5), where p∞is the tunnel pressure.
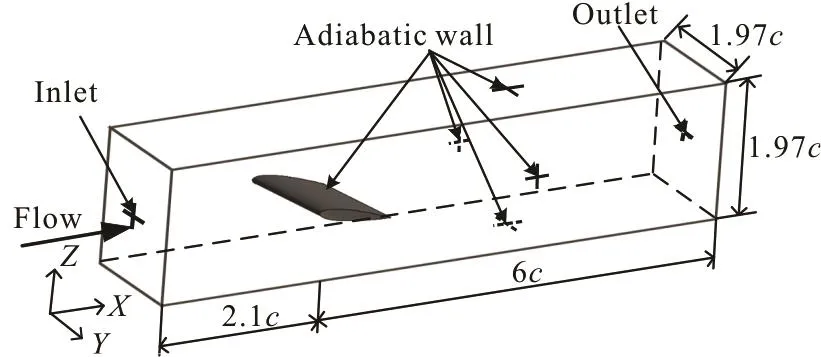
Fig.1 Computational domain and boundary conditions
The mesh of the computational domain is shown in Fig.2, and a structured O-H type grid is generated for the computational domain. The mesh refinements are performed at the hydrofoil leading edge (LE) and trailing edge (TE). The grids near the hydrofoil surface are specially refined, with consideration of the wall effects.
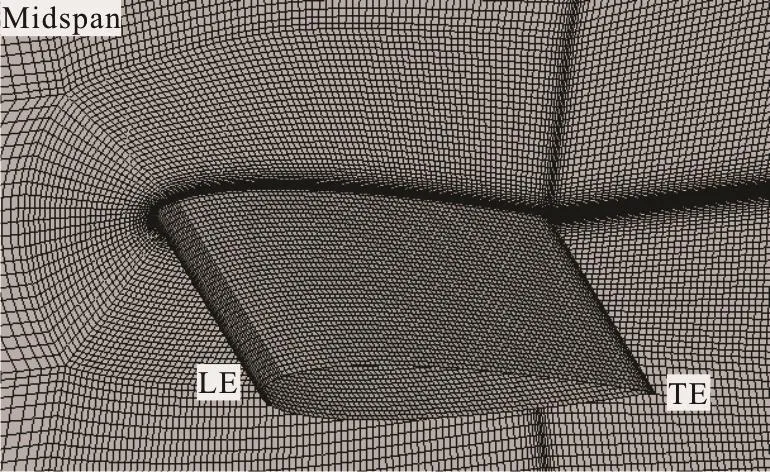
Fig.2 Mesh generation around the NACA0015 hydrofoil(α=7.5o)
To assess the performance of the numerical method, the distribution of the surface pressure coefficients around the hydrofoil is presented. Figure 3hydrofoil obtained by numerical predictions and experimental results. Good agreement between the predicted and measured pressures is observed.

Fig.3 Comparison of the pressure coefficient on the suction side of the hydrofoil at σ=0.7, T∞ =298 K , R e=1.02× 10⁶ and σ=0.7, T=303K , Re = 1.05×∞106
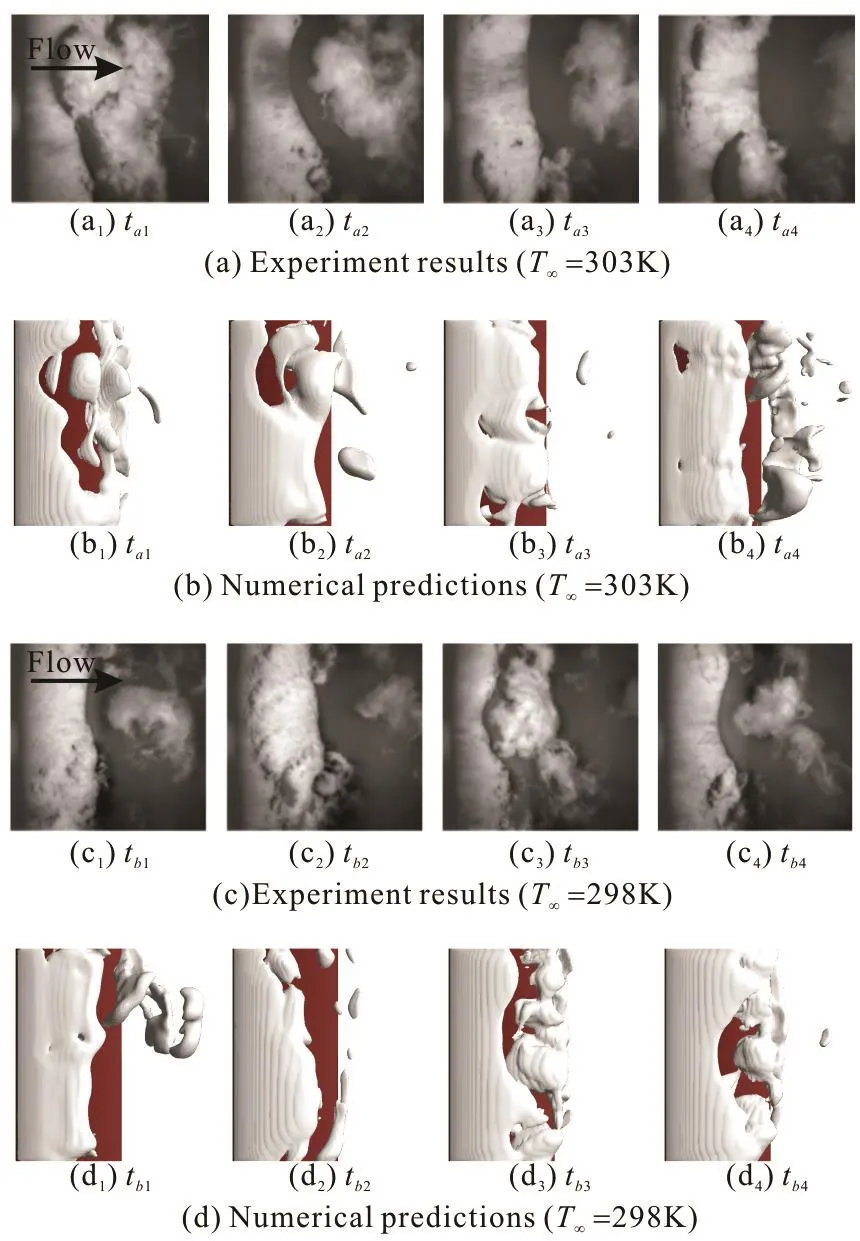
Fig.4 (Color online) Comparisons of the predicted and experimental cavity evolutions at σ=0.7, T∞=298 K, Re=1.02× 10⁶ and σ=0.7, T∞ =303K,Re = 1.05× 10⁶
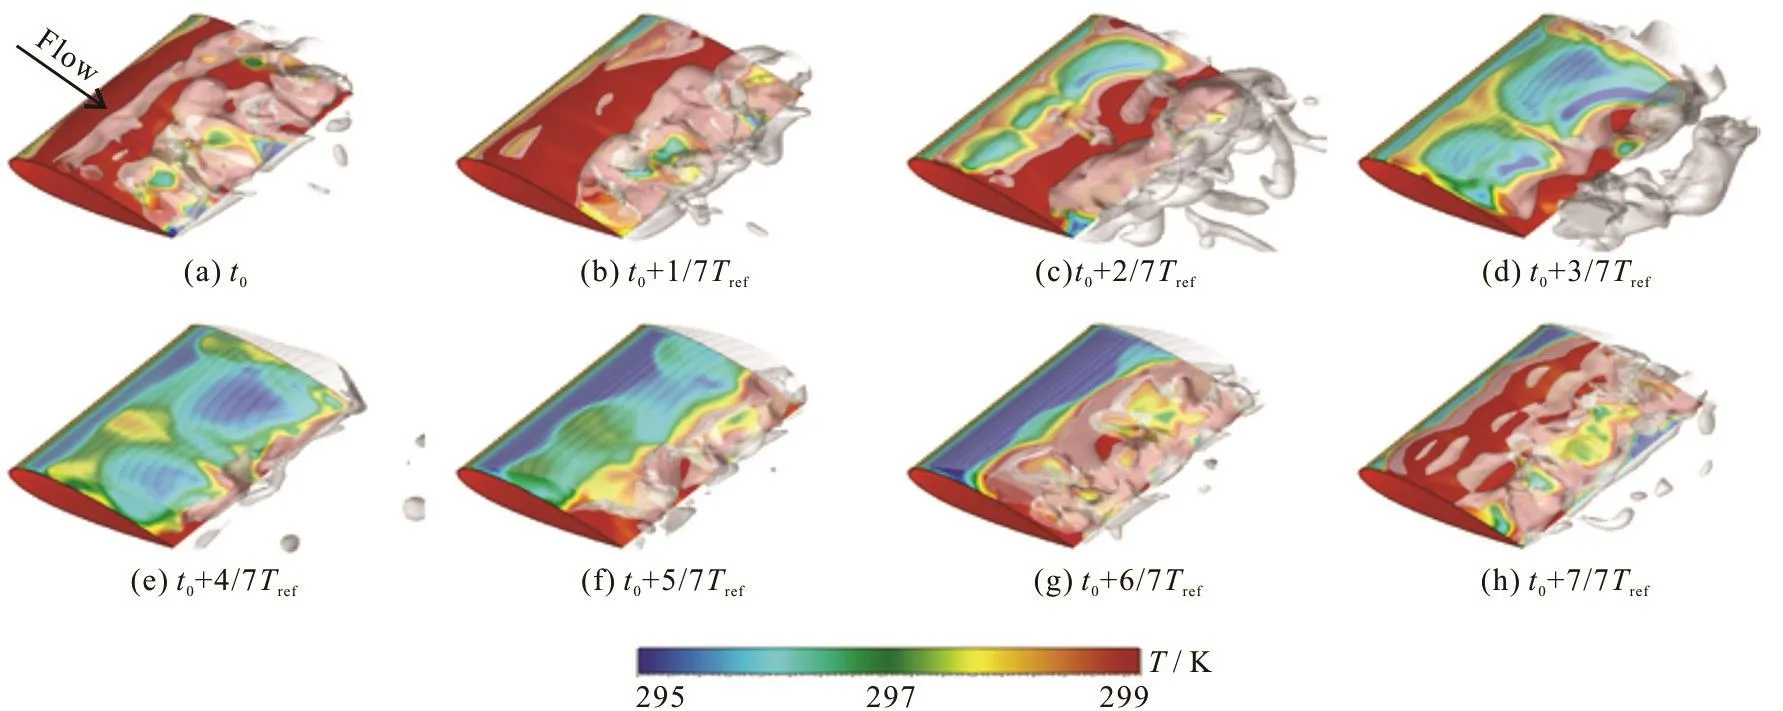
Fig.5 (Color online) Evolution of cavity and temperature around hydrofoil in fluoroketone during one typical cycle (σ=0.7,T∞ = 298 K )
Figure 4 shows the comparisons of the predicted and experimental cavity evolutions at different instants.It is shown that the present numerical framework can capture the unsteady cavity evolution of the cavitating flows. More analyses of the mechanism of the thermal effects on the evolution of the cavitation will be made in Section 2.
2. Results and discussions
2.1 Thermal effects on cavitating flows in different thermo-sensitive fluids
Here we study the thermal characteristics of unsteady cavitating flows in thermo-sensitive fluids.Firstly, Fig.5 illustrates the attached cavity around the hydrofoil and the temperature on its surface, in a time-lapse sequence. The free stream conditions of the numerical simulation are consistent with the experimental setup, which are given as T∞=298K,σ= 0.7, V∞=7.5 m/s. The cavity evolution around the hydrofoil appears to be in a significant periodicity.Trefin Fig.5 is defined as the typical cycle, and t0is the beginning time of each cycle. It is clearly shown that the temperature distribution and evolution see significant unsteady characteristics along the main flow and span directions of the hydrofoil. At time t0,the phase change from the vapor to the liquid is highlighted near the trailing edge of the hydrofoil,which is attributed to the release of heat. Meanwhile,the wet region on the surface of the hydrofoil is obvious, hence most area of the hydrofoil is in a high temperature state at this moment. From t0+1/7Trefto t0+4/7Trefthe dramatic change of the temperatur e di stributio n on the su rfa ce of the hydrofoil is due tothethermaleffects,asisevidentfrom Fig.5. The temperature in the low temperature region on the hydrofoil surface increases and that in the high temperature region decreases, due to the development of the attached cavity and the collapse of the cavity downstream. Interestingly, the temperature in the cavitation core region is significantly lower due to the heat absorption by the high intensity vaporization.From t0+4/7Trefto t0+7/7Tref, the temperature in the low temperature region on the hydrofoil surface decreases with the breaking-off and the shedding of the cavity. However, the temperature in the core region of the cavity near the leading edge of the hydrofoil keeps a low value. As is shown, the distribution of the temperature on the hydrofoil surface is unsteady and is related to the cavity evolution characteristics.
The latent heat of the vaporization involved during the phase change makes the cavitation region somewhat colder than the surrounding liquid. A nominal temperature depressionwas introduced to quantify the thermal effects[14].
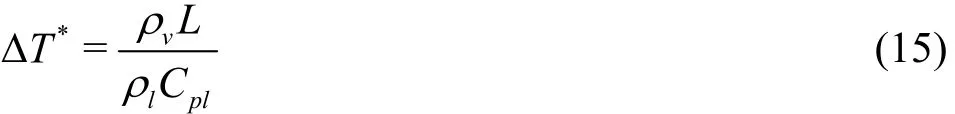
where L is the latent heat of the evaporation, and Cplis the specific heat.
Figure 6 compares the values of*Tfor different fluids, including the liquid nitrogen, the liquid hydrogen, the fluoroketone and the water at different temperatures[15,39,40]. It can be seen that for the water,a very high temperature is required to achieve a similar value of ΔT*as the liquid hydrogen and nitrogen. Hence, the thermal effects of the cavitation occurs in the room temperature water can be ignored and the cavitation can be assumed to be an isothermal process. For the isothermal cavitation in the water,both the pressure and the temperature on the body surface take constant values. However, the temperature depression yields substantially steeper pressure profiles on thesurface, which is accompanied withincreasing thermal Thus, the hydrodynamic
response to the temperature variations resulting from the phase change has a profound effect on the shedding of the cavitation. As shown in Fig.6, the values ofin the fluoroketonea is similar with those in the liquid hydrogen and nitrogen, which provides a possibility as a surrogate for cavitating flows involved thermal effects.

Fig.6 Values of Δ T * for liquid nitrogen, liquid hydrogen,fluoroketone and water at different temperatures
Based on the above analysis, Kelly and Segal[15]used the fluoroketone as a surrogate for fluid cryogens in their experiment. To estimate and verify the unique characteristics of these fluids, a more reasonable dimensionless thermal parameter ∑*was proposed by Watanabe et al.[41]. It is dependent on the physical properties of the fluid and its running conditions, and can be expressed as
whereLa is the thermal diffusivity of the liquid.
To verify the thermodynamic characteristics of the fluoroketone, the cavitating flows in the liquid nitrogen are selected for comparison and analysis. The free stream conditions of the numerical simulation for the cavitating flows in the fluoroketone and the liquid nitrogen are illustrated in Table1, based on Refs.[10]and [15]. The dimensionless thermal parameter*∑calculated in Table1 is based on Ref.[15] and the NIST data base Ref.[42]. It is worth noting that the value of the dimensionless thermal parameter*∑ for the fluoroketone is close to that of the liquid nitrogen.Hence, this explains why the fluoroketone is chosen as a surrogate for liquid cryogens to investigate the thermal effects on the cavitating flows[15,16].
To further analyze the thermal effects in different thermo-sensitive fluids, the dimensionless cavity area ratio of the calculated attached cavity Smax/Scand the temperature depression ratio (Δ Tmax/T∞)%for the fluoroketone and the liquid nitrogen are also shown in Table1 (where Smaxis the maximum attached cavity area on the hydrofoil surface, Scis the product of the hydrofoil chord and span, ΔTmaxis the maximum value of the temperature drop, T∞is the free stream temperature). The unsteady cavitating flows are investigated in a wide range of free stream temperatures (T∞=298 K, 303 K, 308 K), to further reveal the mechanism involved in the thermal cavitation. It is observed that the value of Smax/Scin the three cases in the fluoroketone decreases with the increase of the free stream temperature. It indicates that the thermal effect suppresses the occurrence and the development of the cavitating flow, especially at a low temperature. The value of Smax/Scin the liquid nitrogen is smaller than that in the fluoroketone,meanwhile, the temperature drop is more evident in the liquid nitrogen. Hence, it can be concluded that the thermal effect is more significant in the liquid nitrogen. Overall, the fluoroketone shows typical characteristics of the cryogenic cavitation, and the thermal effects play a significant role in the fluoroketone cavitating flows, just as in the liquid nitrogen.However, the thermal effect on the cavitating flows is associated with the physical properties of the fluid media and the temperature, in the case of the same free cavitation number.

Table 1 Free stream conditions and numerical results in fluoroketone and liquid nitrogen
2.2 Cavity shedding and dynamic evolution characteristics
This section discusses the details of the unsteady cavitating flows in the liquid nitrogen over a hydrofoil at the cavitation number of σ=0.7, to better understand the physical mechanism that governs the structures and the dynamics of the unsteady sheet/cloud cavitating flows. Three z-slices (z/ c = 0,z/ c=-0 .6, z/ c = 0.6) along the span direction are defined in Fig.7 for further analysis. Figures 8-11 show the predicted cavity shape, vorticity, pressure coefficient,and streamline at representative instantaneous times in one cycle, based on the numerical results of 2-D and 3-D flows, r es pective ly.

Fig.7 Illustration of slices along the spanwise direction

Fig.8 (Color online) Instantaneous vorticity, cavity shape and pressure coefficient distributions at 17% cycle time
Fig.9 (Color online) Instantaneous vorticity, cavity shape and pressure coefficient distributions at 47% cycle time
Figure8showsthe results at 17% cycle time. As shown in Fig.8(a), a small partially-attached sheet cavity develops near the leading edge, and the cloud cavity formed in the last cycle is clearly visible near the trailing edge. Obviously, the cavity around the hydrofoil along the main flow and span directions shows a distinct unsteady feature. At the same time,the z-component vorticity ((Ωz= ∂ u / ∂ y - ∂v / ∂ x ))contour of different slices inside the cavity can be seen as a band of cloud. As shown in the zoomed out contour, we can find that the vorticity (“+ ”)production is concentrated in the near-wall area.Interestingly, the vorticity (“+”) production increases near the trailing edge. However, a strong vorticity(“- ”) production appears far from the hydrofoil wall,and the area is larger than that of the positive vorticity.As shown in Fig.8(b), a large clockwise streamline vortex can be observed near the trailing edge, caused by the cavity shedding. Fig.8(c) illustrates the surface pressure coefficients around the hydrofoil on three different slices. The pressure sees a significant fluctuation in the closure regions (① in Fig.8(c)) of the attached sheet cavity and the cloud cavity downstream.The pressure peak values on these three hydrofoil slices are different from each other. Meanwhile,positive and negative values of d/dp x are found around the hydrofoil, which is responsible for the cavitation development and transition.

Fig.10 (Color online) Instantaneous vorticity, cavity shape and pressure coefficient distributions at 63% cycle time
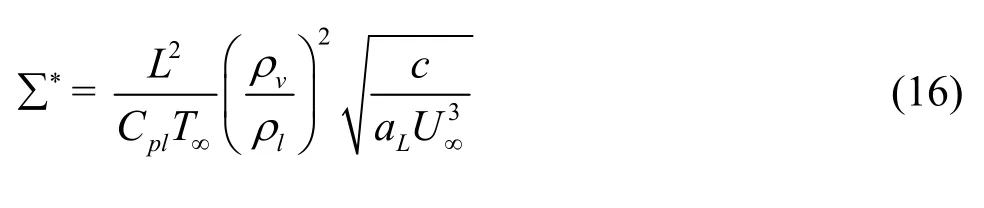
Figure 9 shows the results at 47% cycle time. It is clear that the attached cavity approaches its maximum length, meanwhile, this instantaneous time is the initial stage of breakup and shedding of the cavity near the trailing edge. As shown in Fig.9(a), the flow field inside the cavity is relatively stable. The positive and negative vorticities appear more unsteady downstream the trailing edge, which indicates that the vortex structures can be seen obviously in this region.From the streamline distribution in Fig.9(b), it can be observed that a small clockwise streamline appears near the trailing edge and the vortex shedding occurs not far from the trailing edge. As shown in Fig.9(c),the adverse pressure gradient is obvious near the trailing edge (② in Fig.9(c)) and is strong enough to overcome the flow near the wall region. As a result, a re-entrant jet forms and pushes the flow toward upstream.

Fig.11 (Color online) Instantaneous vorticity, cavity shape and pressure coefficient distributions at 83% cycle time
Figure 10 shows the results at 63% cycle time.As shown in Fig.10(a), the re-entrant jets continue to move toward the leading edge of the hydrofoil,followed by the breakup of the attached cavity.Consequently, a positive high-value vorticity zone is observed near the trailing edge of the hydrofoil.Meanwhile, a strong interaction takes place between the positive high-value vorticity and the negative high-value vorticity. As a result, a clockwise vortex forms on the suction side of the hydrofoil, as is shown in Fig.10(b). Compared to the pressure results shown in Fig.10(c), the surface pressure coefficient near the trailing edge as an adverse pressure gradient against the favorable pressure gradient (③ in Fig.10(c))causes the cloud cavity near the trailing edge to move downstream. Additionally, it is interesting to note that the higher pressure occurs due to the cavity collapse in the closure region (④ in Fig.10(c)).
Figure 11 shows the results at 83% cycle time. In Fig.11(a), a large-scale shedding in the rear of the attached cavity is observed and a high intensity vorticity appears near the hydrofoil. For this sheet/cloud cavitating flow, the vertical zone is thicker than the results from previous time steps. From the streamline distribution in Fig.11(b), it can be concluded that a large flat streamline vortex forms on the suction side of the hydrofoil, which corresponds to the evolution of the cavitation. As shown in Fig.11(c), the pressure coefficient at the trailing edge still appears as an adverse pressure gradient. On the other hand, the current pressure at the closure region of the attached cavity is much higher than that at 63% cycle time.These results at different stages of one cycle, suggest that the evolution of the cavitating flow is closely related to the complicated vortex structure, and the distributions of the pressure around the hydrofoil appear to be a major factor in triggering the unsteady sheet/cloud cavitation.
From Figs.8-11, it is interesting to note a relationship between the surface pressure evolution and the thermal cavitation. The surface pressure coefficient Cpin the cavitation region near the leading edge is lower than -0.7. In other words, the local cavitation number inside the cavity is larger than the cavitation number corresponding to the freestream temperature.It is well known that the cavitation is defined astion, the vapor pressure pvin the cavitation region corresponds to the local temperature. Therefore, the local temperature drop in the thermal cavitation will produce a noticeable rise of the local cavitation number. As a result, the cavitation intensity is suppressed and subsequently the evolution of the thermal cavitation becomes more complex.
2.3 Transition characteristics of unsteady cavitating flows
The previous analysis shows that the formation,the development, the shedding and the collapse of unsteady cavitating flows contribute to the force on the hydrofoil, or in other words, the hydrodynamic characteristics are closely associated with the types of cavitation. Theoretical and experimental studies of the unsteady cavitating flows over a hydrofoil with an angle of attack in the water have shown a significant periodicity in the oscillation of the lift coefficient. The occurrence of the varied cavitation is associated with the different combination of parameters in the cavitation number and the angle of attack σ/2α,where α is in radian. According to the relationship between σ/2α and the Strouhal number St(where St = fc/ V∞, and f, c and V∞are the frequency of the vortex shedding, the chord length and t h e inletvelocity, respectively), thetypesof o s c illatorybehavior suggested by] include(1)1.0≤ σ / 2 α ≤ 4 .0: a strong spectral peak exists at a Strouhal number, and St is found to be a constant,varying in the range of 0.06-0.30, (2) 4.0≤σ/2α≤6.0: the cavitating flow appears as a partial oscillation, and the frequency f is almost a linear function of σ/2α A sharp transition from type I to type II of the cavitating flow in the water can be found at σ/ 2 α = 4.0.
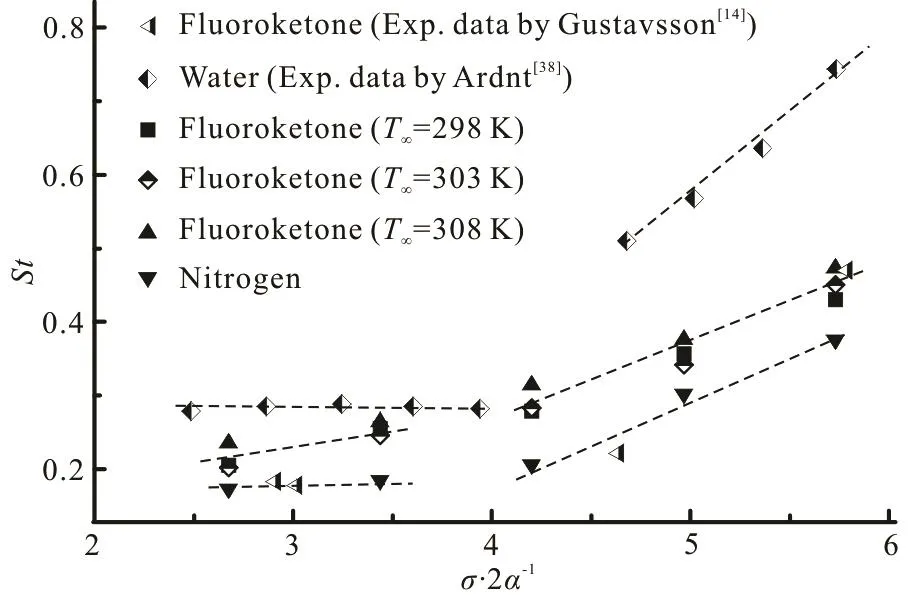
Fig.12 Relationship between the predicted and measured Strouhal numbers and /2σα in different fluids
In order to discuss the applicability of the abovementioned division of the thermo-sensitive fluids,Fig.12 illustrates the relationship between St and σ/ 2 α for the cavitating flow around the hydrofoil in the water, the fluoroketone and the liquid nitrogen.For the liquid nitrogen shown in Fig.12, the Strouhal number remains approximately constant with the values of σ/2α being 2.67 and 3.44. Specially, the constant value in the liquid nitrogen is smaller than that in the water. Moreover, the Strouhal number increases almost linearly over a range of 4.20≤σ/ 2 α ≤ 5 .73. Meanwhile, as shown in Fig.12, for the fluoroketone at different ambient temperatures, the Strouhal number increases almost linearly with the increase of σ/2α. However, the slope changes slightly from the range of 2.67 ≤ σ /2α ≤3.44 to 4.20 ≤ σ / 2 α ≤5.73. This predicted trend is consistent with the experimental observation in the Ref.[14](as shown in Fig.12). The results presented in Fig.12 demonstrate that the classification method based on the cavitating flows in the water is not yet effective to assess the transition of the cavitation in thermosensitive fluids. As is known, the liquid nitrogen and the fluoroketone are more thermally sensitive than the water during the phase-change process of the cavitation, and the liquid nitrogen is the most thermally sensitive among these three fluids. The above results indicate the thermal effect on the distribution of the Strouhal number. With the increase of the thermal effect (the temperature drop ratio in Table 1) there is a depression of the Strouha l numb er due to the lo cal temperature drop. In otherwords,comparisonsofca-vitating flows in the fluoroketone ( V∞=7.5 m/s,σ= 0.7) and the liquid nitrogen ( V∞= 2 2.4 m/s,σ= 0.7), further show that the strong thermal effects will lead to the shedding cavitation, dominated by relatively high frequency oscillations.
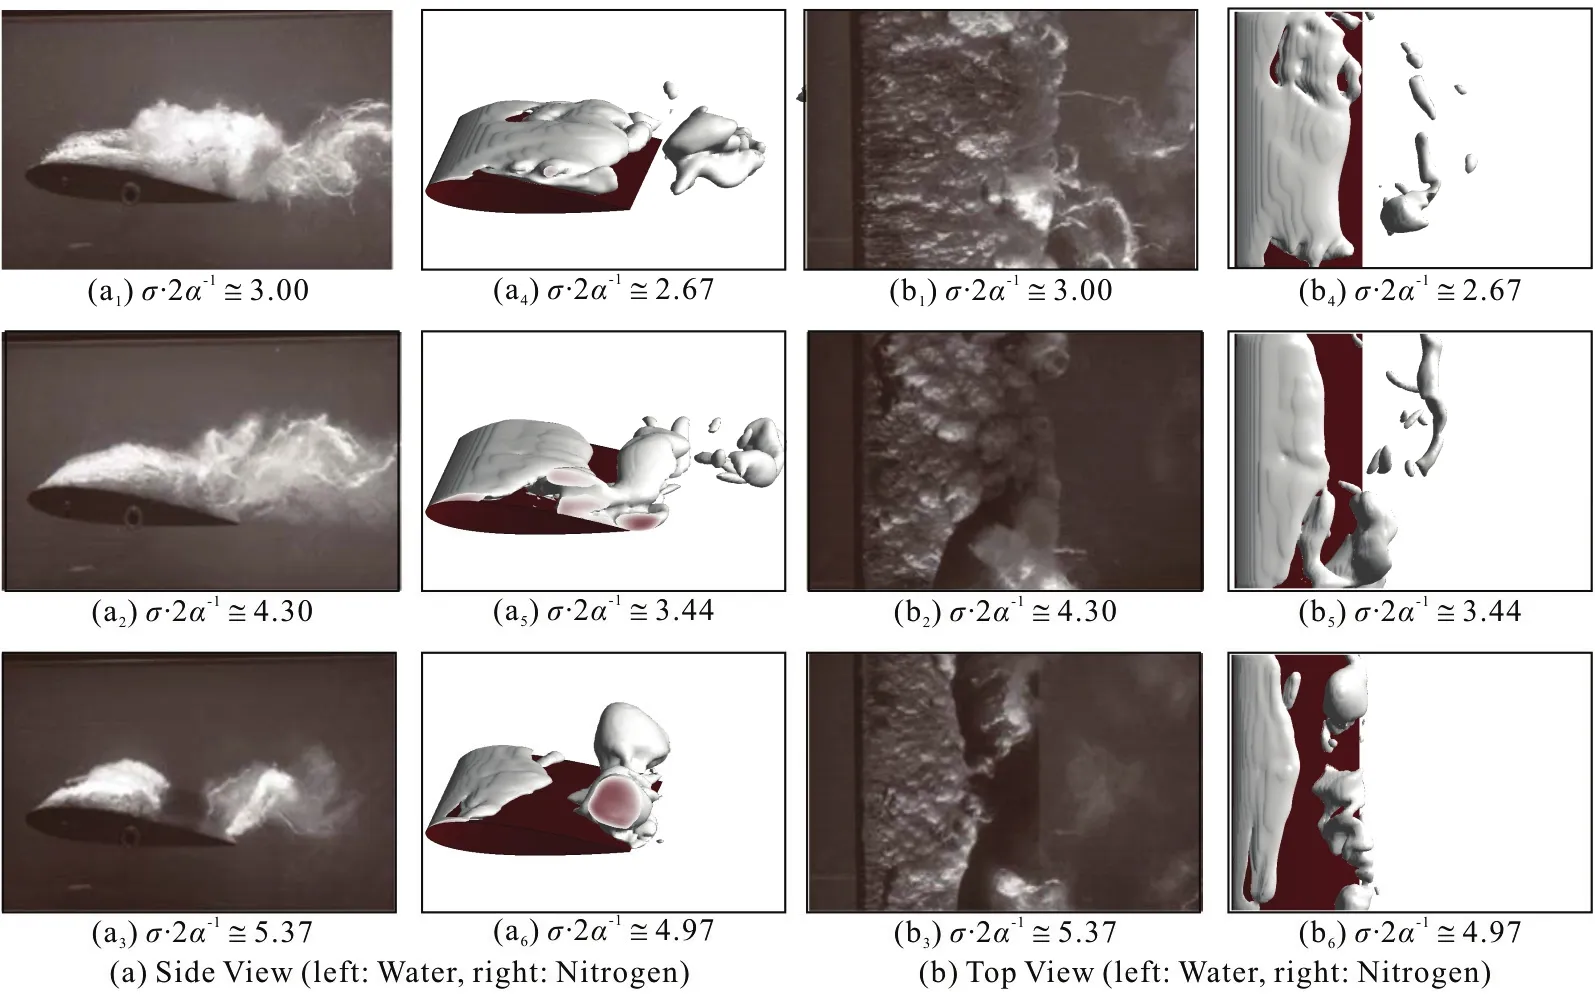
Fig.13 (Color online) Comparison of cloud cavitation characteristics with σ /2α in water[43] and liquid nitrogen
To further investigate the cavity transition due to the thermal effects, Fig.13 shows the comparisons between the cavity variation and different values of σ/ 2 α in the water and the liquid nitrogen. It is interesting to note that for these two liquids, the formation of large vortices occurs near the trailing edge of the sheet. The horseshoe vortices are more evident in the fluoroketone in Fig.13. It can be seen that the length of the attached cavity decreases with the increase of σ/2α. Note that the thickness of the attached cavity around the hydrofoil, the cloud cavity near the trailing edge and the cavity shape along the span direction show a dramatical variation for different values of σ/2α. It indicates that the cavitating flows are substantially different for varied fluid properties. For a similar shape and scale, the value of is smaller in the liquid nitrogen, as compared to those in the water and the fluoroketone. Hence, the thermal effect suppresses the development of the cavitation behaviors, and a smaller value of σ/2α is required for the thermo-sensitive fluid to achieve a similar cavitation transition in the water.
3. Conclusions
In the present study, a numerical study of the unsteady sheet/cloud cavitation over a hydrofoil in thermo-sensitive fluids is presented. The numerical framework is based on a thermal equilibrium between the liquid and the vapor in the cavitation region, the thermal effects due to the phase change are accounted for the cavitating flows, and the fluid thermodynamic properties are specified as functions of temperature.The energy equation is solved in conjunction with the mass and momentum conservation equations, meanwhile, a thermal cavitation model and a PANS turbulence model are used to capture the thermal effects and the unsteady behaviors. The numerical study is presented for a NACA0015 hydrofoil with the angle of attack α = 7.5oin the fluoroketone and the liquid nitrogen with a wide range of cavitation numbers to reveal the unsteady characteristics of the cavitating flows with the thermal effects involved. The main conclusions of this study are as follows:
(1) The numerical results show a good agreement with the experimental measurements. The temperature distribution and the evolution exhibit significant unsteady characteristics along the main flow and span directions of the hydrofoil, which is related to the cavity evolution. Specially, the temperature distribution in the core region of the cavity near the leading edge of the hydrofoil keeps in a low level.
(2) The thermal effect on the cavitating flows is associated with the physical properties of the fluid media and the temperature under the conditions of the same free cavitation number. The attached wet cavity in the liquid nitrogen is smaller than that in the fluoroketone, meanwhile, the temperature drop is more evident in the liquid nitrogen. Interestingly, the thermal effect suppresses the occurrence and the development of the cavitating flow, especially at a low temperature for the fluoroketone.
(3) The significant thermal effects are found on the cavitation dynamics characteristics in the thermosensitive fluids. The evolution of the cavitating flow is closely related to the complicated vortex structure,and the distributions of the pressure around the hydrofoil are a major factor for triggering the unsteady sheet/cloud cavitation.
(4) The variable fluid properties are shown to substantially alter the transition characteristics of the cavitating flows. The combination parameter of the cavitation number and the angle of attack /2σα based on the cavitating flow in the water is not effective to assess the transition of the cavitation in thermo-sensitive fluids. The thermal effect suppresses the development of the cavitation behaviors, a small value of /2σα is required for the thermo-sensitive fluid to achieve a similar cavitation transition as that in the water.
[1] Brennen C. E. Cavitation and bubble dynamics [M].Cambridge, UK: Cambridge University Press, 2013.
[2] Ohira K., Nakayama T., Nagai T. Cavitation flow instability of subcooled liquid nitrogen in converging-diverging nozzles [J]. Cryogenics, 2012, 52(1): 35-44.
[3] Watanabe S., Hidaka T., Horiguchi H. et al. Analysis of thermodynamic effects on cavitation instabilities [J].Journal of Fluids Engineering, 2007, 129(9): 1123-1130.
[4] Kubota A., Kato H., Yamaguchi H. A new modelling of cavitating flows: a numerical study of unsteady cavitation on a hydrofoil section [J]. Journal of Fluid Mechanics,1992, 240: 59-96.
[5] Wang G., Senocak I., Shyy W. et al. Dynamics of attached turbulent cavitating flows [J]. Progress in Aerospace Sciences, 2001, 37(6): 551-581.
[6] Peng X. X., Ji B., Cao Y. et al. Combined experimental observation and numerical simulation of the cloud cavitation with U-type flow structures on hydrofoils [J].International Journal of Multiphase Flow, 2016, 79:10-22.
[7] Goncalvès E., Patella R. F. Numerical study of cavitating flows with thermodynamic effect [J]. Computers and Fluids, 2010, 39(1): 99-113.
[8] Stahl H. A., Stepanoff A. J. Thermodynamic aspects of cavitation in centrifugal pumps [J]. Journal of Basic Engineering, 1956, 78(8): 1691-1693.
[9] Sarosdy L. R., Acosta A. J. Note on observations of cavitation in different fluids [J]. Transactions of the ASME,1961, 83(3): 399-400.
[10] Hord J. Cavitation in liquid cryogens II -Hydrofoil [R].1973, NASA CR-2156
[11] Hord J. Cavitation in liquid cryogens III -Ogives [R].1973, NASA CR-2242
[12] Franc J. P., Rebattet C., Coulon A. An experimental investigation of thermal effects in a cavitating inducer [J].Journal of Fluids Engineering, 2004, 126(5): 716-723.
[13] Niiyama K., Yoshida Y., Hasegawa S. et al. Experimental investigation of thermodynamic effect on cavitation in liquid nitrogen [C]. Proceedings of the Eighth International Symposium on Cavitation (CAV2012). Singapore,2012, 153-157.
[14] Gustavsson J. P., Denning K. C., Segal C. Hydrofoil cavitation under strong thermodynamic effect [J]. Journal of Fluids Engineering, 2008, 130(9): 091303.
[15] Kelly S. B., Segal C. Experiments in thermo-sensitive cavitation of a cryogenic rocket propellant [D]. Doctoral Thesis, Gainesville, USA: Dissertation of University of Florida, 2012, 97-99.
[16] Kelly S., Segal C. Characteristics of thermal cavitation on a two-dimensional hydrofoil [J]. Journal of Propulsion and Power, 2013, 29(2): 410-416.
[17] Singhal A. K., Athavale M. M., Li H. et al. Mathematical basis and validation of the full cavitation model [J].Journal of Fluids Engineering, 2002, 124(3): 617-624.
[18] Merkle C. L., Feng J., Buelow P. E. O. Computational modeling of the dynamics of sheet cavitation [C]. 3rd International Symposium on Cavitation. Grenoble, France.1998, 2: 47-54.
[19] Kunz R. F., Boger D. A., Stinebring D. R. et al. A preconditioned Navier-Stokes method for two-phase flows with application to cavitation prediction [J]. Computers and Fluids, 2000, 29(8): 849-875.
[20] Zwart P. J., Gerber A. G., Belamri T. A two-phase flow model for predicting cavitation dynamics [C]. Fifth International Conference on Multiphase Flow. Yokohama,Japan, 2004.
[21] Hosangadi A., Ahuja V. Numerical study of cavitation in cryogenic fluids [J]. Journal of Fluids Engineering, 2005,127(2): 267-281.
[22] Tseng C. C., Shyy W. Modeling for isothermal and cryogenic cavitation [J]. International Journal of Heat and Mass Transfer, 2010, 53(1): 513-525.
[23] Tseng C. C., Wei Y., Wang G. et al. Modeling of turbulent,isothermal and cryogenic cavitation under attached conditions [J]. Acta Mechanica Sinica, 2010, 26(3):325-353.
[24] Yu A., Luo X. W., Ji B. et al. Cavitation simulation with consideration of the viscous effect at large liquid temperature variation [J]. Chinese Physics Letters, 2014,31(8): 086401.
[25] Huang B., Wu Q., Wang G. Numerical investigation of cavitating flow in liquid hydrogen [J]. International Journal of Hydrogen Energy, 2014, 39(4): 1698-1709.
[26] Sun T. Z., Ma X. F., Wei Y. J. et al. Computational modeling of cavitating flows in liquid nitrogen by an extended transport-based cavitation model [J]. Science China Technological Sciences, 2016, 59(2): 337-346.
[27] Chen T., Huang B., Wang G. et al. Numerical investigation of thermo-sensitive cavitating flows in a wide range of free-stream temperatures and velocities in fluoroketone[J]. International Journal of Heat and Mass Transfer,2017, 112: 125-136.
[28] Mani K. V., Cervone A., Hickey J. P. Turbulence modeling of cavitating flows in liquid rocket turbopumps [J].Journal of Fluids Engineering, 2017, 139(1): 011301.
[29] Zhu J., Zhao D., Xu L. et al. Interactions of vortices,thermal effects and cavitation in liquid hydrogen cavitating flows [J]. International Journal of Hydrogen Energy, 2016, 41(1): 614-631.
[30] Girimaji S. S. Partially-averaged Navier-Stokes model for turbulence: A Reynolds-averaged Navier-Stokes to direct numerical simulation bridging method [J]. Journal of Applied Mechanics, 2006, 73(3): 413-421.
[31] Jeong E., Girimaji S. S. Partially averaged Navier-Stokes(PANS) method for turbulence simulations-flow past a square cylinder [J]. Journal of Fluids Engineering, 2010,132(12): 121203.
[32] Cheng H., Long X., Ji B. et al. Numerical investigation of unsteady cavitating turbulent flows around twisted hydrofoil from the Lagrangian viewpoint [J]. Journal of Hydrodynamics, 2016, 28(4): 709-712.
[33] Liu J. T., Guo P. C., Chen T. J. et al. The influence of nonlinear shear stress on partially averaged Navier-Stokes(PANS) method [J]. Journal of Hydrodynamics, 2017,29(3): 479-484.
[34] Laberteaux K. R., Ceccio S. L. Partial cavity flows. Part 1.Cavities forming on models without spanwise variation [J].Journal of Fluid Mechanics, 2001, 431: 1-41.
[35] Arndt R. E. A. Some remarks on hydrofoil cavitation [J].Journal of Hydrodynamics, 2012, 24(3): 305-314.
[36] Ji B., Long Y., Long X. et al. Large eddy simulation of turbulent attached cavitating flow with special emphasis on large scale structures of the hydrofoil wake and turbulence-cavitation interactions [J]. Journal of Hydrodynamics, 2017, 29(1): 27-39.
[37] Ganesh H., Mäkiharju S. A., Ceccio S. L. Bubbly shock propagation as a mechanism for sheet-to-cloud transition of partial cavities [J]. Journal of Fluid Mechanics, 2016,802: 37-78.
[38] Arndt R. E. A., Song C. C. S., Kjeldsen M. et al. Instability of partial cavitation: A numerical/experimental approach [C]. Proceedings of 23rd of Symposium on Naval Hydrodynamics. Val deReuil, France, 2000.
[39] Franc J. P. The Rayleigh-Plesset equation: A simple and powerful tool to understand various aspects of cavitation[M]. Vienna, Austria: Springer, 2007, 22-24.
[40] De Giorgi M. G., Bello D., Ficarella A. Analysis of thermal effects in a cavitating orifice using Rayleigh equation and experiments [J]. Journal of Engineering for Gas Turbines and Power, 2010, 132(9): 092901.
[41] Watanabe S., Hidaka T., Horiguchi H. et al. Analysis of thermodynamic effects on cavitation instabilities [J].Journal of Fluids Engineering, 2007, 129(9): 1123-1130.
[42] Lemmon E. W., Huber M. L., McLinden M. O. NIST reference fluid thermodynamic and transport properties[R]. NIST Standard Database 23 version 7.0, 2002.
[43] Tropea C., Yarin A. L., Foss J. F. Springer handbook of experimental fluid mechanics [M]. New York, USA:Springer, 2007.
猜你喜欢
杂志排行

水动力学研究与进展 B辑的其它文章
- Editorial Message
- ICHD’ 2018 The 13th International Conference on Hydrodynamics First Announcement September 2-6, 2018 Sheraton Grand Inchecon Hotel Songdo, Incheon Korea
- Compressible effect on the cavitating flow: A numeric study *
- Design and experiment of the centrifugal pump impellers with twisted inlet vice blades *
- Two timescales for longitudinal dispersion in a laminar open-channel flow *
- Numerical simulation of a two-dimensional flapping wing in advanced mode *