基于ROV的近海底地形测量及其在马努斯盆地热液区的应用
2017-03-09马小川栾振东张鑫郑翠娥阎军孙大军
马小川,栾振东,张鑫,郑翠娥,阎军*,孙大军
(1.中国科学院海洋研究所 海洋地质与环境重点实验室,山东 青岛266071;2.哈尔滨工程大学 水声工程学院,黑龙江 哈尔滨 150001)
基于ROV的近海底地形测量及其在马努斯盆地热液区的应用
马小川1,栾振东1,张鑫1,郑翠娥2,阎军1*,孙大军2
(1.中国科学院海洋研究所 海洋地质与环境重点实验室,山东 青岛266071;2.哈尔滨工程大学 水声工程学院,黑龙江 哈尔滨 150001)
针对重点的特殊深海研究区(如热液冷泉、洋中脊区域),在船载多波束数据获得研究区大面积地形资料的基础上,有必要选取典型深海小靶区进行高分辨率地形测量为进一步深入研究提供保障。根据船载多波束实测数据选取PACMANUS热液区作为靶区,基于长基线定位,利用“发现”ROV搭载多波束系统进行近海底全覆盖地形测量。结果表明,依托于船动力定位系统及差分GPS,长基线为ROV提供了可靠的高精度定位,使得近海底测量的地形数据分辨率数倍优于船载多波束测得的地形数据的分辨率。高分辨率地形清晰的显示了PACMANUS热液区锥形丘体等特殊微地形,与已发现的热液点和火山区有很好的对应。进一步分析发现,该区域活动的热液区主要发育于坡度大于30°斜坡上的地形突变区,其成因仍需深入研究。利用ROV搭载多波束近底测量是获取深海小靶区高分辨率地形的可靠途径和方法,有利于提高深海海底研究的针对性,将促进我国深海科学研究的发展。
地形测量;高分辨率;ROV;热液;马努斯盆地
1 引言
自从第一幅综合的全球海底地形图[1]发布以来,海底地形数据成为全球海洋研究特别是海洋地质研究的重要参考。近年来,随着水深测量技术的不断发展及科考项目的实施,全球海洋海底地形数据得到进一步更新[2—3]的同时,热点海域的海底地形也获得精细的测量和研究[4—7]。特别是针对深海海底发育的特殊地质现象,如洋中脊、海山、热液冷泉、海底峡谷等,高分辨率海底地形的测量不仅为认识这些现象提供了直接的途径,也为深入研究这些地质现象提供了必要的基础资料[8],进而帮助我们更好地理解地球动力演化、深海生态系统以及海底沉积过程。特别是ROV(Remoted Operated Vehicle)和AUV(Autonomous Underwater Vehicle)应用技术的快速发展,使得我们能够更近距离地观测海底现象,这拓展了我们的研究区域并促进了深海研究的进一步发展[9—12],一些重点研究区海底地形的分辨率已经达到了亚米级[13—14]。然而由于技术水平的制约,我国的相关研究起步较晚,特别是高分辨率地形数据较为缺乏,影响了我们对近海底特殊现象的深入理解。
一般来讲,在深海海域,船载多波束系统所获得的海底地形数据的分辨率最高可以达到50 m[15]。由于船载多波束测量系统拥有较宽的覆盖率和高效的测量方式,目前是大面积水深测量的优先选择[12]。但在某些重点研究区域,由于一些海底地质现象如冷泉、热液系统发育的范围较集中,数十米分辨率的数据难以精细描述热液或冷泉发育区的地形,不能为深入的研究目标提供精确指引。因此,有必要根据研究目标进一步确定重点典型研究靶区进行精细测量。本文阐述了基于ROV近海底测量高分辨地形的方法,通过2015年5-7月在西太平洋马努斯盆地的实践和应用,获得了PACMANUS热液区的高分辨率地形并进行分析。
2 研究区概况
马努斯海盆位于西太平洋俾斯麦海的东部(图1),巴布亚新几内亚的北部,是一个快速扩张的弧后盆地,平均水深2 000 m。本文的研究区位于东马努斯盆地,位于Weitin转换断层和Djaul转换断层之间[16],是一个岛弧张裂区,该区域扩张速度可以达到137.5 mm/a,是俾斯麦海中扩张速率最高的区域[17]。该区域发育了多个热液区,包括Vienna Woods热液区[18]、PACMANUS热液区[7,19—22]、DESMOS热液区[23—25]和SuSu Knolls热液区[26],是研究现代海底热液系统的典型区域和热点区域[27—28]。自从该区域的热液区被发现以来的20多年间,研究者通过获得的一系列沉积物、岩石、海底环境参数等数据,对该区域的活动热液系统在地球化学、岩石组成、热液过程等方向做了详细的研究[29—31]。然而,这些研究多局限在地球化学等专业领域,对研究区地形的细节少有关注,尽管这些资料是进行深入研究的重要基础。目前,针对该区域的精细地形地貌的报道也极少出现[7]。船载多波束测量是测量海底地形的有效手段,但受船速等因素的限制在深海区域其分辨率最高仅有数十米,远不能达到精细描述特定靶区地形特征的目的。由于技术手段的制约,我国多采用船载多波束或深拖的方式进行地形测量,2007年中国大洋调查航次在西南印度洋脊利用美国伍兹霍尔研究所ABE水下机器人进行了热液区的地形测绘[32],然而,目前为止尚未有基于ROV的深海小靶区(如热液区)近海底高分辨率地形测量及分析的相关研究报道。
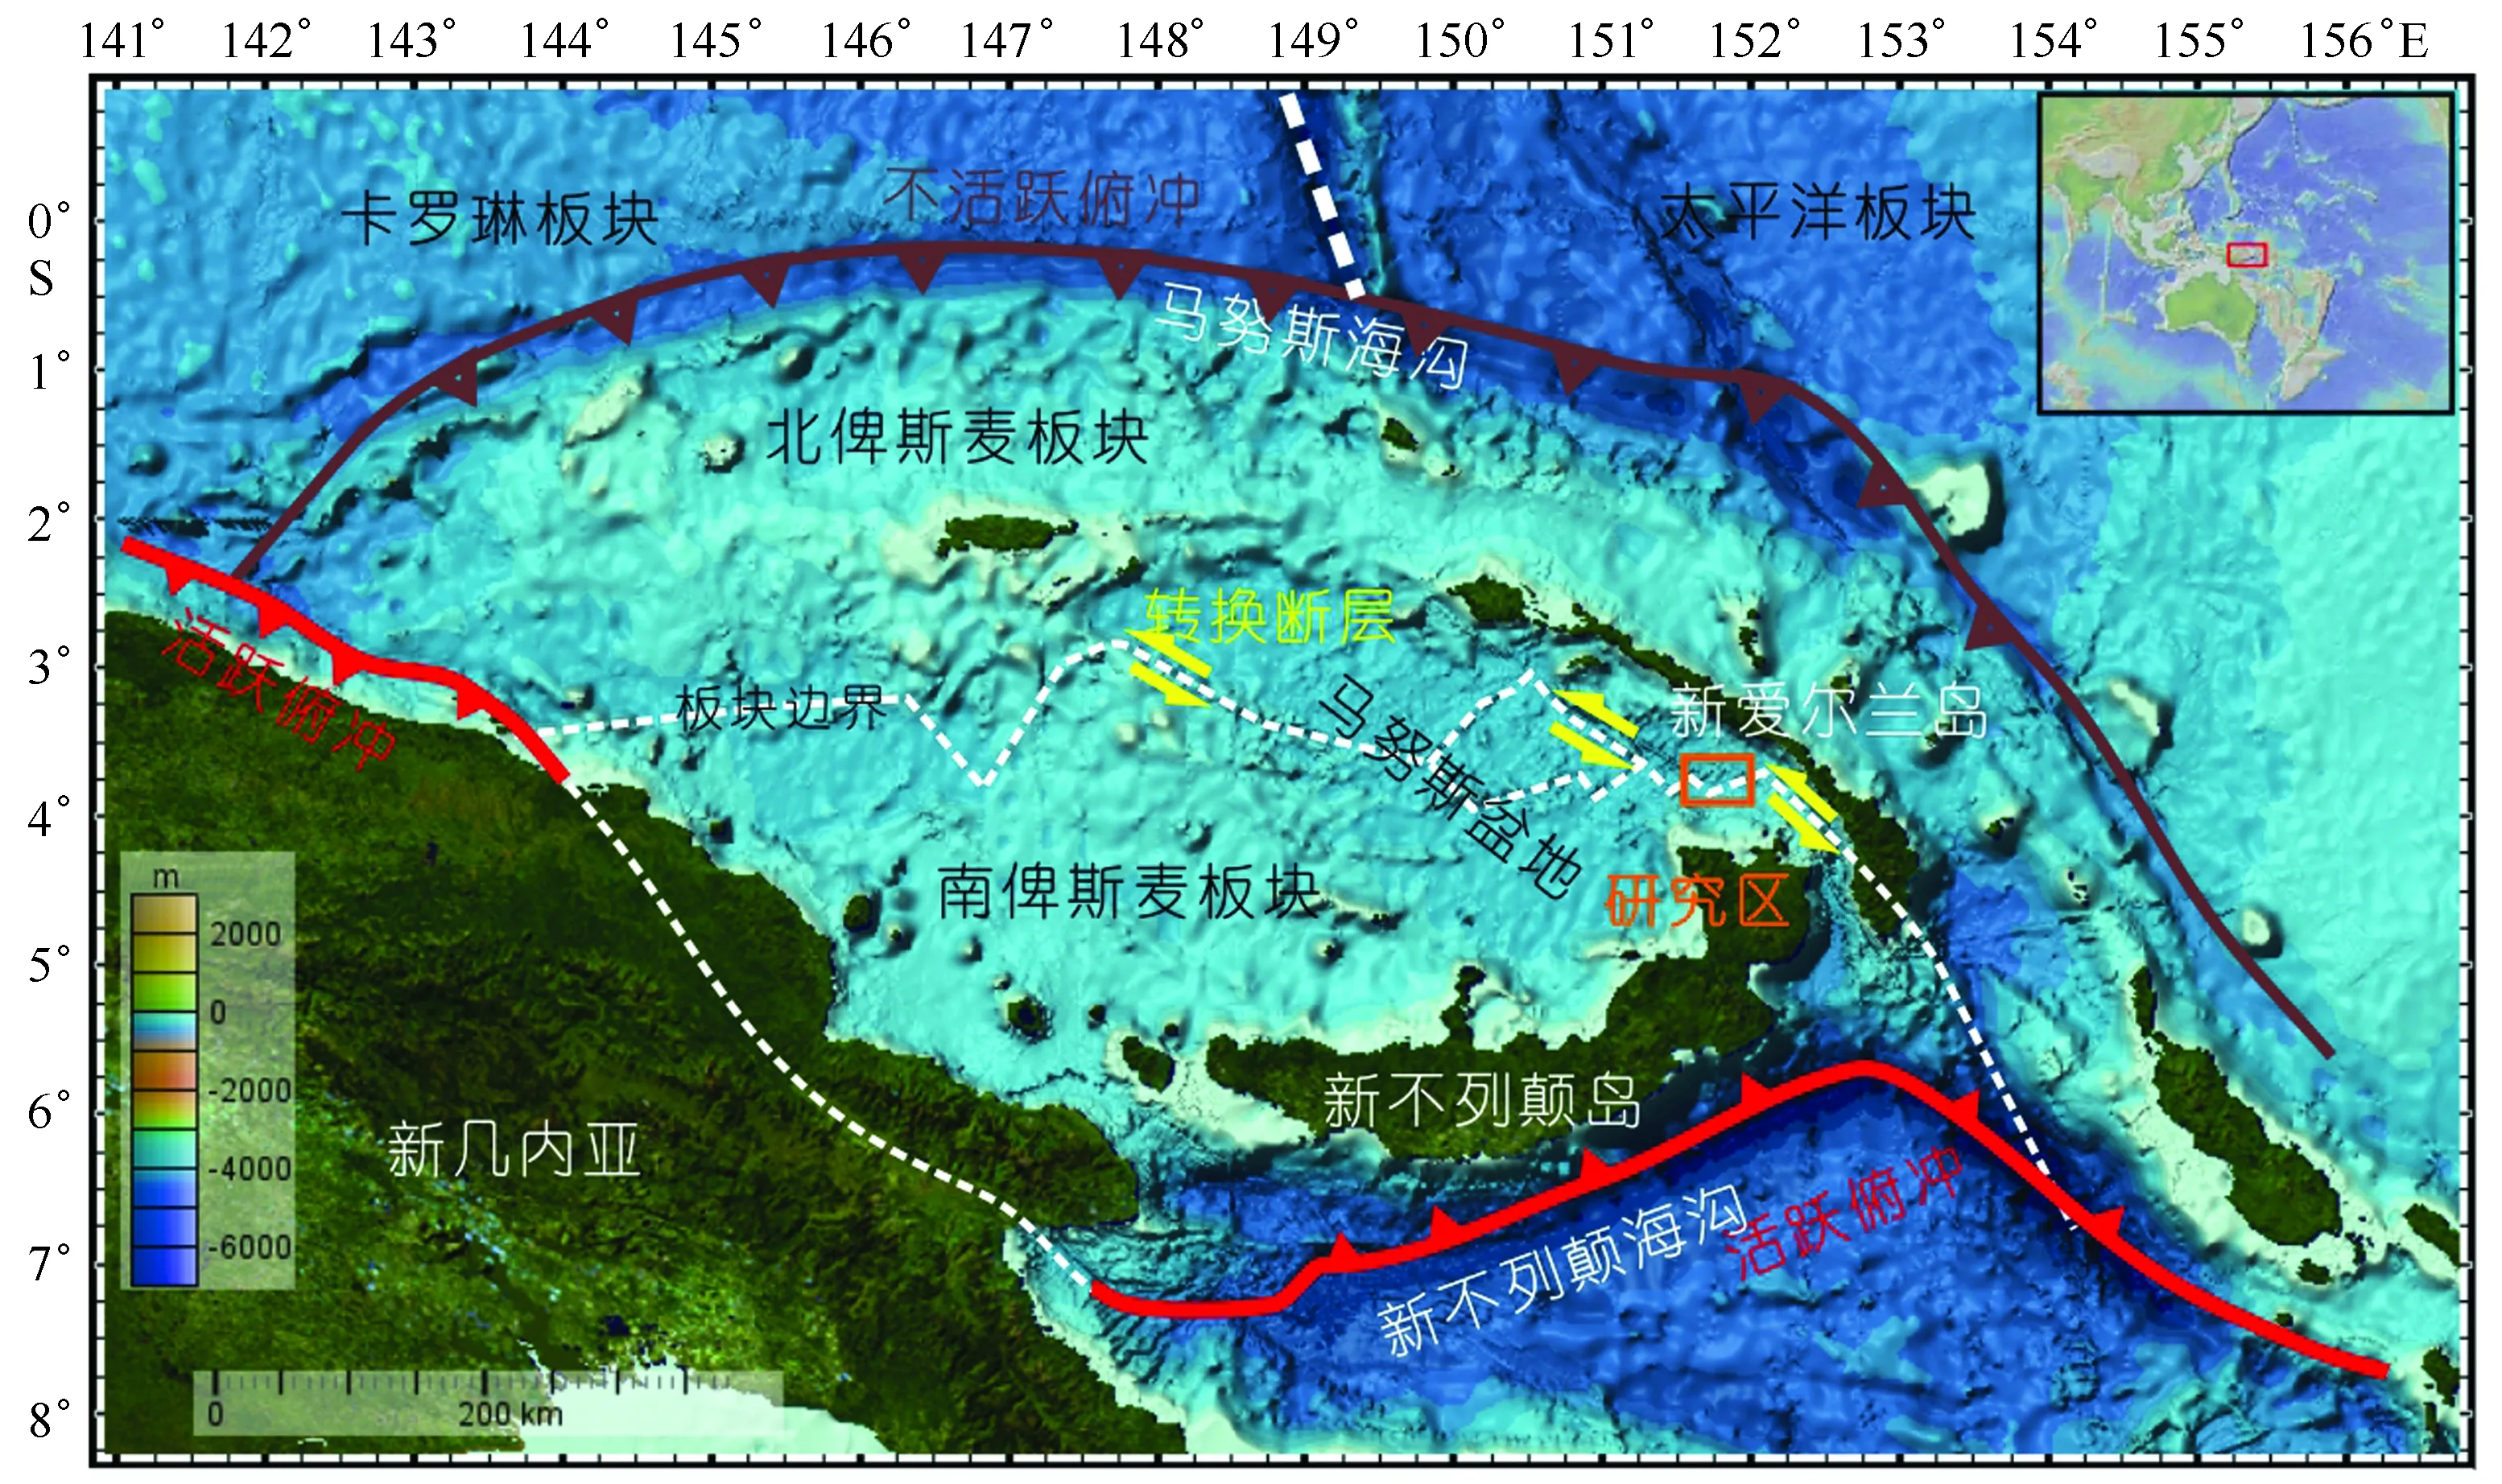
图1 研究区位置Fig.1 Location of the study area
3 基于ROV的近底地形测量方法
深海小靶区的高分辨率地形数据是基于船载多波束实测数据,并最终利用ROV或AUV搭载多波束系统进行近底测量来获得的(图2)。2015年5-7月,受中国科学院先导专项项目资助,中国科学院海洋研究所于2015年5-7月在马努斯盆地研究区利用“科学”考察船搭载的多波束系统(Seabeam3012)采集水深地形数据。船载多波束测量时船的定位依靠差分GPS定位,定位精度优于1 m,但是由于水深较深,波束有限,而且数据分辨率受船速和波束开角的共同影响,船速越高,波束开角越大,所获得地形的分辨率越差[15],获得的地形数据分辨率通常低于数十米。考虑的大面积调查的经济性,我们在研究区选择5节航速,90°波束开角进行船载多波束全覆盖测量。
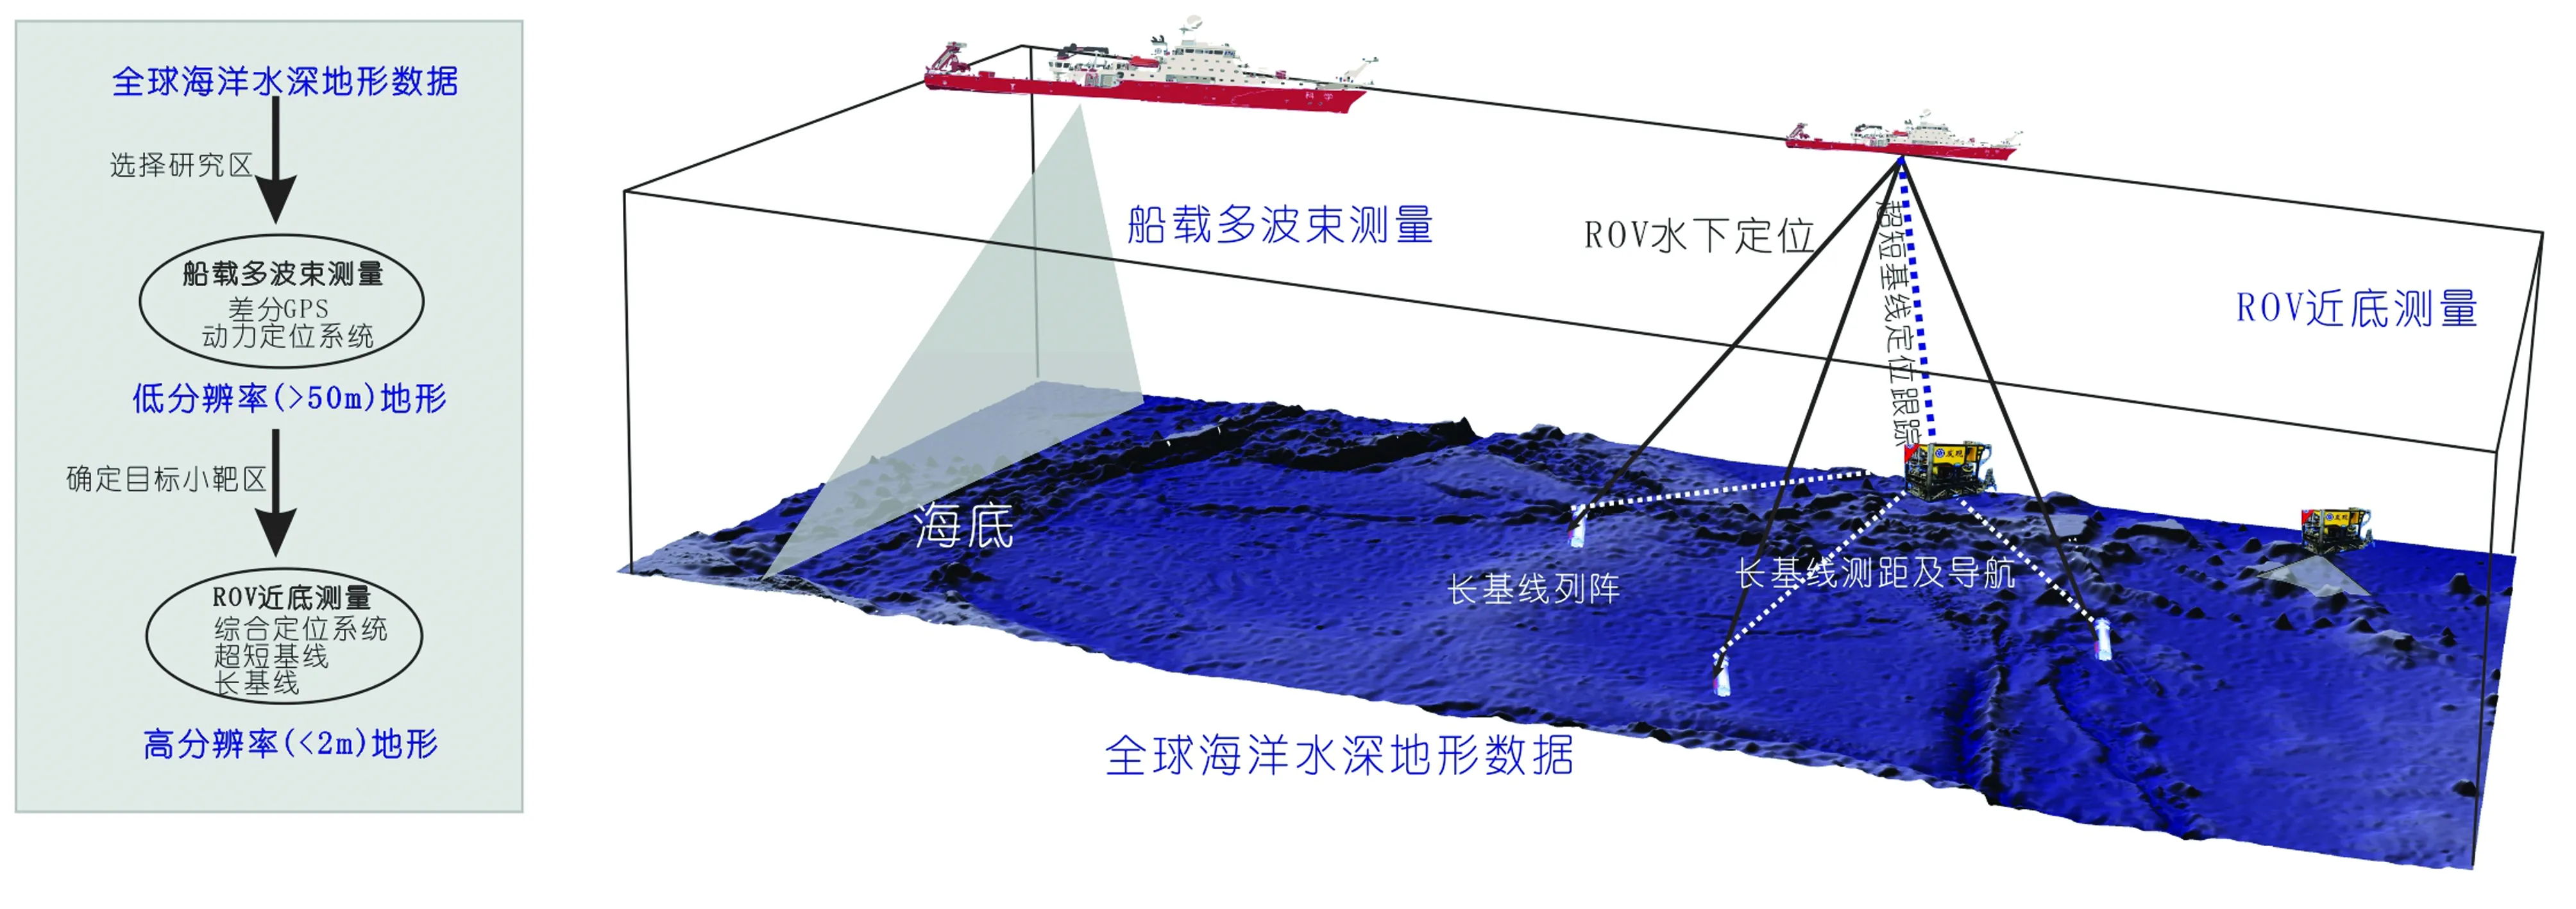
图2 深海小靶区选择及高分辨率地形测量Fig.2 Target area selection and high-resolution measurement for the topography
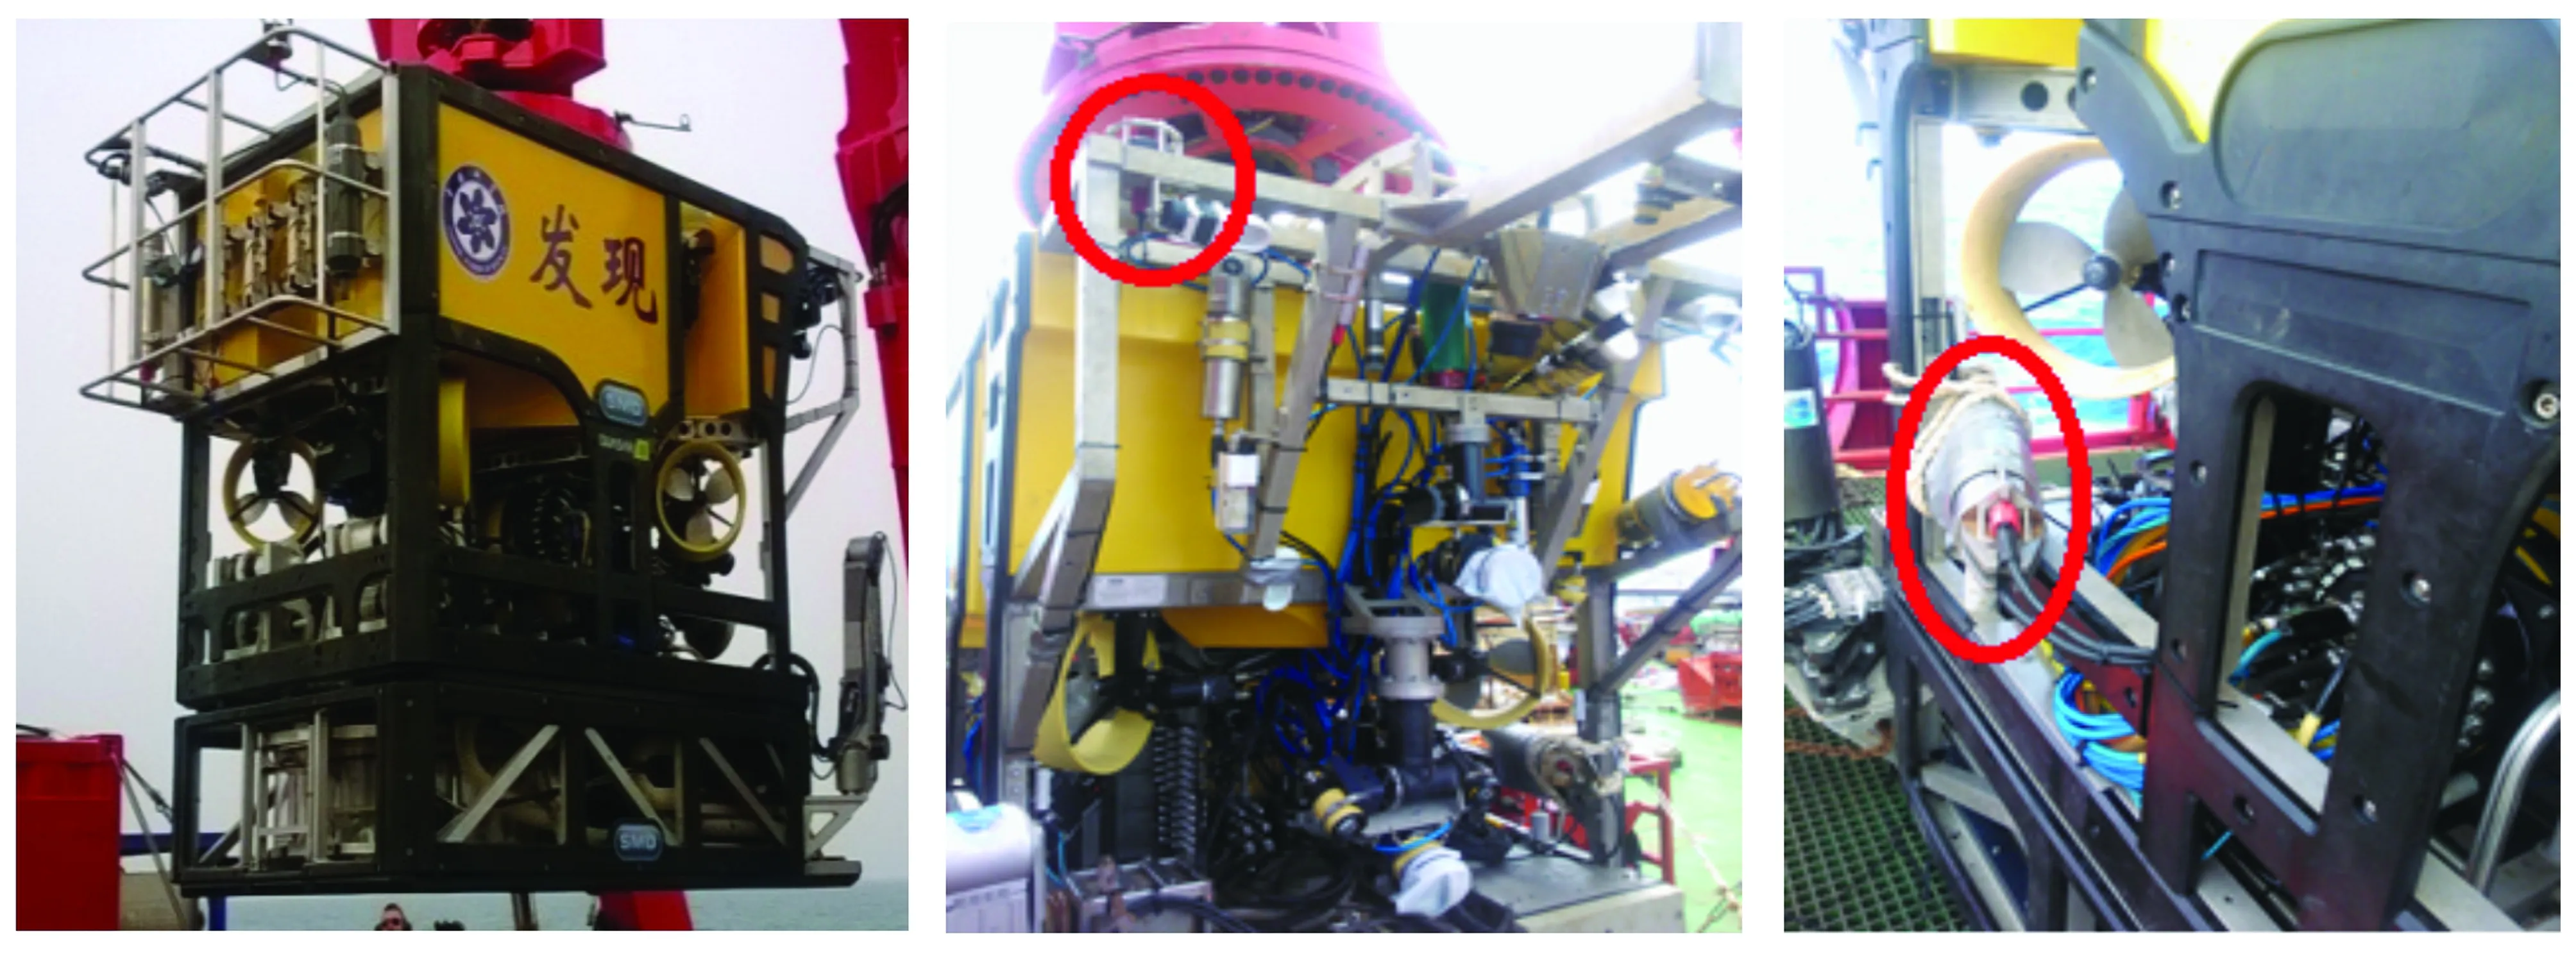
图3 ROV及综合定位系统Fig.3 ROV and the integrated positioning system
在获得地形数据后,根据实测地形在Pual洋脊顶部选取了一个近长方形区域(PACMANUS热液区)作为目标靶区,该区域面积约2 km×3 km,水深范围约为1 641~1 895 m。之后利用“发现”ROV搭载多波束系统(Kongsberg EM2040)进行近底走航式全覆盖水深测量,获得PACMANUS热液区的高分辨率地形数据。近海底观测时,ROV观测的方式类似于船载多波束走航式测量,不同的是ROV无法直接利用GPS进行定位,需要通过间接定位系统。此次测量利用哈尔滨工程大学研发的综合定位系统对ROV进行定位。ROV下水测量之前,首先选择目标靶区(PACMANUS热液区)地势较高的点位布放长基线信标,构建了一个长基线三角形阵,信标的标定位置见表1。在ROV进行近底地形测量的过程中,长基线为其提供定位服务。“发现”ROV同时搭载综合定位系统,该系统采用分体式安装结构,声学换能器安装于ROV艏部上方,电子舱则固定于ROV本体结构上(图3)。在测量时,测距仪通过ROV的光纤电缆与水面的超短基线部分进行时钟同步,并能够将定位结果实时通过光纤传输至ROV导航单元。该系统为ROV提供了水下长基线的精确定位和水面超短基线的跟踪服务,其内部的测距仪与水下信标相互应答,实时解算ROV的位置信息,水面超短基线采用时钟同步方式检测测距仪的询问信号,完成对ROV的定位和跟踪。ROV测量航线间距150 m,距底高度40 m进行测量,自身动力驱动且能保证其姿态相对稳定。在近底多波束测量过程ROV航迹线如图4所示。
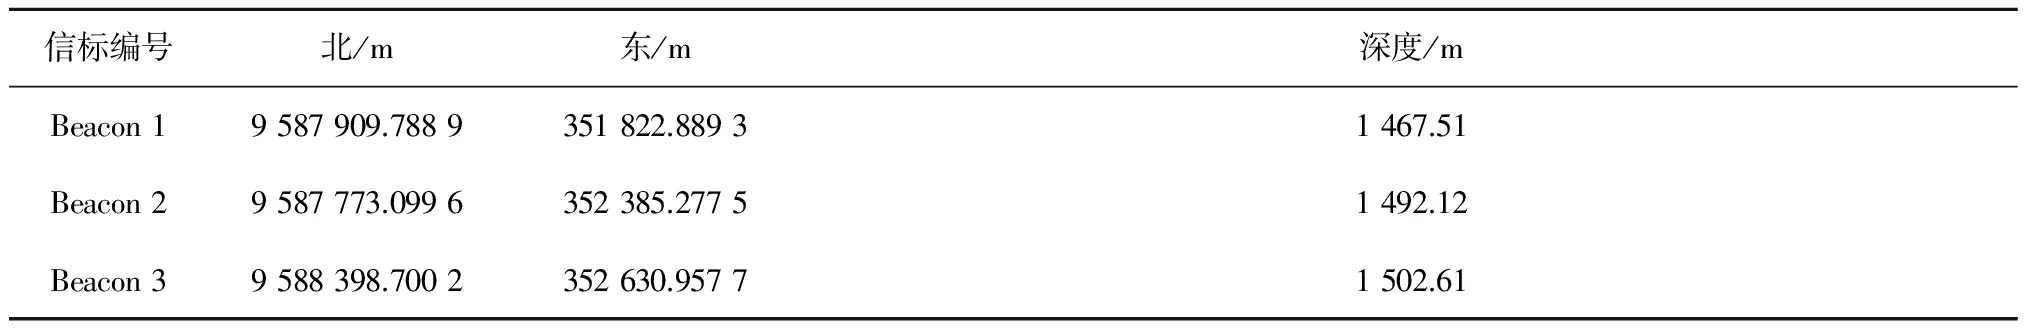
表1 信标标定结果
图4 ROV定位轨迹Fig.4 Paths of ROV during topography measurement
为了验证其定位精度,进行了静态定位试验,在ROV悬停状态下,重复测量与信标的距离,获得其数据偏差。经过数据验证和评估,长基线测距精度达到1.8 cm(图5a), ROV静态定位精度优于0.2 m(图5b)。本次测量采集的原始水深数据由CARIS HIPS 8.1进行姿态校正和异常点剔除,处理后输出散点数据,通过UTM投影(UTM 56度带)进行坐标转换,结果数据在网格化之后在Surfer中成图。
4 结果与讨论
4.1 海底地形船载测量与近底测量的结果对比
“科学”考察船搭载的多波束系统(Seabeam3012)在5节航速,90°波束开角测量2 000 m水深时的数据最优横向分辨率优于40 m[15]。利用此船载多波束的测量数据,通过网格化之后,获得了分辨率为50 m的海底地形(图6a),结果显示,研究区内发育多个东北-西南走向的洋脊,其中规模最大的为Pual洋脊。Pual洋脊地形西北侧较陡,坡度最大可达40°;东南侧呈阶梯状,底部的坡度最大也可达40°;顶部相对较缓,大部分区域坡度小于15°。虽然通过此数据可以分辨洋脊等大尺度地形及其分布,但无法区分小区域的精细地形。如图6b所示,小靶区水深约为1 600~1 900 m,地形西北侧陡东南侧缓,顶部呈马鞍形,南北两侧地势较高,但却无法辨别地形的精细特征。相比之下,长基线定位精度高,且ROV近底测量(距底约40 m),获得水深数据横向分辨率优于1 m,通过数据网格化之后获得6 m网格的地形图(图6c),该高分辨率地形图不仅显示了靶区的地形变化,也容易辨别该区域的复杂特殊地形,如发育于靶区中部的锥形地貌。因此,通过对比,可以看出ROV近底测量获得的地形分辨率可以数十倍优于船载多波束获得的数据,在获得小靶区高分辨地形方面有极大优势。然而,尽管船载多波束测量地形分辨率相对较低,在典型小靶区圈定及大面积海底地形测量中,船载多波束测量仍是必不可缺的重要基础。
4.2 PACMANUS热液区的高分辨率地形地貌特征
图7清晰显示了该区域的复杂地形特征,受火山作用及海底熔岩分布的影响,海底表面崎岖多变,地形复杂。研究区中央地形相对平缓,坡度小于15°,西北侧坡度大于40°(图8)。测量结果显示,研究区南部和北部地势较高,中部偏北区域发育一个垂直于洋脊走向的低地,中部发育了一个新生的火山区[7],面积约500 m×1 500 m。该新生火山区域是一个椭圆形区域,主要由3个丘状地貌构成,火山区南部发育两个小型火山口,最南侧火山口的环形坑直径约50 m,最大深度约20 m,中部火山口的环形坑直径约70 m,深约5 m。前人观测表明该区域热液溢出口和烟囱主要分布于中部的Snowcap、Fenway、Satanic区域和北部的Roman Ruins、Roger′s Ruins区域[7](图7)。这些热液喷口主要分布在火山区的两侧的斜坡处,其中有两处热液喷口能够在高分辨地形图上辨识出来。在火山区的东侧边缘,发育一个突出的圆锥形地貌,与周边地形高差可达40 m,锥体中央下陷,对应于活动的Snowcap热液区。另外,在北部低地也发育一个长形的小型丘体,与周边地形高差约20 m,对应于之前发现的Roman Ruins热液区[7]。
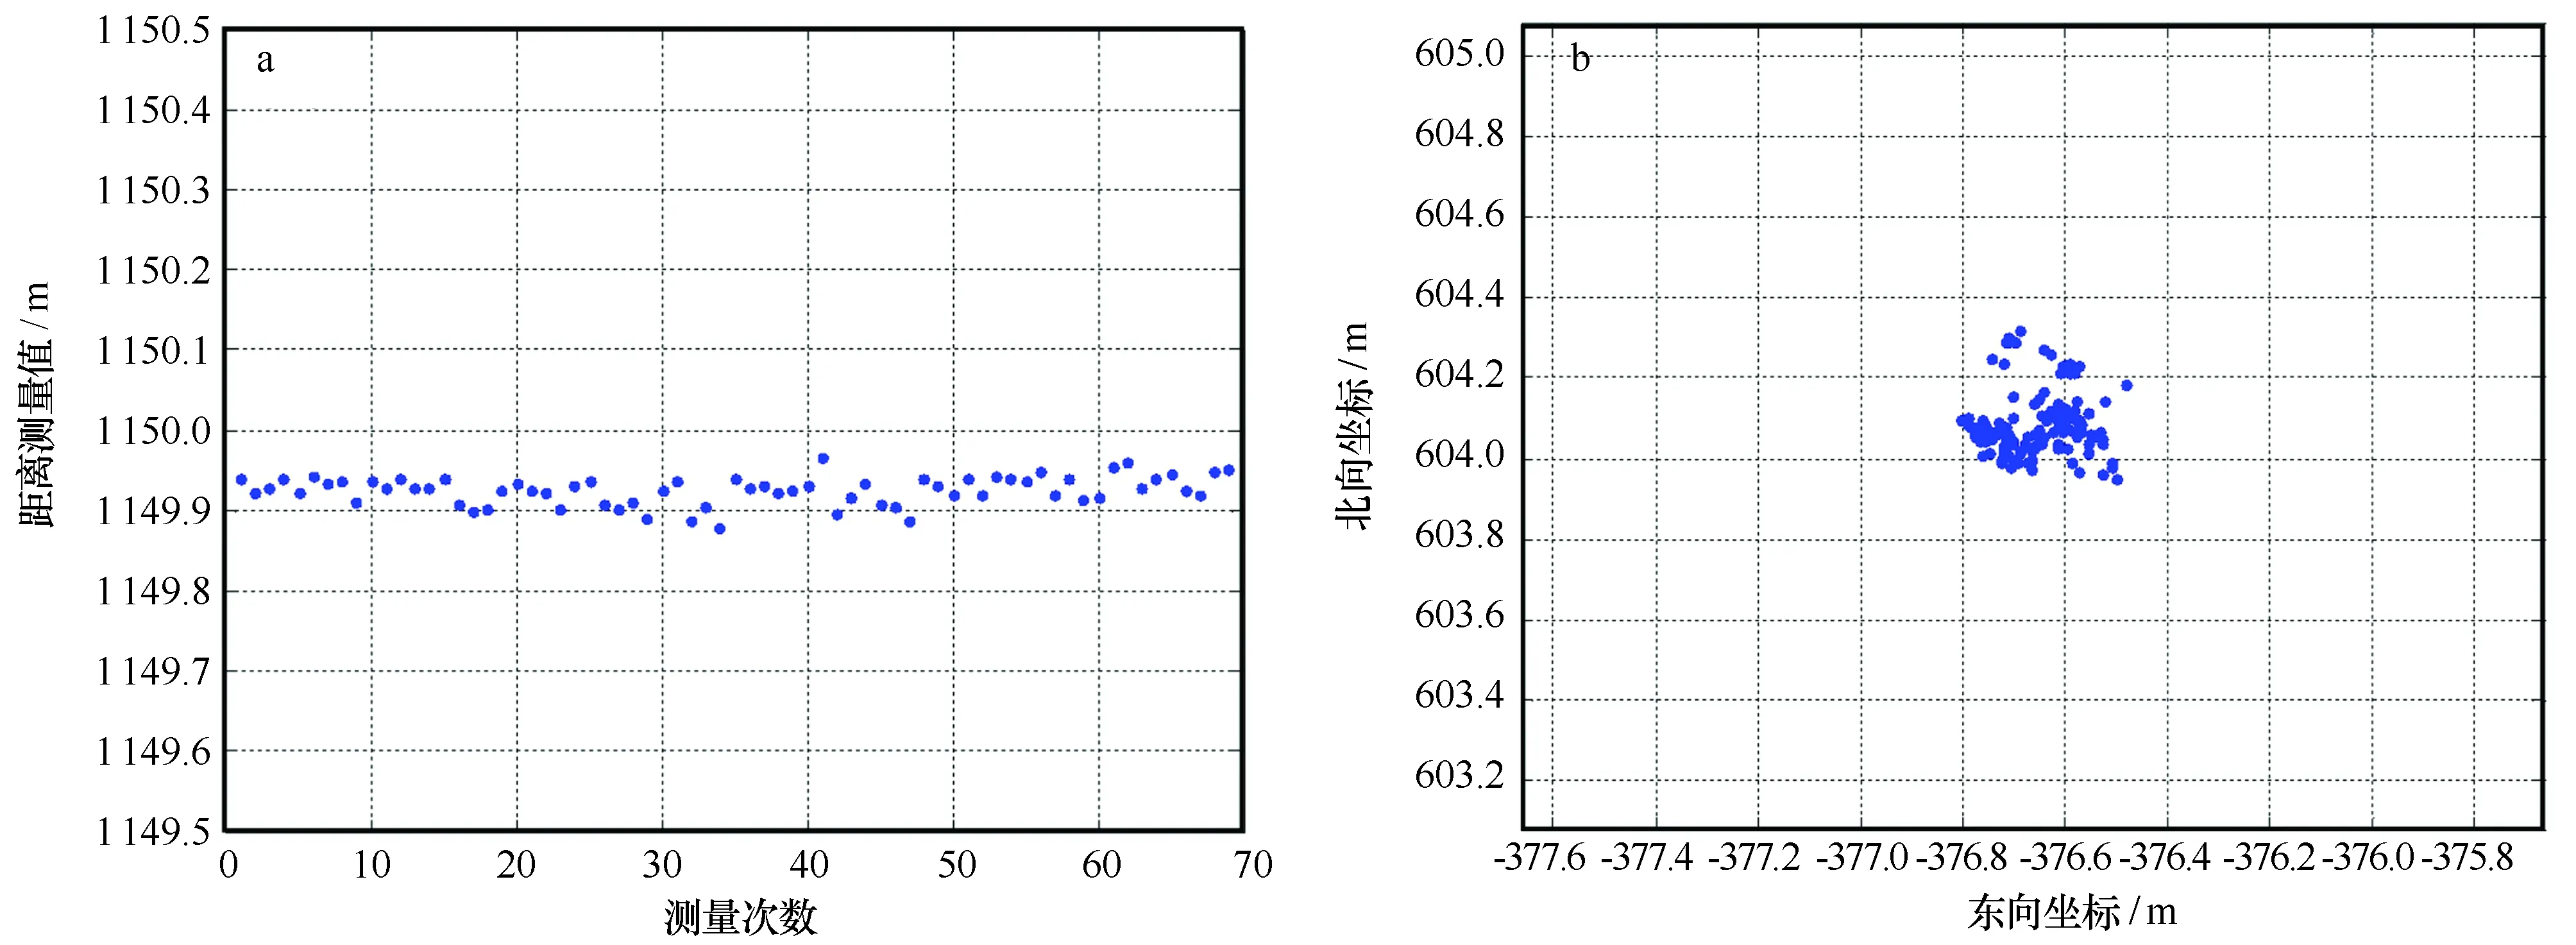
图5 定位精度评估Fig.5 Assessment for the positioning accuracya.测距精度;b.静态定位精度a.Accuracy of measured distance; b.accuracy of static positioning
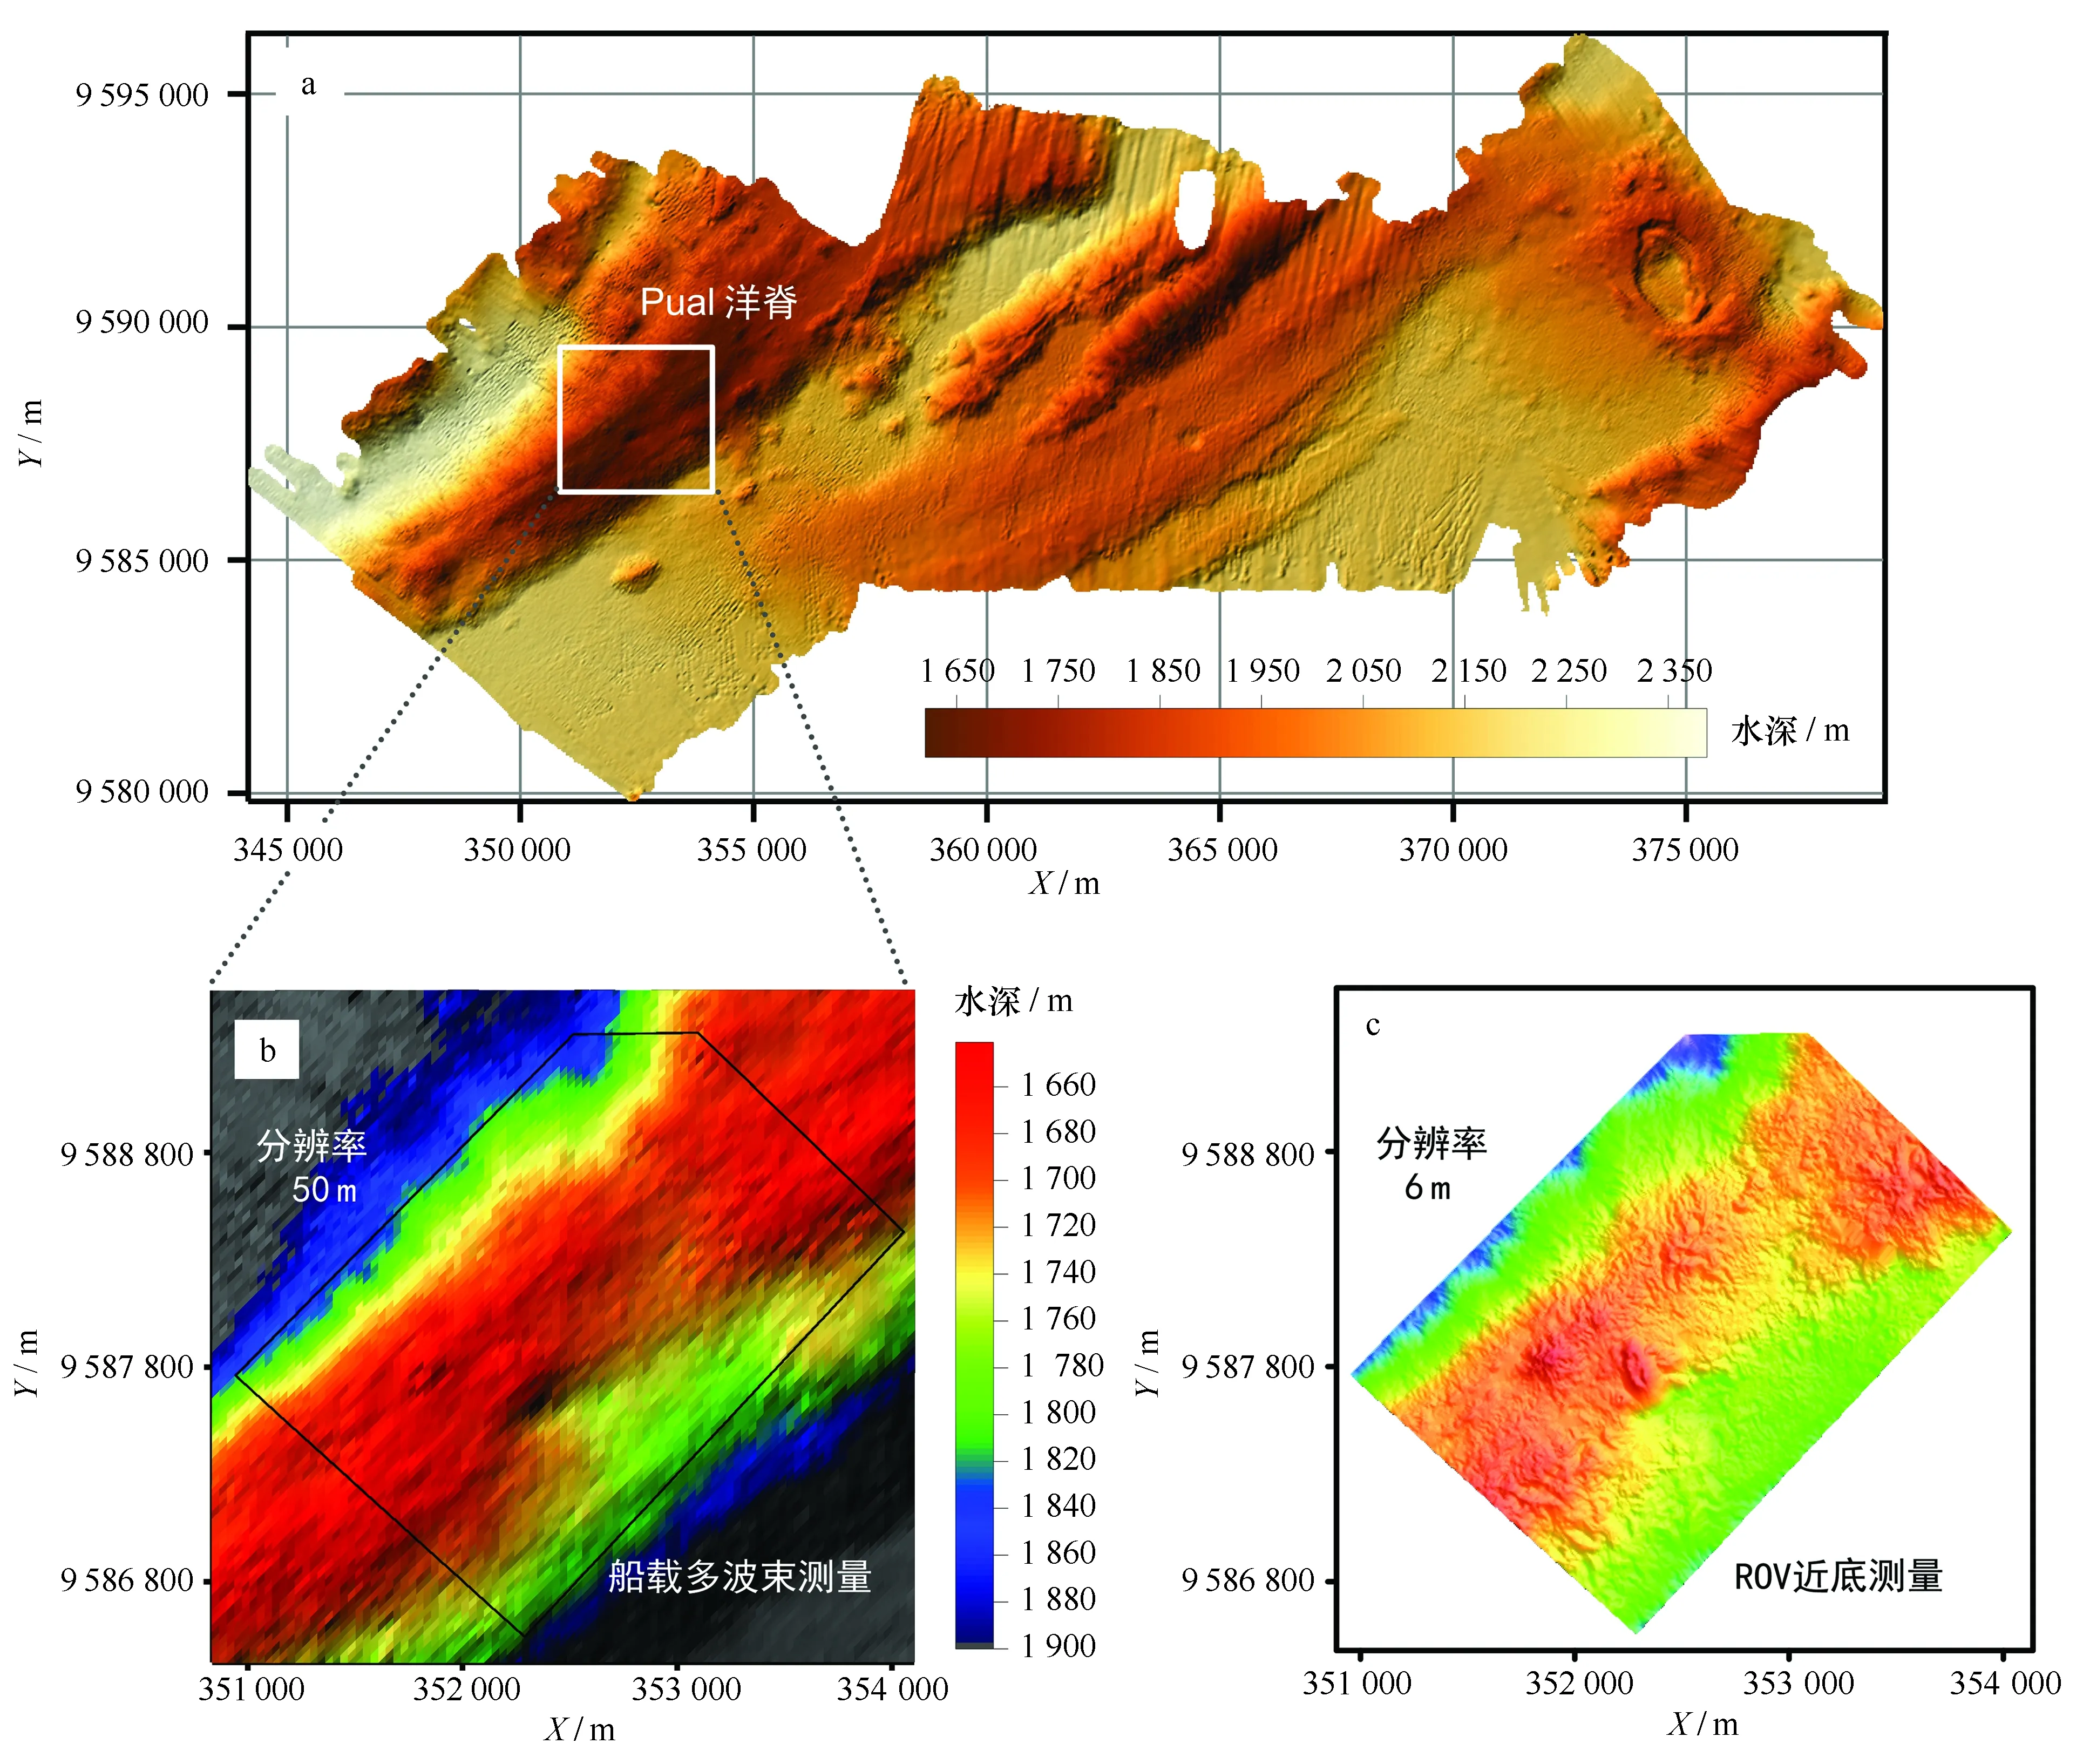
图6 船载多波束测量结果与ROV近底测量结果的对比Fig.6 Comparison between the results measured by multibeam sonar on board a ship and ROVa.船载多波束测量的研究区地形图;b.目标靶区船载多波束测量结果;c.目标靶区ROV近底测量结果a.Relief map of the study area basing on shipboard multibeam survey; b.topography of the target area from shipboard multibeam survey; c.topography of the target area from near-bottom survey by ROV using a multibeam sonar
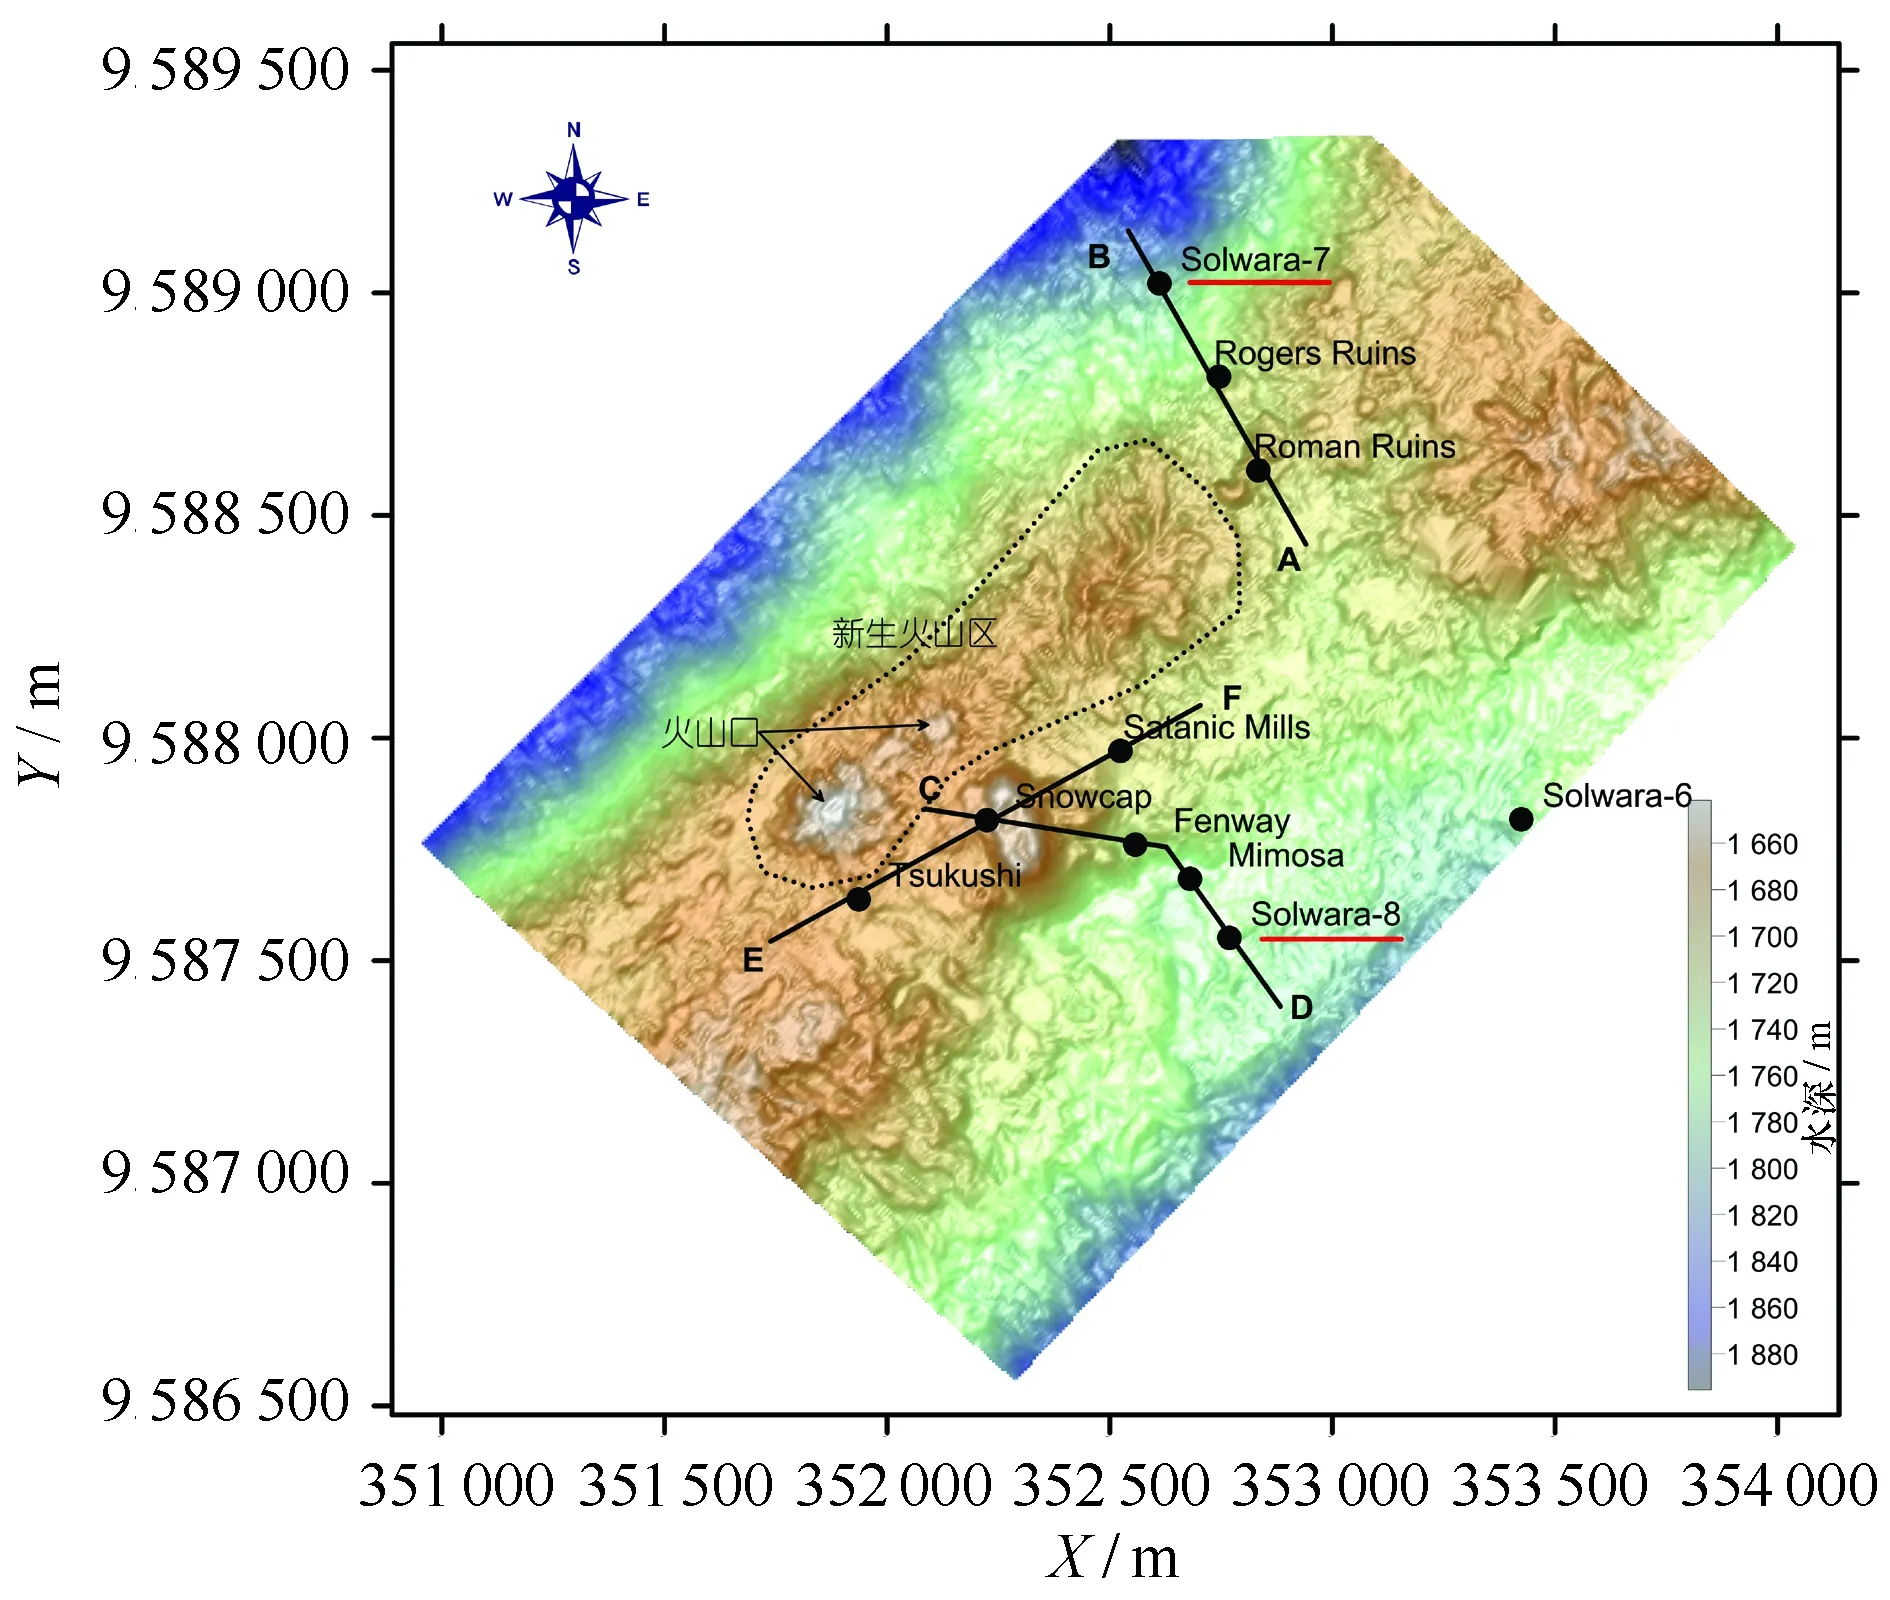
图7 PACMANUS热液区高分辨率地形图及热液点位置(分辨率6 m)Fig.7 High-resolution relief map of the PACMANUS hydrothermal field and the location of hydrothermal spots (at a resolution of 6 m)
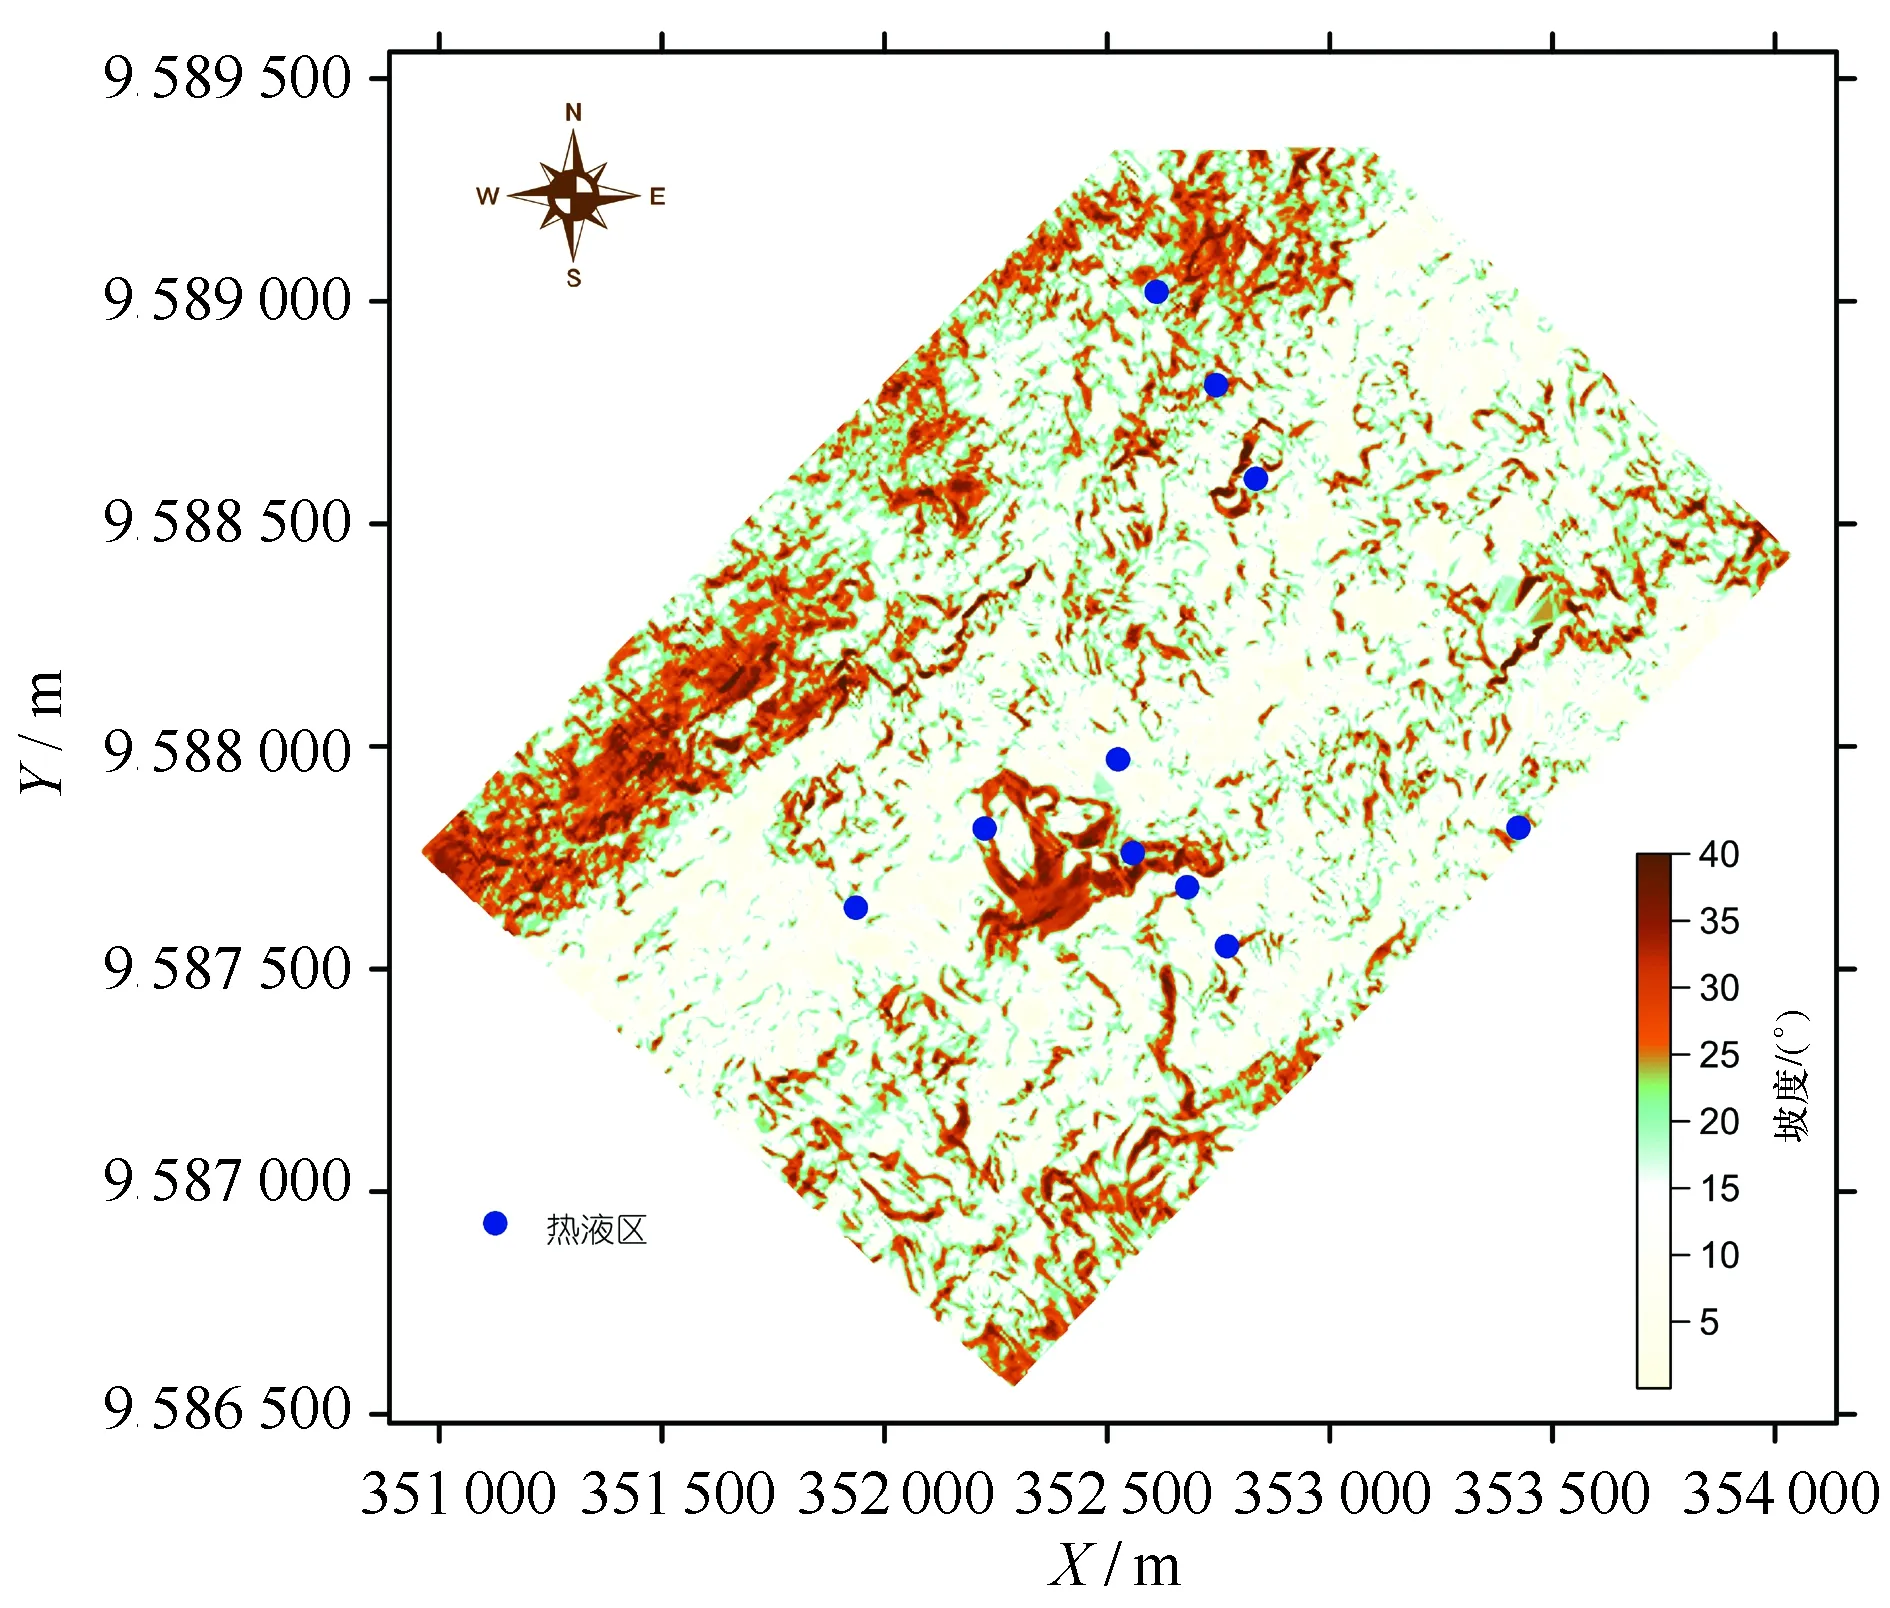
图8 PACMANUS热液区地形坡度图Fig.8 The slopes of the seafloor in the PACMANUS hydrothermal field
表2 PACMANUS主要热液点的位置及分布面积(根据参考文献[7]修改)
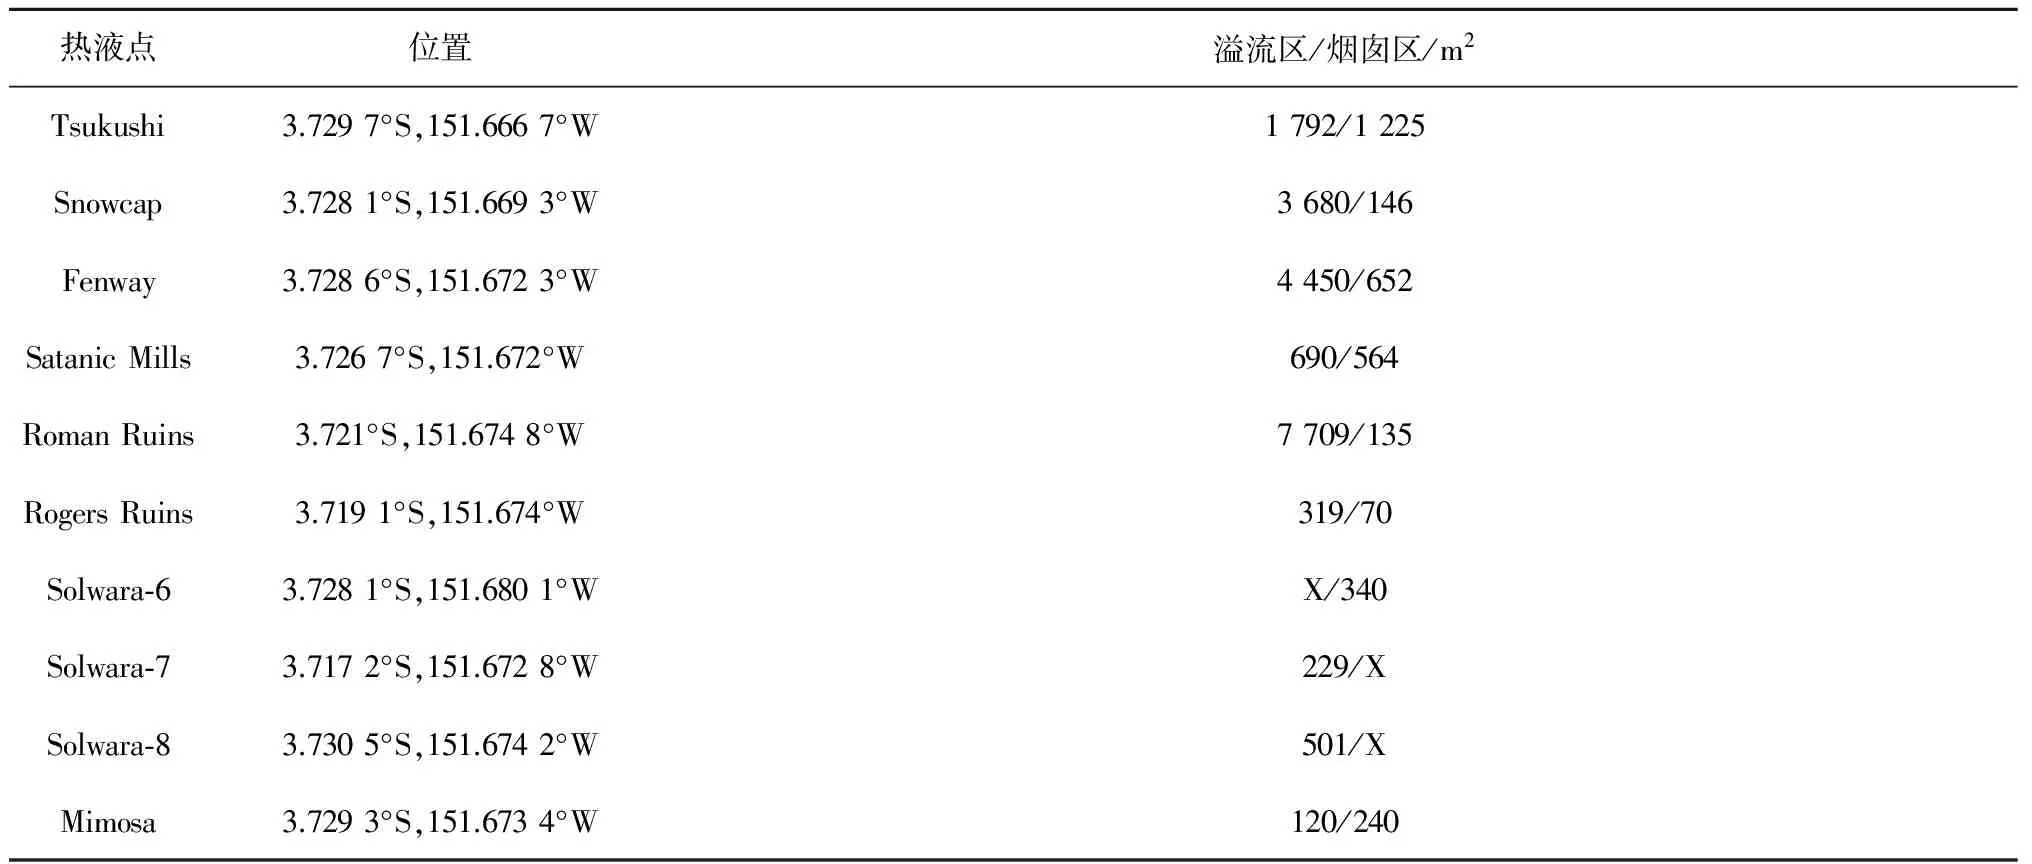
Tab.2 Locations of the main hydrothermal spots and their cover- age in the PACMANUS field (modified from reference[7])
注:X为未发现。
4.3 PACMANUS热液点分布与地形变化的关系
研究区海底地形的变化与热液活动可能相互影响。热液点溢流区和烟囱区的发育面积(表2)表明,热液活动在地形高点发育更为广泛,已发现的热液点中多数既有烟囱体也存在低温溢流口,而且距离火山区更近的Tsukushi、Snowcap、Fenway和Satanic热液点热液活动更加强烈,溢流和烟囱更加发育;相对的,在距离火山区较远的斜坡底部,Solwara-7和Solwara-8热液活动最弱,烟囱体未发育(表2)。另外,该区域活动热液点主要分布在火山区两侧斜坡的阶地上,而且在热液点发育的区域海底局部坡度超过30°(图8,图9)。进一步对研究区地形进行一阶导数计算获得定向坡度的分布,发现热液点主要位于斜坡上的地形突变区,这些斜坡上地形突变可能是由断裂、火山活动或热液活动本身导致,但基于目前的资料无法确定其成因,相关研究需要进一步开展。目前对该区域热液活动的控制因素仍有争议,Binns等[33]认为该区域的热液流体活动主要受断裂控制,然而最近的研究认为热液活动可能与该区域的火山活动有关,与火山附近沉积结构的相关性更为显著,因为对该区域的调查未在海底发现显著的断裂现象[7]。值得注意的是,在火山区两侧平行的相同方向上,地形的变化是相反的(图10),即火山区西北侧向西南方向倾斜,而火山区东南侧向东北方向倾斜,这可能与构造活动有关。
5 结论与展望
(1)基于ROV搭载多波束对西太平洋马努斯盆地PACMANUS热液区进行了近海底全覆盖地形观测。研究证实,在测量过程中,长基线系统定位精度高,能够保证ROV位置的准确性。由于是近底测量,在测量高分辨率地形时,ROV测量的优势极为明显,测量的地形分辨率数倍优于船载多波束观测结果。然而,虽然船载多波束测量精度较低,船载多波束测量仍是获得大面积海底地形的首选,也是目标小靶区选定的基础。
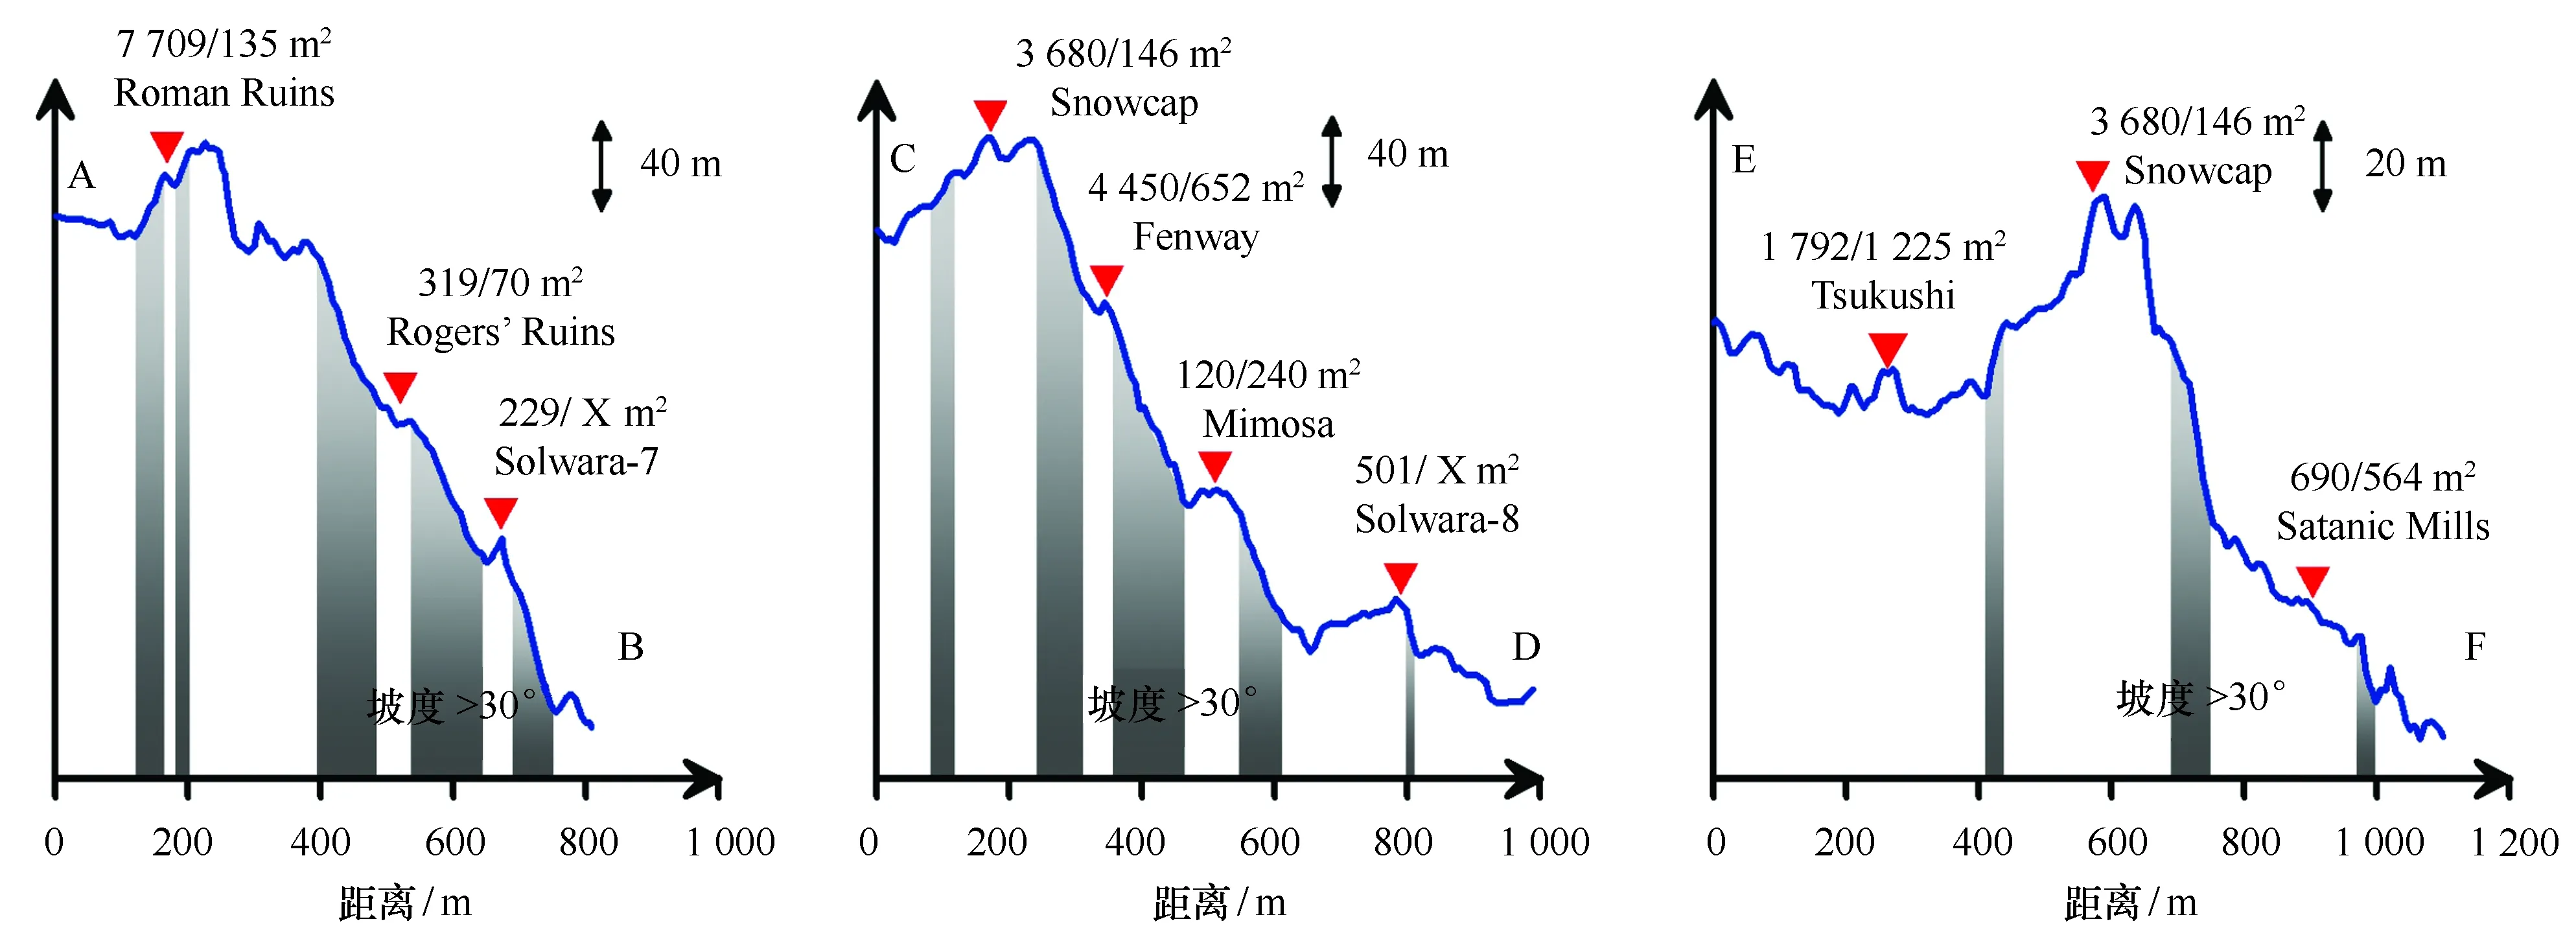
图9 热液点地形剖面Fig.9 Bathymetrical profiles crossing the main hydrothermal spots in PACMANUS field剖面位置见图7,图中面积为溢流区/烟囱区的发育面积见表2,X为未发现Location of the profiles seeing Fig.7, the coverage values are from Tab.2 and X denote no occurence
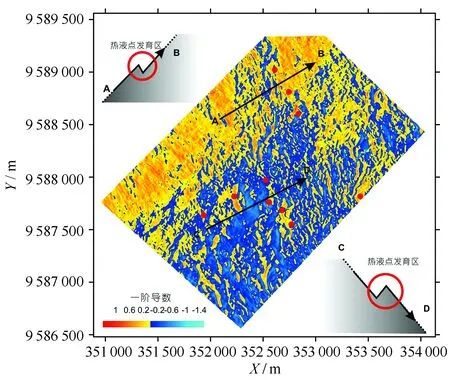
图10 定向一阶导数的分布特征及与热液点发育区的关系Fig.10 Characters of the directional first derivative and their relation to the distribution of the hydrothermal spots正值表示上坡,负值表示下坡Positive value of the directional first derivative denotes upslope while the negative value means downslope
(2)高分辨率地形显示PACMANUS热液区南部和北部地势较高,中部偏北区域发育一个低地,中部发育了一个新生的火山区,一些锥形地形对应了之前发现的多个热液点。通过分析发现PACMANUS热液区的热液点主要发育于坡度大于30°的斜坡的地形突变区域,其原因仍需进一步深入研究。
(3)深海海底发育了特殊的地质现象,对深入认识地球演化及动力过程、海底环境等研究有重要意义,针对重点的特殊深海研究区(如热液冷泉、洋中脊区域),在船载多波束数据获得研究区大面积地形资料的基础上,有必要选取多个典型深海小靶区进行高分辨率地形测量为进一步深入研究提供保障。其中,ROV搭载多波束测量为其提供了可靠有效的途径,应得到进一步更为广泛的实践应用。
致谢:感谢“科学”考察船马努斯热液航次上工作的所有科学家和全体船员为此工作所做的努力!
[1] Heezen B C, Tharp M. World Ocean Floor Panorama[M]//Full Color, Painted by H. Ber Mercator Projection, Scale:1:23,230,300, 1168×1930 mm. New York, 1977.
[2] Becker J J, Sandwell D T, Smith W H F, et al. Global bathymetry and elevation data at 30 arc seconds resolution: SRTM30_PLUS[J]. Marine Geodesy, 2009, 32(4): 355-371.
[3] Harris P T, Macmillan-Lawler M, Rupp J, et al. Geomorphology of the oceans[J]. Marine Geology, 2014, 352: 4-24.
[4] Kwasnitschka T, Hansteen T H, Devey C W, et al. Doing fieldwork on the seafloor: Photogrammetric techniques to yield 3D visual models from ROV video[J]. Computers & Geosciences, 2013, 52: 218-226.
[5] German C R, Lin J, Parson L M. Mid-Ocean Ridges: Hydrothermal Interactions Between the Lithosphere and Oceans[M]. Washington: American Geophysics Union, 2004: 245-266.
[6] Dorschel B, Wheeler A, Huvenne V, et al. Cold-water coral mounds in an erosive environmental setting: TOBI side-scan sonar data and ROV video footage from the northwest Porcupine Bank, NE Atlantic[J]. Marine Geology, 2009, 264(3): 218-229.
[7] Thal J, Tivey M, Yoerger D, et al. Geologic setting of PACManus hydrothermal area-high resolution mapping and in situ observations[J]. Marine Geology, 2014, 355: 98-114.
[8] 李家彪, 等. 多波束勘测原理技术与方法[M]. 北京: 海洋出版社, 1999.
Li Jiabiao, et al. Multibeam Sounding Principles Survey Technologies and Data Processing Methods[M]. Beijing: China Ocean Press, 1999.
[9] Roberts H, Shedd W, Hunt J. Dive site geology: DSV ALVIN (2006) and ROV JASON II (2007) dives to the middle-lower continental slope, northern Gulf of Mexico[J]. Deep-Sea Research Part Ⅱ: Topical Studies in Oceanography, 2010, 57(21): 1837-1858.
[10] Neves B M, Du Preez C, Edinger E. Mapping coral and sponge habitats on a shelf-depth environment using multibeam sonar and ROV video observations: Learmonth Bank, northern British Columbia, Canada[J]. Deep-Sea Research Part Ⅱ: Topical Studies in Oceanography, 2014, 99: 169-183.
[11] Sen A, Ondréas H, Gaillot A, et al. The use of multibeam backscatter and bathymetry as a means of identifying faunal assemblages in a deep-sea cold seep[J]. Deep-Sea Research Part I: Oceanographic Research Papers, 2016, 110: 33-49.
[12] 陈义兰, 刘乐军, 刘晓瑜, 等. 深海油气勘探中的海底地形勘测技术[J]. 海洋测绘, 2015,35(2): 18-22.
Chen Yilan, Liu Lejun, Liu Xiaoyu, et al. Seabed topographic survey technology in deep-sea oil and gas exploration[J]. Hydrographic Surveying and Charting, 2015, 35(2): 18-22.
[13] Ferrini V L, Fornari D J, Shank T M, et al. Submeter bathymetric mapping of volcanic and hydrothermal features on the East Pacific Rise crest at 9°50′ N[J]. Geochemistry, Geophysics, Geosystems, 2007, 8(1):Q01006.
[14] Ferrini V L, Tivey M K, Carbotte S M, et al. Variable morphologic expression of volcanic, tectonic, and hydrothermal processes at six hydrothermal vent fields in the Lau back-arc basin[J]. Geochemistry, Geophysics, Geosystems, 2008, 9(7):Q07022.
[15] 郑翔. 冲绳海槽中部热液区及典型喷溢区地形地貌特征及成因分析[D]. 青岛: 中国科学院海洋研究所, 2015.
Zheng Xiang. Topographic and geomorphologic features and genesis analyses of the hydrothermal fields and typical hydrothermal vents in the mid-Okinawa Trough[D]. Qingdao: Institute of Oceanology, Chinese Academy of Sciences, 2015.
[16] Taylor B, Crook K, Sinton J. Extensional transform zones and oblique spreading centers[J]. Journal of Geophysical Research, 1994, 99(B10): 19707-19718.
[17] Tregoning P. Plate kinematics in the western Pacific derived from geodetic observations[J]. Journal of Geophysical Research, 2002, 107: 1-8.
[18] Tufar W. Modern hydrothermal activity, formation of complex massive sulfide deposits and associated vent communities in the Manus back-arc basin (Bismarck Sea, Papua New Guinea)[J]. Mitteilung der Osterreichen Geologischen Gesellshaft, 1990, 82: 183-210.
[19] Craig H, Poreda R J. Studies of Methane and Helium in Hydrothermal Vent Plumes, Spreading-axis Basalts, and Volcanic Island Lavas and Gases in Southwest Pacific Marginal Basins: Papatua Expedition Legs V and VI, 1 February 1986-15 March 1986[R]. Scripps Institution of Oceanography, University of California, San Diego, 1987.
[20] Bach W, Roberts S, Vanko D A, et al. Controls of fluid chemistry and complexation on rare-earth element contents of anhydrite from the Pacmanus subseafloor hydrothermal system, Manus Basin, Papua New Guinea[J]. Mineralium Deposita, 2003, 38(8): 916-935.
[21] Lackschewitz K S, Devey C W, Stoffers P, et al. Mineralogical, geochemical and isotopic characteristics of hydrothermal alteration processes in the active, submarine, felsic-hosted PACMANUS field, Manus Basin, Papua New Guinea[J]. Geochimica et Cosmochimica Acta, 2004, 68(21): 4405-4427.
[22] Reeves E P, Seewald J S, Saccocia P, et al. Geochemistry of hydrothermal fluids from the PACMANUS, Northeast Pual and Vienna Woods hydrothermal fields, Manus Basin, Papua New Guinea[J]. Geochimica et Cosmochimica Acta, 2011, 75(4): 1088-1123.
[23] Gamo T, Sakai H, Ishibashi J, et al. Hydrothermal plumes in the eastern Manus Basin, Bismarck Sea: CH 4, Mn, Al and pH anomalies[J]. Deep-Sea Research Part I: Oceanographic Research Papers, 1993, 40(11): 2335-2349.
[24] Gamo T, Ishibashi J, Shitashima K. Unique hydrothermal fluid from the DESMOS caldera, Manus Basin: reply to comments by JA Resing and FJ Sansone[J]. Deep-Sea Research Part I: Oceanographic Research Papers, 1996, 43(11): 1873-1875.
[25] Gamo T, Okamura K, Charlou J-L, et al. Acidic and sulfate-rich hydrothermal fluids from the Manus back-arc basin, Papua New Guinea[J]. Geology, 1997, 25: 139-142.
[26] Yeats C J, Parr J M, Binns R A, et al. The SuSu Knolls hydrothermal field, eastern Manus Basin, Papua New Guinea: An active submarine high-sulfidation copper-gold system[J]. Economic Geology, 2014, 109(8): 2207-2226.
[27] Auzende J M, Urabe T. Cruise explores hydrothermal vents of the Manus Basin[J]. Eos, Transaction American Geophysical Union, 1996, 77(26): 244-244.
[28] Auzende J M, Urabe T, Ruellan E, et al. SHINKAI 6500 dives in the Manus Basin: New STARMER Japanese-French program[J]. Deep-Sea Research, 1996, 42(12):323-334.
[29] Craddock P R, Bach W, Seewald J S, et al. Rare earth element abundances in hydrothermal fluids from the Manus Basin, Papua New Guinea: Indicators of sub-seafloor hydrothermal processes in back-arc basins[J]. Geochimica et Cosmochimica Acta, 2010, 74(19): 5494-5513.
[30] Park S-H, Lee S-M, Kamenov G D, et al. Tracing the origin of subduction components beneath the South East rift in the Manus Basin, Papua New Guinea[J]. Chemical Geology, 2010, 269(3): 339-349.
[31] 曾志刚, 陈帅, 王晓媛, 等. 东马努斯海盆PACMANUS热液区Si-Fe-Mn羟基氧化物的矿物学和微形貌特征[J]. 中国科学: 地球科学, 2013, 43(1): 61-71.
Zeng Zhigang, Chen Shuai, Wang Xiaoyuan, et al. Mineralogical and micromorphological characteristics of Si-Fe-Mn oxyhydroxides from the PACMANUS hydrothermal field, Eastern Manus Basin[J]. Science China: Earth Sciences, 2013, 43(1): 61-71.
[32] 陶春辉, 李怀明, 金肖兵, 等. 西南印度洋脊的海底热液活动和硫化物勘探[J]. 科学通报, 2014, 59(19): 1812-1822.
Tao Chunhui, Li Huaiming, Jin Xiaobing, et al. Seafloor hydrothermal activity and polymetallic sulfide exploration on the southwest Indian ridge[J]. Chinese Science Bulletin, 2014, 59(19): 1812-1822.
[33] Binns R A, Barriga F J A S, Miller D J. Leg 193 synthesis: anatomy of an active felsic-hosted hydrothermal system, eastern Manus Basin, Papua New Guinea[C]//Proceedings of the Ocean Drilling Program, Scientific Results. Ocean Drilling Program, College Station, TX, 2007: 1-71.
石盛玉,程和琴,郑树伟,等. 三峡截流以来长江洪季潮区界变动河段冲刷地貌[J]. 海洋学报,2017,39(3): 85-95, doi.10.3969/j.issn.0253-4193.2017.03.008
Shi Shengyu, Cheng Heqin, Zheng Shuwei, et al. Erosional topography of the tidal limit in the Yangtze River in flood seasons after the river closure at Three Gorges[J]. Haiyang Xuebao, 2017,39(3): 85-95, doi.10.3969/j.issn.0253-4193.2017.03.008
Near-bottom topography measurement using ROV and its application in a deep-sea hydrothermal field in the Manus Basin
Ma Xiaochuan1, Luan Zhendong1, Zhang Xin1, Zheng Cuie2, Yan Jun1, Sun Dajun2
(1.KeyLaboratoryofMarineGeologyandEnvironment,InstituteofOceanology,ChineseAcademyofSciences,Qingdao266071,China; 2.CollegeofUnderwaterAcousticEngineering,HarbinEngineeringUniversity,Harbin150001,China)
It is necessary to deploy high-resolution topographic surveys in a typical small target in deep-sea areas (e. g. hydrothermal seep, ridge area) to support the future further studies, after the full-covered topography data acquisition of the large study area using a shipborne mutli-beam system. Here, we select PACMANUS hydrothermal area as target area in the Manus Basin and deploy a near-bottom full-covered survey to obtain topography data basing on “FAXIAN” ROV. Results show that Long Baseline provide a reliable high-precision positioning relying on the ship dynamic positioning system and a differential GPS. The resolution of seabed topography which is near-bottom measured by ROV is tens of times better than that obtained by an onboard multi-beam system. High-resolution terrain clearly shows the detailed characters of the terrain in the PACMANUS hydrothermal field, and some cones are corresponding to the locations of the discovered hydrothermal points and volcanic area. Further analysis show that hydrothermal points mainly developed on the steep slopes whose gradients exceed 30°, and the causes are still unknown and need a further study. It is a reliable mean for obtaining high-resolution topography data by deploying near-bottom measurements using ROV, which will promote the development of deep-sea scientific research.
topography measurement; high-resolution; ROV; hydrothermal field; Manus Basin
2016-06-08;
2016-10-11。
中国科学院战略性先导科技专项(XDA11030301)。
马小川(1985—),男,山东省莱州市人,博士,助理研究员,从事海底地形地貌和沉积动力过程研究。E-mail:mxch@qdio.ac.cn
*通信作者:阎军(1961—),男,博士,研究员,主要从事海洋地质、深海探测技术、海洋沉积动力等研究。E-mail:jyan@qdio.ac.cn
P736.21+2
A
0253-4193(2017)03-0076-09
