CHALCO - ORDINS Strategic Cooperation
2017-03-03
CHALCO - ORDINS Strategic Cooperation
On January 20, 2017, The Cooperation Framework Agreement signing ceremony was held at Ordins’ headquarters, jointly with China Aluminum Logistics Group Co., Ordins and Ordins East China Co.
CHALCO is an important state-owned enterprise, and the world’s second largest alumina producer and the third largest producer of electrolytic aluminum, with an overall strength ranked the top of global aluminum industry.
China Aluminum Logistics Group Co. is a specialized group company formed by CHALCO to realize strategic transformation and development of new industries. It undertakes the logistics integration and operation management of CHALCO, meanwhile the mission of developing external market and assets operation. It has a registered capital of 558 million. As of the end of 2016, the company's total assets reached 1.68 billion yuan, had eight subsidiaries with a total of 3703 employees. It plans to build a key logistics hub, a unified logistics information service platform and dispatching & commanding center by building strategic cooperation relationship with railways and ports, and form integrated advantages of bulk industrial products intermodal transport. On the basis of centralized management of warehousing and informationization, it will carry out value-added services such as logistics finance and logistics real estate, with an aim to become the most influential supply chain integration service provider based on intelligence, platform and finance in non-ferrous metal industry.
There has been a good basis for cooperation between Ordins and China Aluminum Logistics Group, as a strategic cooperation framework agreement was signed between the two sides on August 5, 2016. This time, Ordins introduced a strategic investment from China Aluminum Logistics Group, which also had a capital increase at Ordins East China Co. That was a key step in achieving a win-win relationship and common development, which was of great significance to China Ordins Corporation’s efforts in building a supply chain integration services group, and an important measure to further carry out the whole value chain systematic lean management strategy. The cooperation between the two parties will become a model of strong cooperation, mutual benefit and win-win among central enterprises.
Unit: metric ton

Name of province or cityProduction inDecember. 2016Total outputJan.-Dec. 2016% Change2015-2016 Zhejiang132185528.48 Jiangxi1257222392.77 Hunan534337403-7.98 Guangxi52111028-5.46 Yunnan82259756316.49 Total output China166741826819.97
Unit: metric ton

Name of provinceProduction inDecember. 2016Total outputJan.-Dec. 2016% Change2015-2016 Shanxi9444140428-26.21 Liaoning7297071-34.18 Henan576177231-10.33 Shaanxi4404746671324.03 Ningxia9014142598-19.68 Xingjiang82634383763.09 Total output China808059102631.4
Unit: metric ton
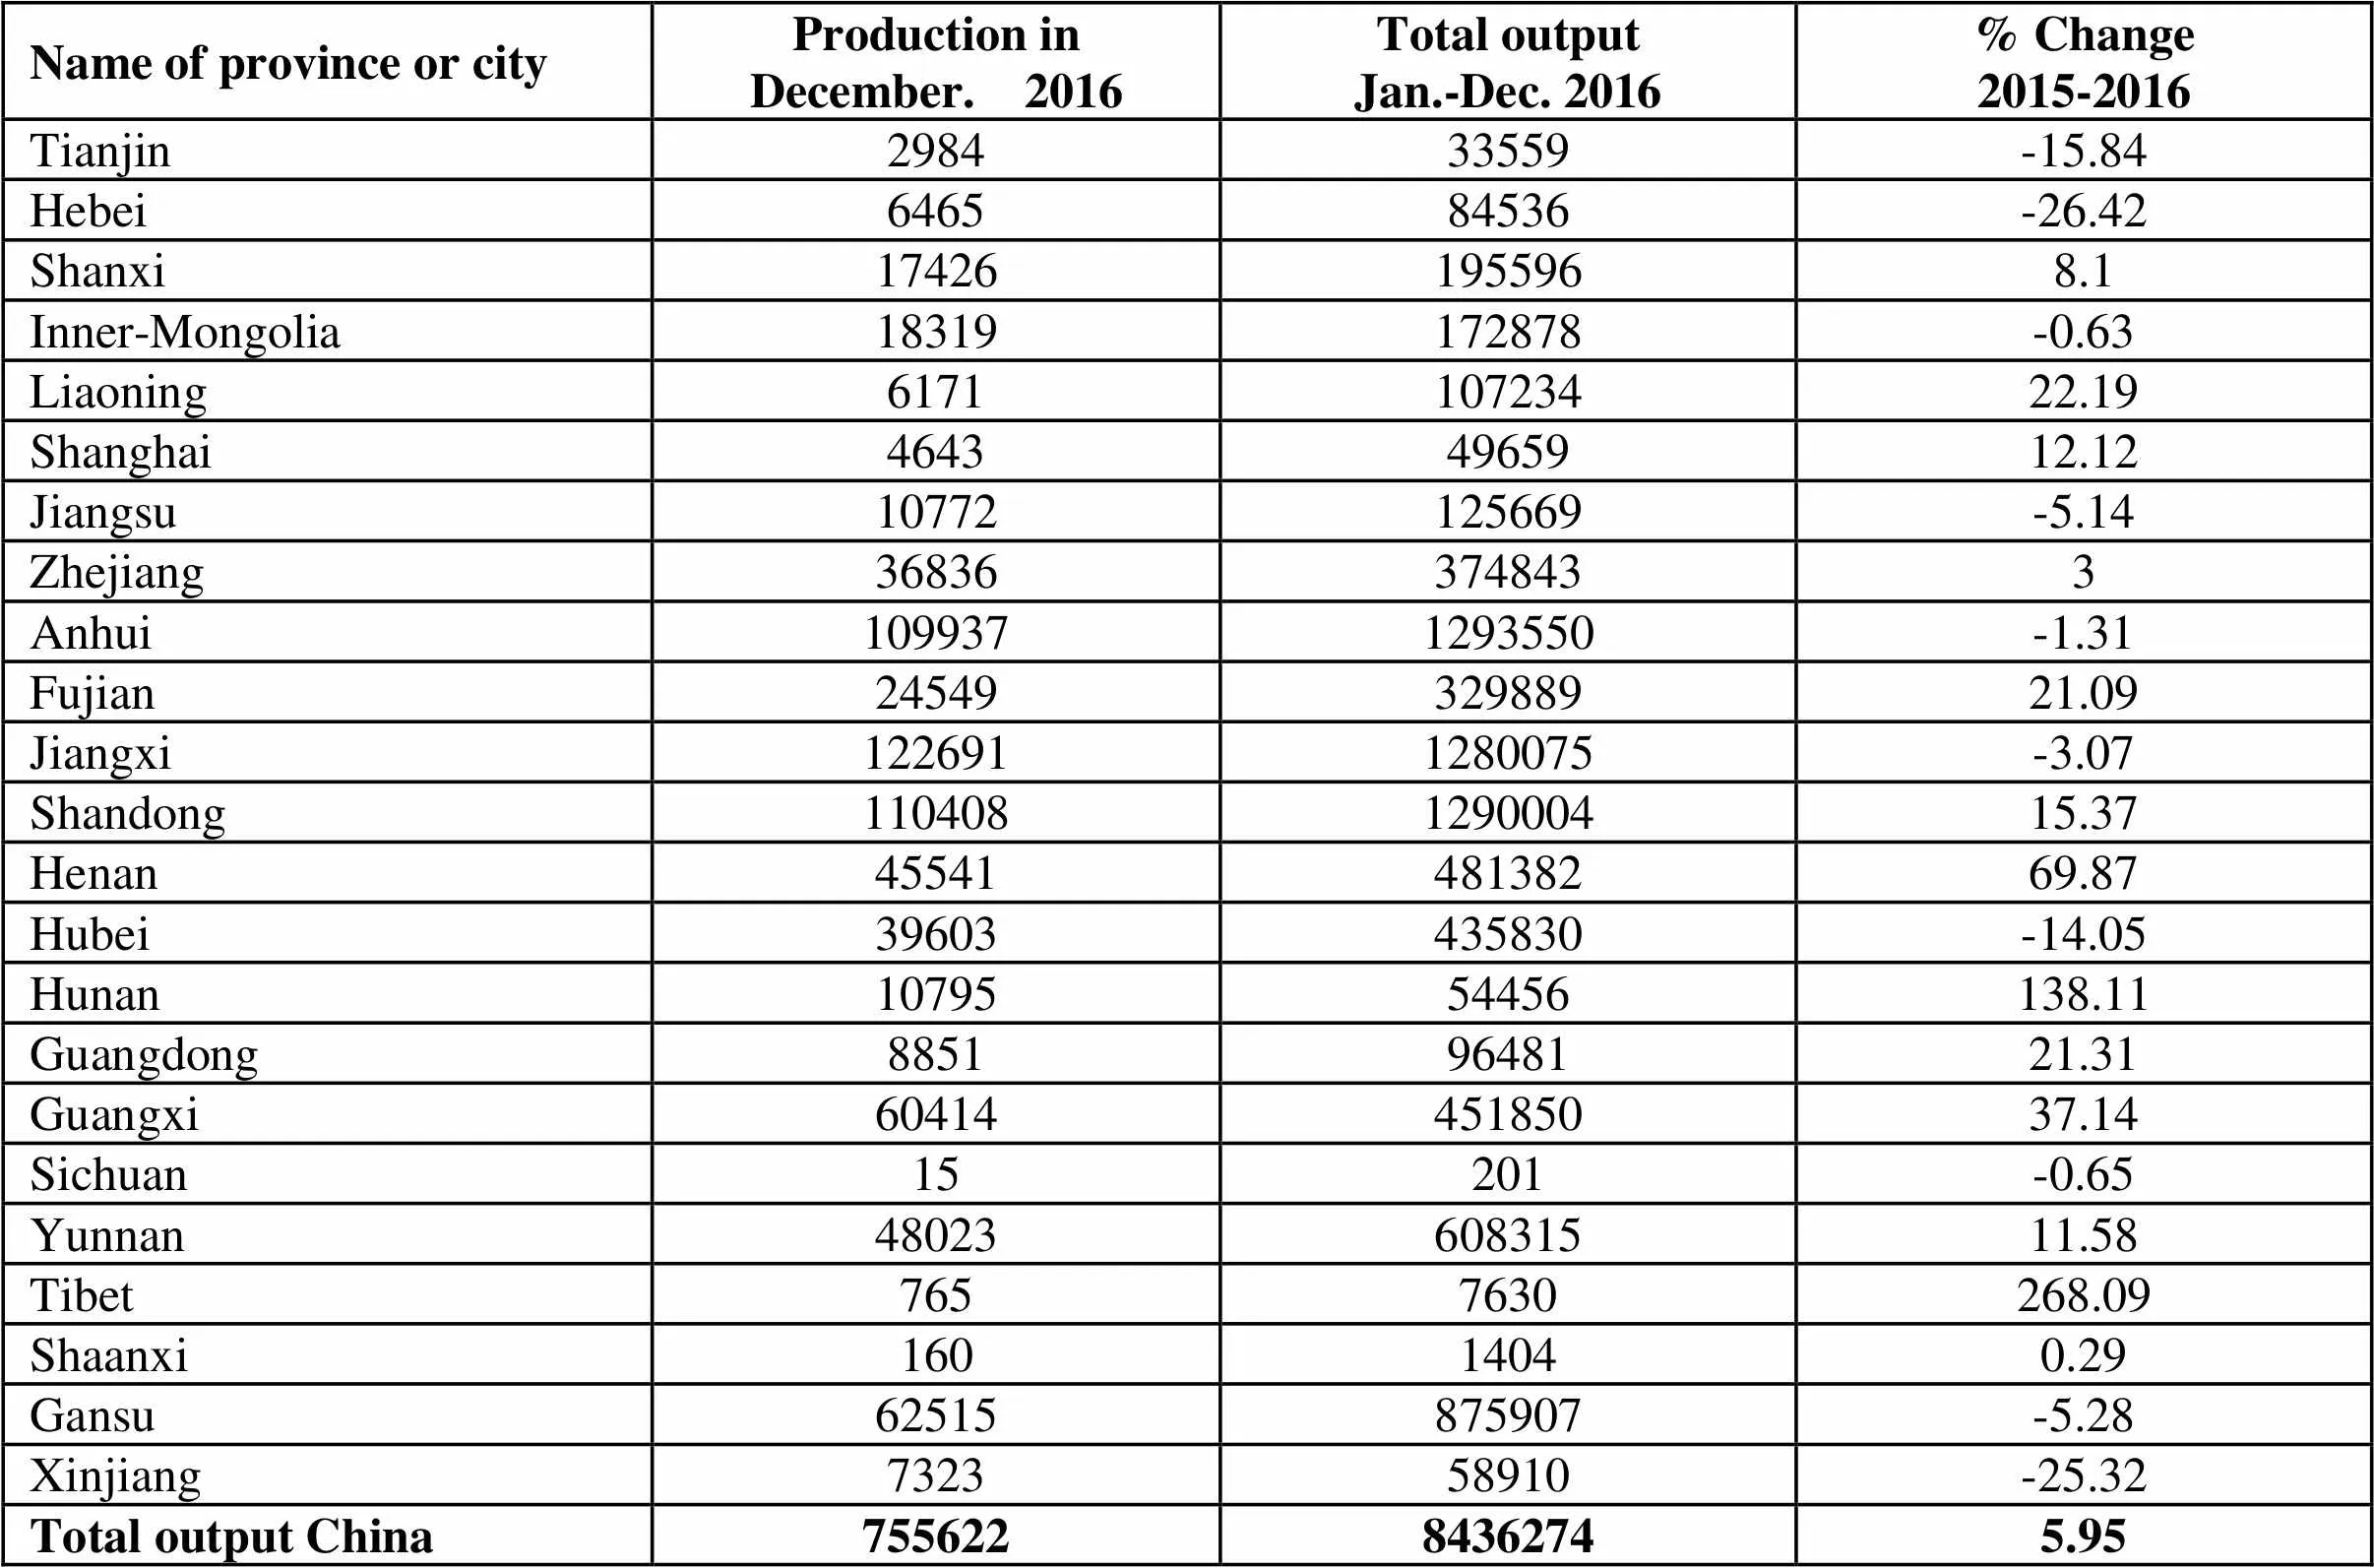
Name of province or cityProduction inDecember. 2016Total outputJan.-Dec. 2016% Change2015-2016 Tianjin298433559-15.84 Hebei646584536-26.42 Shanxi174261955968.1 Inner-Mongolia18319172878-0.63 Liaoning617110723422.19 Shanghai46434965912.12 Jiangsu10772125669-5.14 Zhejiang368363748433 Anhui1099371293550-1.31 Fujian2454932988921.09 Jiangxi1226911280075-3.07 Shandong110408129000415.37 Henan4554148138269.87 Hubei39603435830-14.05 Hunan1079554456138.11 Guangdong88519648121.31 Guangxi6041445185037.14 Sichuan15201-0.65 Yunnan4802360831511.58 Tibet7657630268.09 Shaanxi16014040.29 Gansu62515875907-5.28 Xinjiang732358910-25.32 Total output China75562284362745.95
Unit: metric ton
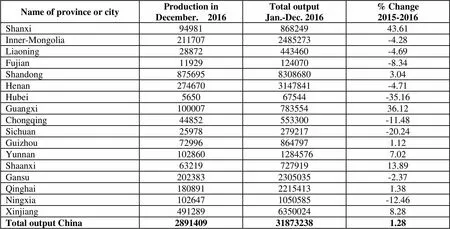
Name of province or cityProduction inDecember. 2016Total outputJan.-Dec. 2016% Change2015-2016 Shanxi9498186824943.61 Inner-Mongolia2117072485273-4.28 Liaoning28872443460-4.69 Fujian11929124070-8.34 Shandong87569583086803.04 Henan2746703147841-4.71 Hubei565067544-35.16 Guangxi10000778355436.12 Chongqing44852553300-11.48 Sichuan25978279217-20.24 Guizhou729968647971.12 Yunnan10286012845767.02 Shaanxi6321972791913.89 Gansu2023832305035-2.37 Qinghai18089122154131.38 Ningxia1026471050585-12.46 Xinjiang49128963500248.28 Total output China2891409318732381.28
Unit: metric ton

Name of province Production inDecember. 2016Total outputJan.-Dec. 2016% Change2015-2016 Shanxi12066481414136910.84 Inner-Mongolia25515894105079.55 Jiangxi Shandong161043018498495-2.52 Henan106571412134199-6.17 Guangxi91554990600107.09 Chongqing5164960007719.76 Guizhou401197449613620.39 Yunnan10789010345711.3 Total output China5614407609073193.39
Unit: metric ton

Name of province or cityProduction inDecember. 2016Total outputJan.-Dec. 2016% Change2015-2016 Inner-Mongolia Liaoning Jiangxi649833-54.5 Guangxi1239896579.3 Sichuan1183553.82 Yunnan Shaanxi22532869017.49 Gansu9741143227-6.43 Xinjiang1001118131.68 Total output China14801219944-8.67
Unit: metric ton

Name of metalProduction inDecember. 2016Total outputJan.-Dec. 2016% Change2015-2016 Copper75562284362745.95 Aluminium2891409318732381.28 Lead41379646653705.7 Zinc53480762734761.96 Nickel14801219944-8.67 Tin166741826819.97 Antimony168902034950.03 Mercury263348324.36 Magnesium808059102631.4 Titanium50196348515.88 Total China4730087528317082.46
Unit: metric ton
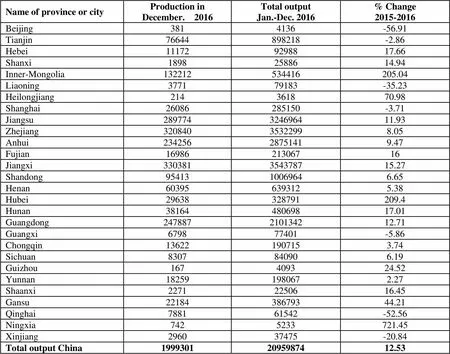
Name of province or cityProduction inDecember. 2016Total outputJan.-Dec. 2016% Change2015-2016 Beijing3814136-56.91 Tianjin76644898218-2.86 Hebei111729298817.66 Shanxi18982588614.94 Inner-Mongolia132212534416205.04 Liaoning377179183-35.23 Heilongjiang214361870.98 Shanghai26086285150-3.71 Jiangsu289774324696411.93 Zhejiang32084035322998.05 Anhui23425628751419.47 Fujian1698621306716 Jiangxi330381354378715.27 Shandong9541310069646.65 Henan603956393125.38 Hubei29638328791209.4 Hunan3816448069817.01 Guangdong247887210134212.71 Guangxi679877401-5.86 Chongqin136221907153.74 Sichuan8307840906.19 Guizhou167409324.52 Yunnan182591980672.27 Shaanxi22712250616.45 Gansu2218438679344.21 Qinghai788161542-52.56 Ningxia7425233721.45 Xinjiang296037475-20.84 Total output China19993012095987412.53
Unit: metric ton

Name of province or cityProduction inDecember. 2016Total outputJan.-Dec. 2016% Change2015-2016 Inner-Mongolia 63797655231.54 Liaoning53957204810.1 Jiangsu21764152792-14.52 Anhui7417679675435.56 Jiangxi17573173366-12.2 Henan11075713877385.14 Hubei371473608314.29 Hunan89951950162-2.49 Guangdong392451247-6.1 Guangxi199177083-41.63 Guizhou488652421515.13 Yunnan276643489325.22 Shaanxi39181849719.19 Gansu113821849-22.45 Qinghai103818594-2.73 Ningxia67525544-13.24 Xinjiang3951723.35 Total output China41379646653705.7
Unit: metric ton(metal content)

Name of province or cityProduction inDecember. 2016Total outputJan.-Dec. 2016% Change2015-2016 Hebei18699-45.89 Shanxi3248432470.68 Inner-Mongolia4560637724917.65 Liaoning6659068-7.31 Jilin1139152776.9 Heilongjiang5866328330.99 Jiangsu69-83.61 Zhejiang112894655.05 Anhui17292209527-0.5 Fujian37403257816.95 Jiangxi219602597843.49 Shandong698573531173.03 Henan1456175835.11 Hubei664268221-7.21 Hunan3833159439.78 Guangdong5648846-17.11 Guangxi2823025-58.62 Sichuan453770373-8.86 Guizhou Yunnan2368924831525.26 Tibet42484363448.27 Shaanxi1622072-23.95 Gansu132141540285.64 Qinghai478232847-21.32 Xinjiang923812245718.69 Total output China180296185067210.93
(End of November. 2016)

Name of commoditiesPeriodImportsExportsQuantity (metric ton)Value (thousand US dollars)% Change (2015-2016)Quantity (metric ton)Value (thousand US dollars)% Change (2015-2016)Copper:Copper concentrate (actual weight)Jan-Nov.153865641841722229.944.7542523359-69.8-82.26Copper Scrap (actual weight)Jan-Nov.30192825561780-7.91-28.1816762528.2319.57Blister copperJan-Nov.640929309752634.2211.79264714250-43.5-50.81Refined copper Jan-Nov.3269412158525740.44-15.843965561902140108.0367.68Copper alloysJan-Nov.4477817728724.22-0.3337317-82-79Fabricated copper productsJan-Nov.5059114312407-1.1-6.944168342812561-1.95-13.78Aluminium:AluminaJan-Nov.2660406746797-35.26-49.410415862530-63.5-53.78Aluminium ScrapJan-Nov.17395131997994-9.39-25.095781200-36.07-30.21Primary AluminiumJan-Nov.129282236584-12.92-18.821671228967-37.67-50.89Aluminium alloysJan-Nov.50830114048-17.73-19.52452623834387-6.68-17.82Fabricated Aluminium productsJan-Nov.3543252204282-18.27-14.66373605510474468-3.02-12.92Lead:Lead concentrateJan-Nov.13027061341643-23.96-29.93Unwrought refined leadJan-Nov.3651041-47.85-30.41513929593-65.95-65.74Unwrought refined lead alloys Jan-Nov.179493220515.8-5.03140533954.85-20.25Fabricated LeadJan-Nov.3233584168.1516.91242127966-38.6-37.12Zinc:Zinc concentrate (actual weight)Jan-Nov.18070621096971-40.04-42.14288450-51.02-92.93Unwrought refined ZincJan-Nov.400951787108-10.69-14.881922938919-79.86-81.62Unwrought refined Zinc alloysJan-Nov.90454205860-6.6-10.451234293482.8476.86Fabricated ZincJan-Nov.12287434617.582.361815411442237.9321.83Tin:Unwrought refined tin Jan-Nov.7849136166-6.58-6.46730114131039654.6Unwrought refined tin alloysJan-Nov.54711488-25.25-25.42Nickel:Unwrought nickel Jan-Nov.345403325095233.812.22783079057-63.09-78.69Unwrought nickel alloysJan-Nov.620367238-29.4-32.58664962606-63.88-73.64Fabricated nickelJan-Nov.136333853226.13-4.283820995343.07-5.64

Name of commoditiesPeriodImportsExportsQuantity (metric ton)Value (thousand US dollars)% Change (2015-2016)Quantity (metric ton)Value (thousand US dollars)% Change (2015-2016)Antimony:Unwrought antimony Jan-Nov.249130428433556543445650.6422Antimony oxideJan-Nov.8615516-20.69-35.813612519360025.87-0.95Molybdenum:Molybdenum concentrate (actual weight)Jan-Nov.1865910985761.2938.7860434483356.9827.35Ferro-molybdenumJan-Nov.45185-79.2-94.3446245584511451Molybdenum OxideJan-Nov.21260-10.83-41.52370351174128.8132.2Magnesium:Unwrought magnesiumJan-Nov.486259813.694.43125497296667.080.89Magnesium turnings, particles and powderJan-Nov.9521-88.8944.0166365152795-5.5-9.56Tungsten:Tungsten ore concentrateJan-Nov.423922482-3.37-34.08139988-51.67-67.25Tungsten oxideJan-Nov.7371-78.3-61.8818615262714.31-5.53Ammonium Paratungstate Jan-Nov.55873-41321553859109.567.68Tungsten powderJan-Nov.10951923231921025288476.08-19.22 Tungsten carbide powderJan-Nov.47206136.99-12.8416811146236.820.39 Ferro-tungstenJan-Nov.21093895830.92.35 Silver: (unit in kg) Unwrought silverJan-Nov.703965296980-13.94-27.291765801100309-3.553.15 Silver powderJan-Nov.16508733249137.4453.47126463179-6.67103.84 Semi-finished silverJan-Nov.63921475409-2.14-4.3549741224-95.4-97.9 Silver ornamentsJan-Nov.4018410583415.4641.872554215953451.15-17.9 Silverware Jan-Nov.261757-85.52-63.96187564521611.5436.41 Gold: (unit in kg) Gold ornamentsJan-Nov.767545199011.2-5.3210375230-24.85 Titanium: Fabricated titaniumJan-Nov.561537279912.76-10.831274026533016.43-0.55 Titanium concentratesJan-Nov.230991726812132.735.17122539134-61.61-40.14 Titanium dioxideJan-Nov.167979413607-11.65-13.79658464107960236.3823 Cobalt: Cobalt and Fabricated cobaltJan-Nov.1679929244705.454.76163148315-36.63-41.56 Cobalt concentratesJan-Nov.138900194576-33.87-52.9 Cobalt oxideJan-Nov.3665849-64.72-32.86903616990625.144.43 Cobalt nitrateJan-Nov.4935636.4124.33 Cobalt carbonateJan-Nov.13134-88.08-89.851384162990.11-16.58
Unit: metric ton
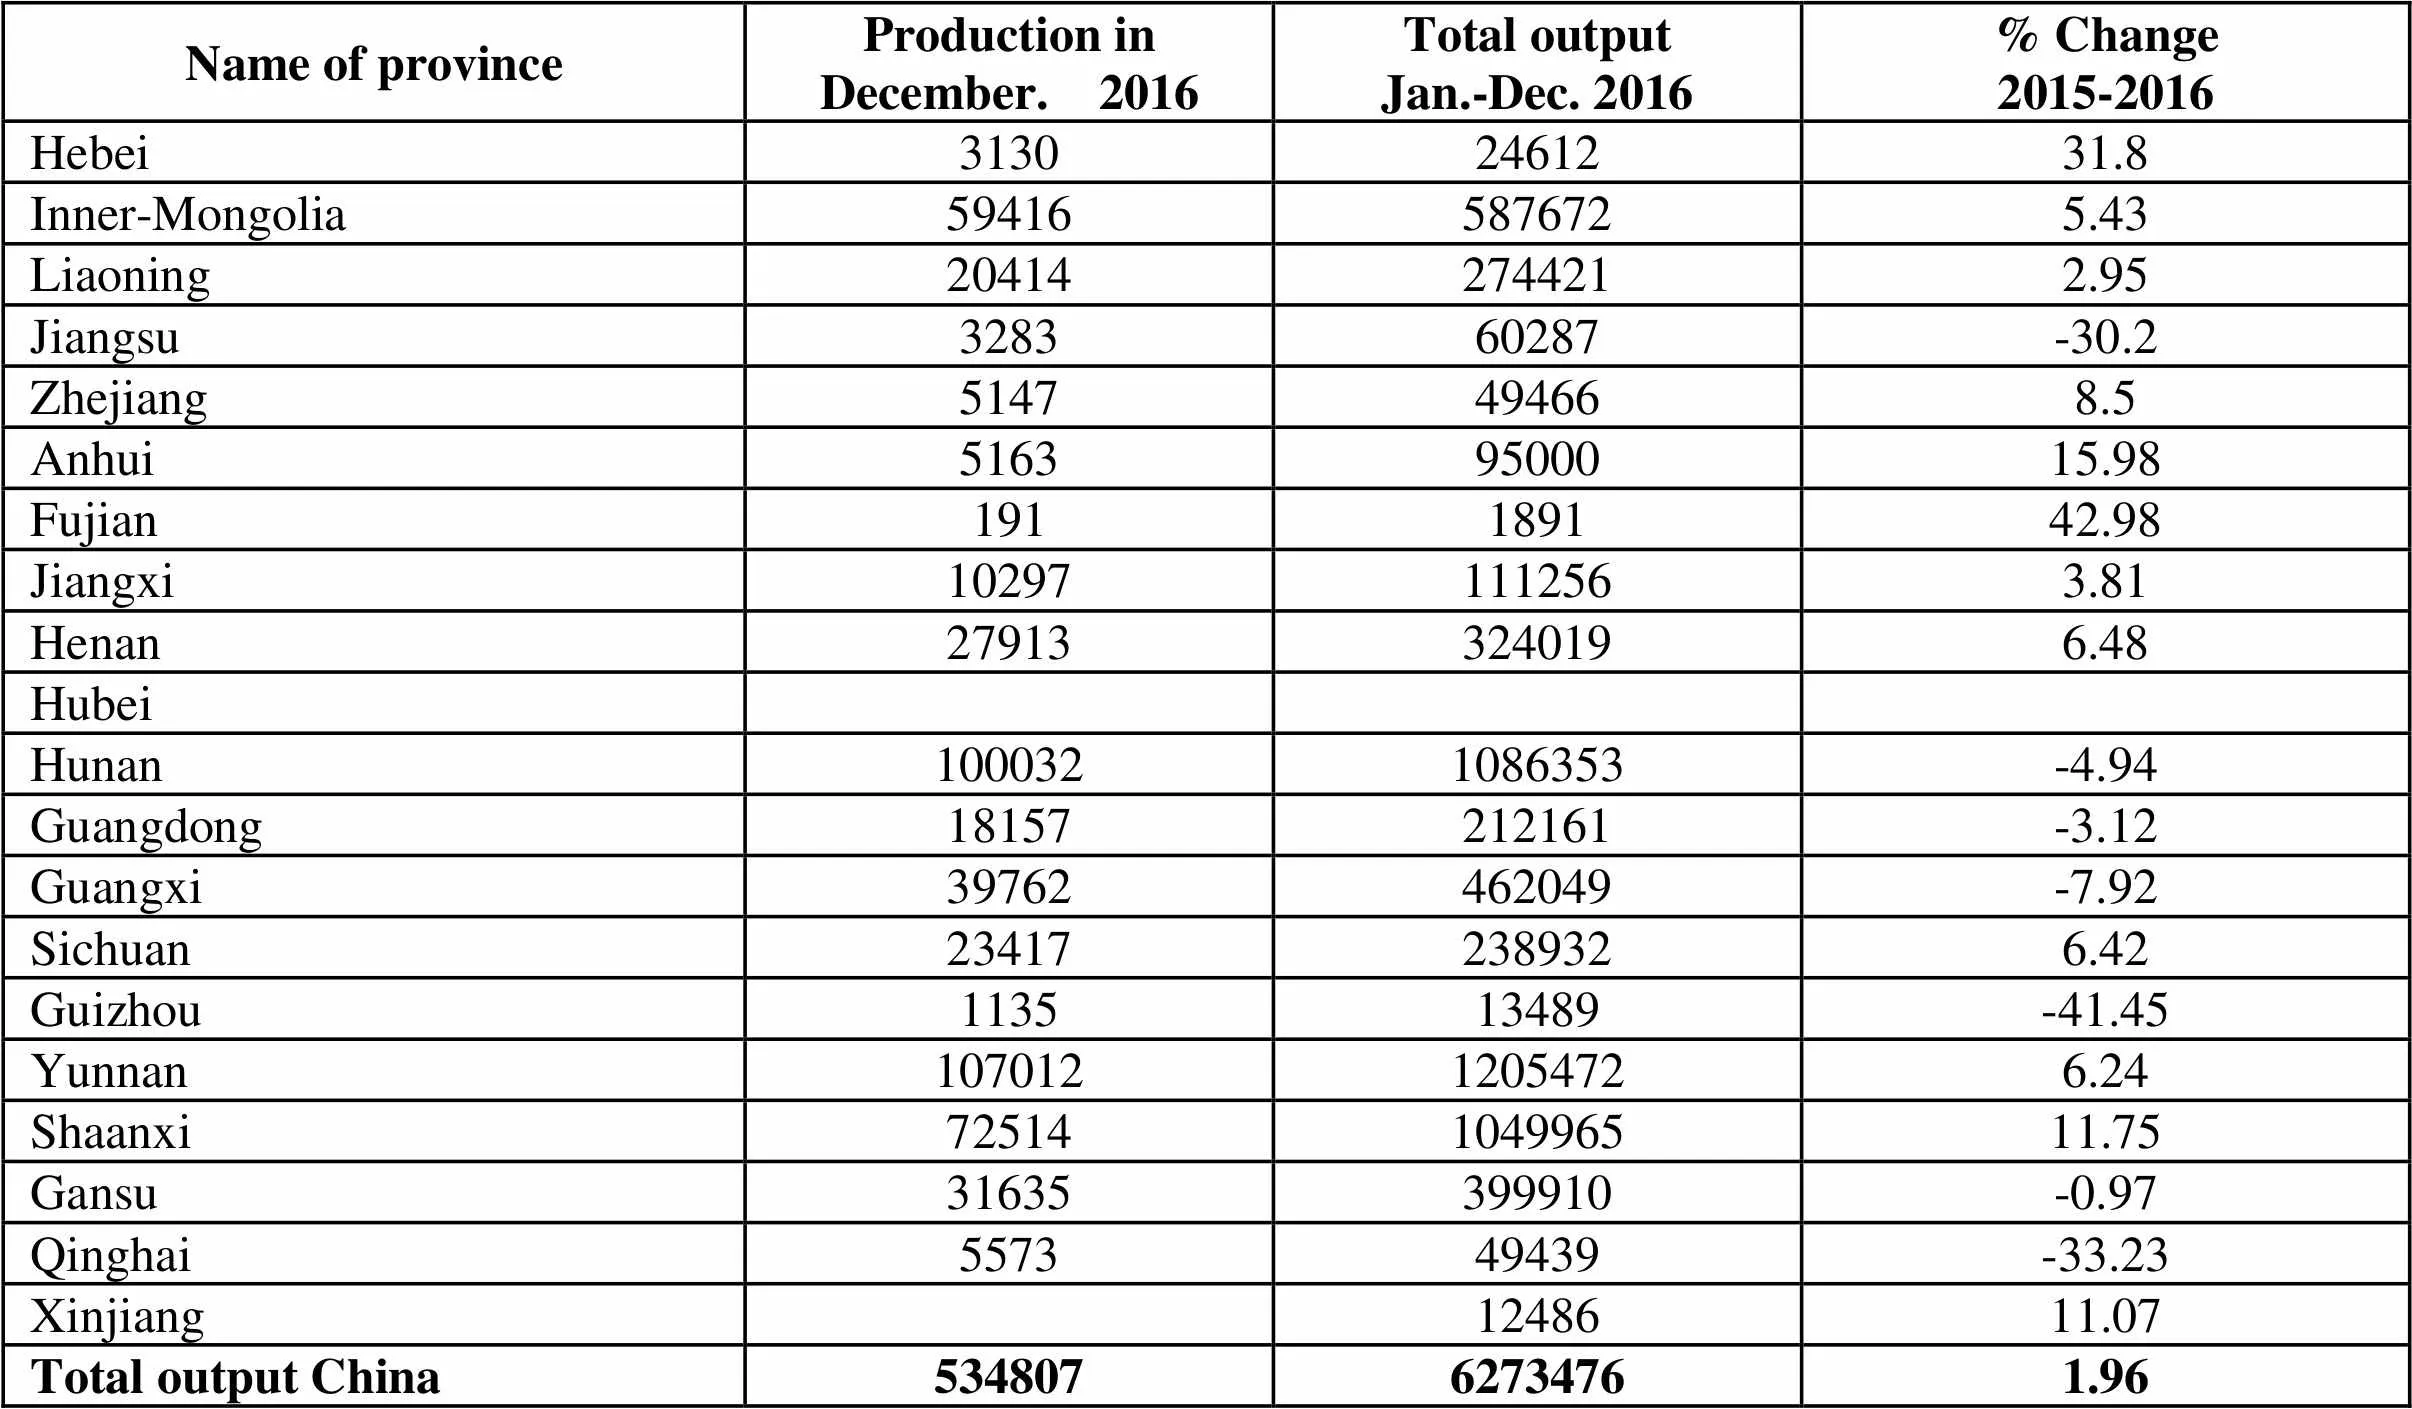
Name of provinceProduction inDecember. 2016Total outputJan.-Dec. 2016% Change2015-2016 Hebei31302461231.8 Inner-Mongolia594165876725.43 Liaoning204142744212.95 Jiangsu328360287-30.2 Zhejiang5147494668.5 Anhui51639500015.98 Fujian191189142.98 Jiangxi102971112563.81 Henan279133240196.48 Hubei Hunan1000321086353-4.94 Guangdong18157212161-3.12 Guangxi39762462049-7.92 Sichuan234172389326.42 Guizhou113513489-41.45 Yunnan10701212054726.24 Shaanxi72514104996511.75 Gansu31635399910-0.97 Qinghai557349439-33.23 Xinjiang1248611.07 Total output China53480762734761.96
