Comparison of soil physico-chemical properties under different land-use and cover types in northeasternChina's Horqin Sandy Land
2016-12-19YuQiangLiJianPengZhangXueYongZhaoTongHuiZhangYuLinLiXinPingLiuYinPingChen
YuQiang Li,JianPeng Zhang,XueYong Zhao,TongHui Zhang,YuLin Li,XinPing Liu,YinPing Chen
1.Northwest Institute of Eco-Environment and Resources,Chinese Academy of Sciences,Lanzhou,Gansu 730000,China
2.School of Environmental and Municipal Engineering,Lanzhou Jiaotong University,Lanzhou,Gansu 730070,China
Comparison of soil physico-chemical properties under different land-use and cover types in northeastern
China's Horqin Sandy Land
YuQiang Li1*,JianPeng Zhang1,XueYong Zhao1,TongHui Zhang1,YuLin Li1,XinPing Liu1,YinPing Chen2
1.Northwest Institute of Eco-Environment and Resources,Chinese Academy of Sciences,Lanzhou,Gansu 730000,China
2.School of Environmental and Municipal Engineering,Lanzhou Jiaotong University,Lanzhou,Gansu 730070,China
The Horqin Sandy Land of northeastern China was originally a grassland with plenty of water and lush vegetation dominated by palatable grass species along with sparsely scattered woody species.However,it has experienced severe desertification in recent decades due to its fragile ecology together with inappropriate human activities.Currently,the landscape of the Horqin Sandy Land is dominated by irrigated croplands and sand dunes with different degrees of vegetation cover,as the region has become the most important part of the semiarid agro-pastoral ecotone of northern China.In this study,we compared soil physical and chemical properties under different land-use and cover types (irrigated cropland,rainfed cropland,sandy grassland,fixed dunes,and mobile dunes).We found that soil particle size distribution; organic C,total N,and total mineral element,microelement,and available microelement and nutrient contents; pH; CEC; and bulk density differed significantly among the land-use and cover types.In general,soil quality was highest in the cropland,intermediate in the sandy grassland,and lowest in the dunes.The most important soil quality attribute,soil organic carbon (SOC) storage,decreased in the following order:irrigated cropland (5,699 g/m2) > sandy grassland (3,390 g/m2) > rainfed cropland (2,411 g/m2) > fixed dunes (821 g/m2) > mobile dunes (463 g/m2).SOC was significantly positively correlated with a large proportion of the other soil physico-chemical parameters.Our results suggest that the key issue in restoration of the degraded soils will be to increase SOC storage,which would also create a high potential for sequestering soil C in desertified areas of the Horqin Sandy Land.Keywords:land use; land cover; soil properties; desertification; Horqin Sandy Land
1 Introduction
Human activity is the dominant cause of the observed global warming that has occurred since the mid-20th century (IPCC,2013).Anthropogenic land-use and land-cover changes trigger a chain of feedbacks in the climate system through two primary mechanisms.First,they alter biogeochemical pathways by altering the atmospheric concentrations of greenhouse gases such as carbon dioxide (CO2),methane (CH4),and nitrous oxide (N2O) in response to changes in the land-atmosphere fluxes of these gases.Second,they alter biogeophysical pathways by altering physical characteristics of the land surface such as its albedo,soil moisture content,and surface roughness (Brovkin et al.,2004,2013).Land-use andland-cover change has contributed significantly to the global increase in CO2concentrations since pre-industrial times,though its contribution is smaller than that of fossil fuel use (IPCC,2007).The roles of land-use and land-cover systems in mitigating the growth of greenhouse gas emissions,in improving the provision of ecosystem services,and in increasing carbon (C) storage in the plant-soil system have received significant attention in recent years (Ostle et al.,2009; Lal,2010; Schulte et al.,2014; O'Sullivan et al.,2015).
The Horqin Sandy Land of northeastern China (42°41'N-45°15'N,118°35'E-123°30'E) was formerly a grassland with plenty of water and lush vegetation dominated by palatable grass species,along with sparsely scattered woody species.However,it has experienced serious degradation and desertification in recent decades.The region's desertification started at the end of the 19th century,when the Qing Dynasty (1644-1912) promoted reclamation of the land for agriculture and livestock grazing (Zhou et al.,2008).However,the most severe desertification occurred from the 1950s to the 1970s.During this period,the landscape became dominated by mobile dunes,and the local people became severely impoverished due to their inability to earn a living from agriculture and livestock grazing.
To improve the ecological and living environment,the local government has been implementing a series of restoration measures,such as adjustment of the agricultural and animal husbandry structure,establishment of grazing exclosures,and implementation of tree planting.As a result,the Horqin Sandy Land now consists of a mosaic of landscape types.More and more research has focused on dynamic changes in the plant-soil continuum's C and nitrogen (N) storage during desertification (Zhou et al.,2008; Zhao et al.,2009) and on the restoration of degraded land (Su and Zhao,2003; Chen et al.,2006; Li et al.,2013,2015) in the region.However,many of these studies focused on changes in soil C and N due to a single land-cover or land-use change and did not consider other soil features.Relatively little attention has been given to the response of the soil's total mineral element,microelement,and available microelement contents and their association with other properties under a complex mixture of land-use and cover types.
The objective of the present study is to comprehensively compare soil physical and chemical properties among five land-use and cover types in the region's desertified sandy grassland.The results of this study will provide baseline data to support predictions of the changes in soil properties over time in the study region and data to support future meta-analyses of the soil properties under different land-use and cover types in different ecotopes.
2 Materials and methods
2.1Site description
The study was conducted in the southern part of the Horqin Sandy Land,Inner Mongolia,China,near the Naiman Desertification Research Station of the Chinese Academy of Sciences (42°55'52"N,120°41'56"E,377 m a.s.l.).The region has a continental semiarid monsoon temperate climate regime.Mean annual precipitation is 366 mm,of which 70% falls from June to August.Mean annual potential evaporation is 1,935 mm and mean annual air temperature is 6.8 °C.Mean monthly temperatures range from a minimum of -13.2 °C in January to a maximum of 23.5 °C in July.Mean wind speed is 4.3 m/s,with occasional occurrences of gales ≥ 20 m/s in winter and spring,when the vegetation cover is lowest and the soil is driest (Li et al.,2013).The zonal soils are identified as Kastanozems based on the FAO soil classification system (FAO,2006); however,as a result of desertification,the current dominant soils are Ustic Sandic Entisols.
The region's current landscape is dominated by cropland and by sand dunes with different degrees of vegetation cover,along with a small area of sandy grassland.In the present study,we selected five land-use and cover types for sampling:(1) Irrigated cropland,which has been converted from natural grasslands for at least 40 years,is planted with maize.Irrigation with groundwater is available.(2) Rainfed cropland,which has been converted from desertified land dominated by different kinds of sand dunes,is characterized by low water availability,low nutrient retention,and low soil fertility,and is planted with buckwheat or beans.Irrigation is unavailable.(3) Sandy grassland is natural grassland that has survived decades of desertification,and is characterized by light degradation.Although it has a low livestock carrying capacity,it has been protected against degradation by grazing exclusion.(4) Fixed dunes have resulted from natural restoration of mobile dunes by excluding human activities,and the vegetation cover now ranges from 30% to 50%.(5) Mobile dunes are characterized by very low (<5%) vegetation cover and greatly depleted soil nutrients.These dunes were the dominant feature of the study area in the 1970s as a result of severe desertification.
2.2Soil sampling
We established one study site for each of the land-use and cover types.At each of the five sites,we collected soil samples to a depth of 100 cm at six random locations in August.A soil pit (200 cm in length,150 cm in width,and 150 cm in depth) was excavated at each location.Soil samples were thencollected from five layers (0~10,10~20,20~40,40~60,and 60~100 cm) using a knife made from bamboo.In each layer,a single composite sample was prepared from soil collected at 5 to 10 sampling points on three sides of the pit.In addition,three soil cores were taken from each layer with a stainless-steel cylinder (100 cm3in volume) for the determination of soil bulk density.
2.3Laboratory analyses
Soil samples were air-dried and hand-sieved through a 2-mm nylon mesh to remove roots and other debris before analysis in the lab.Soil particle size distribution,and the contents of organic C,total N,total mineral elements (SiO2,Al2O3,K2O,Na2O,Fe2O3,CaO,MgO,TiO2,P2O5,and MnO),and microelements (total Fe,Mn,Zn,B,Cu,and Mo) were measured to a depth of 100 cm in the five soil layers.However,the soil pH,available nutrients (available N,P,and K),total cation exchange capacity (CEC),and available microelements (available Cu,Zn,Fe,Mn,Mo,and S) were only measured in the surface soil (0~20 cm,a single layer created by mixing the samples from 0 to 10 cm and 10 to 20 cm).A portion of each air-dried soil sample was ground to pass through a 0.1-mm mesh for determination of the above mentioned properties,excluding the soil particle size distribution and pH.
The particle size distribution was determined by the wet sieving method using sodium hexametaphosphate as the dispersing agent (ISSCAS,1978).The soil sample was separated into five fractions by means of a nest of sieves with openings of 2.00,0.50,0.25,0.10,and 0.05 mm:coarse sand (2.00 - 0.50 mm),medium sand (0.50 - 0.25 mm),fine sand (0.25 - 0.10 mm),very fine sand (0.10 - 0.05 mm),and silt+clay (< 0.05 mm).Soil pH was determined at 25 °C in a 1:2.5 (w/w) soil:water suspension (Multiline F/SET-3; WTW,Weilheim,Germany).Soil organic C was determined using the Walkley-Black dichromate oxidation procedure (Nelson and Sommers,1982).Total N was determined with the Kjeldahl procedure (McGill and Figueiredo,1993).
Available N was measured by the alkaline diffusion method,and available K was extracted with 1 M ammonium acetate and determined by means of atomic absorption spectroscopy (ISSCAS,1978).Available P was determined by the Olsen method (Olsen et al.,1954).Total mineral element concentrations were determined by means of inductively coupled plasma atomic-emission spectroscopy (ICP-AES),using lithium metaborate as a fused salt.CEC was determined by washing the soil with sodium acetate and then ammonium acetate,as outlined by Hesse (1972).
Microelement concentrations were determined as follows:B,by curcuma colorimetry following Na2CO3fusion; Mo,by inductively coupled plasma mass spectrometry (ICP-MS) following HF-HClO4-HNO3digestion; and Zn,Mn,Fe,and Cu were determined by ICP-AES following HF-HClO4-HNO3digestion.The available microelement concentrations were determined as follows:available Fe and Cu,by means of diethylenetriamine pentaacetic acid (DTPA) extraction followed by ICP; available Mo,by oxalic acid and ammonium oxalate extraction combined with polarography; available Mn,by ammonium acetate and hydroquinone extraction combined with atomic absorption; and available Zn and S,by DTPA extraction combined with atomic absorption.
2.4Data analysis
The C and N storage per unit area by volume in soil to a depth of 100 cm was estimated using the following equation:

where ES is the elemental storage (in g/m2),EC is the elemental concentration (in g/kg),BD is soil bulk density (in g/cm3),10 represents a unit conversion factor,and Ti(I = 1,2,…,5) is the thickness of soil sampling layer i (in cm).
The measured variables and the resultant C and N storage were compared among the land-use and cover types using one-way ANOVA.When the ANOVA results were significant (P<0.05),we compared means using the least significant-difference (LSD) test.Correlations between parameters were also calculated using Pearson's correlation coefficient (r).The statistical analysis was performed using version 13.5 of the SPSS software (SPSS,Chicago,IL).
3 Results
3.1Soil particle-size distribution and bulk density
The soil particle-size distribution (Figure 1) differed significantly (P<0.05) among the land-use and cover types in each of the five soil layers,except for the proportion of coarse sand (which was not present at any site and any depth).The dominant soil particle sizes for the combined layer from 0 to 100 cm were fine sand in the fixed and mobile dunes (59.0% and 66.7%,respectively),very fine sand in rainfed cropland and sandy grassland (31.2% and 43.4%,respectively),and silt+clay in irrigated cropland (40.5%).The least abundant size classes were medium sand in the irrigated cropland,rainfed cropland,and sandy grassland (6.6%,16.3%,and 13.3%,respectively),very fine sand in the mobile dunes (2.0%),andsilt+clay in the fixed dunes (2.8%).
The proportion of silt+clay for the combined soil layers decreased significantly in the following order:irrigated cropland (40.5%) > rainfed cropland (24.3%) > sandy grassland (17.5%) > fixed dunes (4.7%) > mobile dunes (2.8%).For the other soil particle-size fractions,there was no clear trend among the investigated land-use and cover types.
Soil bulk density varied within a narrow range (1.42 to 1.64 g/cm3),but differed significantly among the land-use and cover types (Figure 2).The average soil bulk density in the combined top 100 cm of the soil decreased in the order mobile dunes (1.64 g/cm3) >fixed dunes (1.59 g/cm3) > rainfed cropland (1.50 g/cm3) > irrigated cropland (1.47 g/cm3) > sandy grassland (1.42 g/cm3).
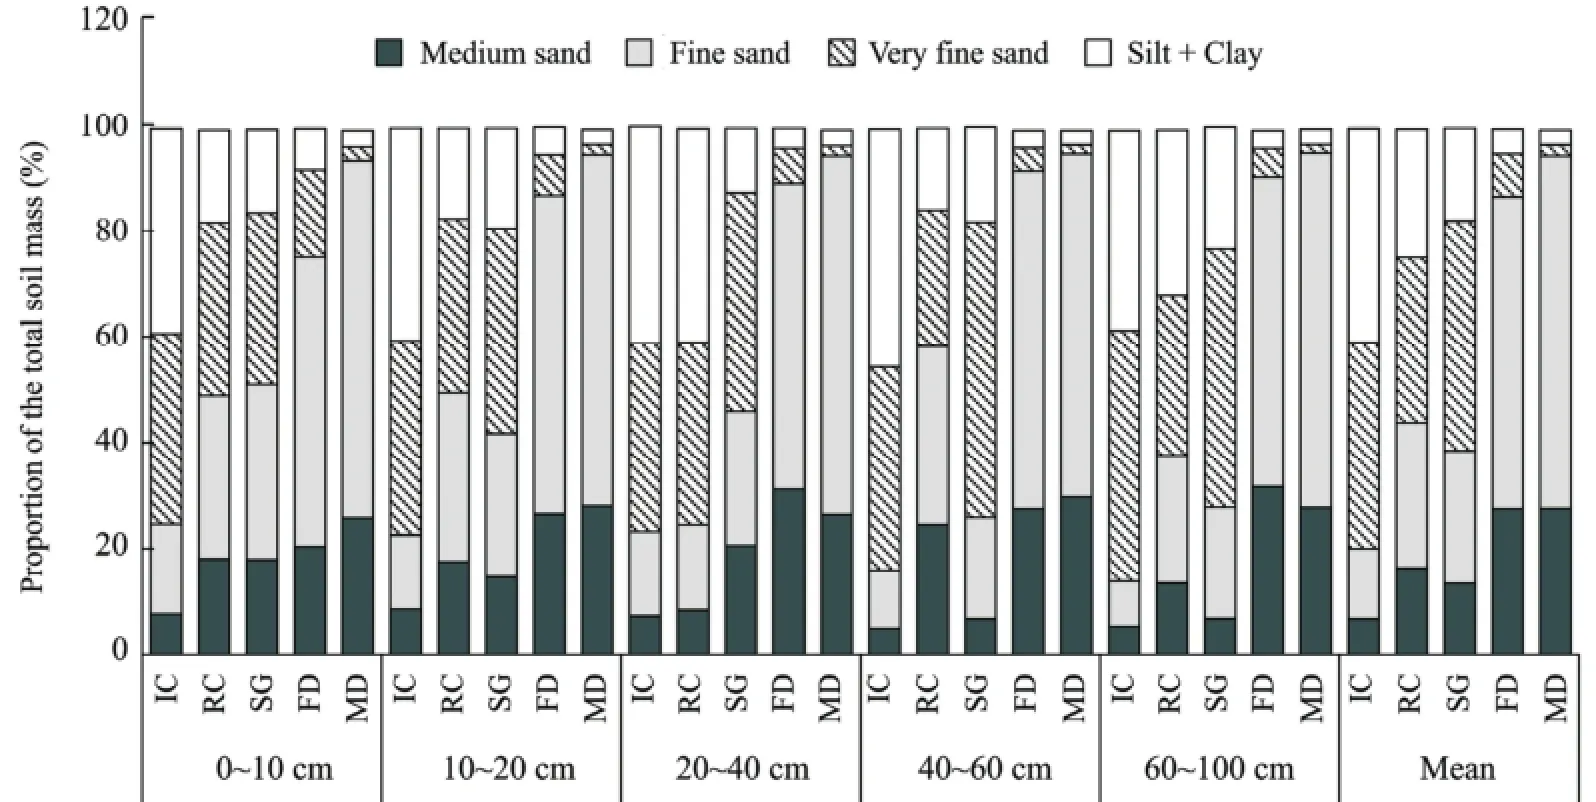
Figure 1 Soil particle-size distributions to a depth of 100 cm in irrigated cropland (IC),rainfed cropland (RC),sandy grassland (SG),fixed dunes (FD),and mobile dunes (MD).The coarse sand size class was not present for any land-use and cover type
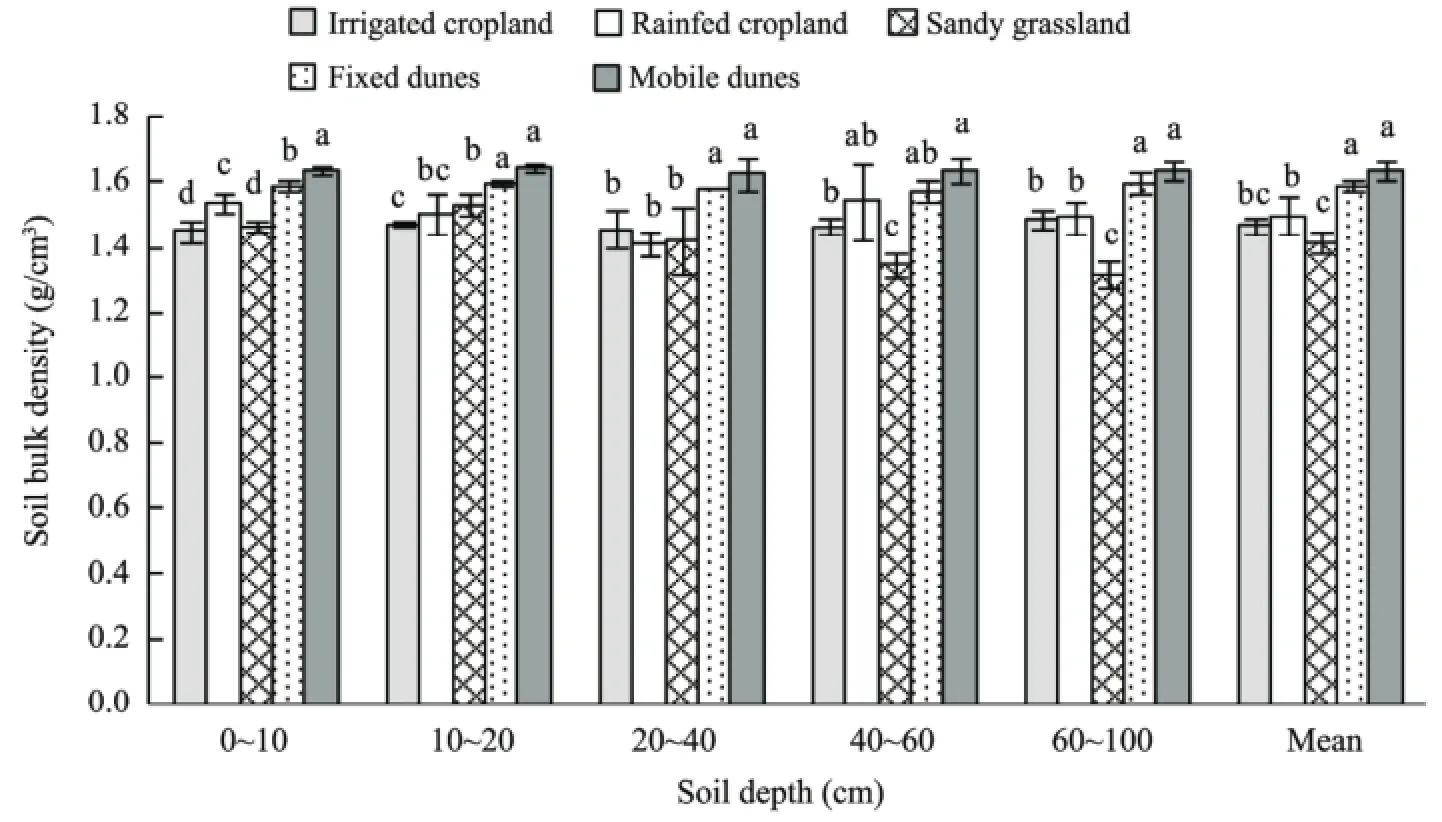
Figure 2 Soil bulk density to a depth of 100 cm in irrigated cropland,rainfed cropland,sandy grassland,fixed dunes,and mobile dunes.Values represent means ± SD.For a given soil layer,bars labeled with different letters differed significantly (P <0.05) between land-use and cover types
3.2Soil organic C and total N
The highest values of the combined average SOC and total nitrogen (TN) concentrations for the top 100 cm of the soil (Table 1) were observed in irrigated cropland (4.51 g C/kg and 0.44 g N/kg),whereas the lowest were observed in mobile dunes (0.35 g C/kg and 0.06 g N/kg).There were no significant differences in SOC and TN concentrations for the combined soil layers between rainfed cropland and sandy grassland or between fixed dunes and mobile dunes.In general,the patterns of vertical variation indicated thatSOC and TN concentrations were highest in the 0~10 cm layer in each land-use and cover type except for the mobile dunes,where they were highest from 10 to 20 cm (SOC) and did not differ among depths (TN).The average C/N ratio for the combined five soil layers (Table 1) decreased in the order irrigated cropland (10.3) > rainfed cropland (9.3) > sandy grassland (8.2) > fixed dunes (6.2) > mobile dunes (5.9).
Similar to the trends for the SOC and TN concentrations,irrigated cropland had the highest and mobile dunes had the lowest levels of SOC and TN storage to a depth of 100 cm (Table 2).Compared with the values of 5,699 g C/m2and 552 g N/m2for irrigated cropland,the SOC and TN storage decreased by 41% and 27% (respectively) for sandy grassland,versus decreases of 58% and 48% for rainfed cropland,86% and 75% for fixed dunes,and 92% and 84% for mobile dunes.
3.3Available nutrients,pH,and CEC
The concentrations of available nutrients to a depth of 20 cm followed the order available K > available N > available P for all land-use and cover types (Figure 3).The available K was 5 to 18 times the available N,versus 8 to 91 times the available P across all sites.The highest levels of available N and P (31.4 and 21.5 mg/kg,respectively) were observed in irrigated cropland,but the highest available K (192 mg/kg) occurred in sandy grassland.The lowest values of available N and K (3.5 and 61 mg/kg,respectively) were found in mobile dunes and the lowest available P (1.7 mg/kg) was found in fixed dunes.Available N and K were significantly higher in irrigated and rainfed cropland and in sandy grassland than in the two dune types.Available P was significantly higher in the two croplands than in the other land-use and cover types.However,there were no significant differences among sandy grassland,fixed dunes,and mobile dunes for available P and between fixed dunes and mobile dunes for available K.
The pH values to a depth of 20 cm ranged from 7.1 in mobile dunes to 8.6 in sandy grassland (Figure 4),but the difference was not significant between fixed and mobile dunes or between the two cropland types and the sandy grassland,although pH was significantly higher for both cropland types than for both dune types.The CEC value to a depth of 20 cm (Figure 4) decreased in the order irrigated cropland (75.6 mmol/kg) > rainfed cropland (45.3 mmol/kg) > sandy grassland (32.6 mmol/kg) > fixed dunes (17.0 mmol/kg) > mobile dunes (16.2 mmol/kg).
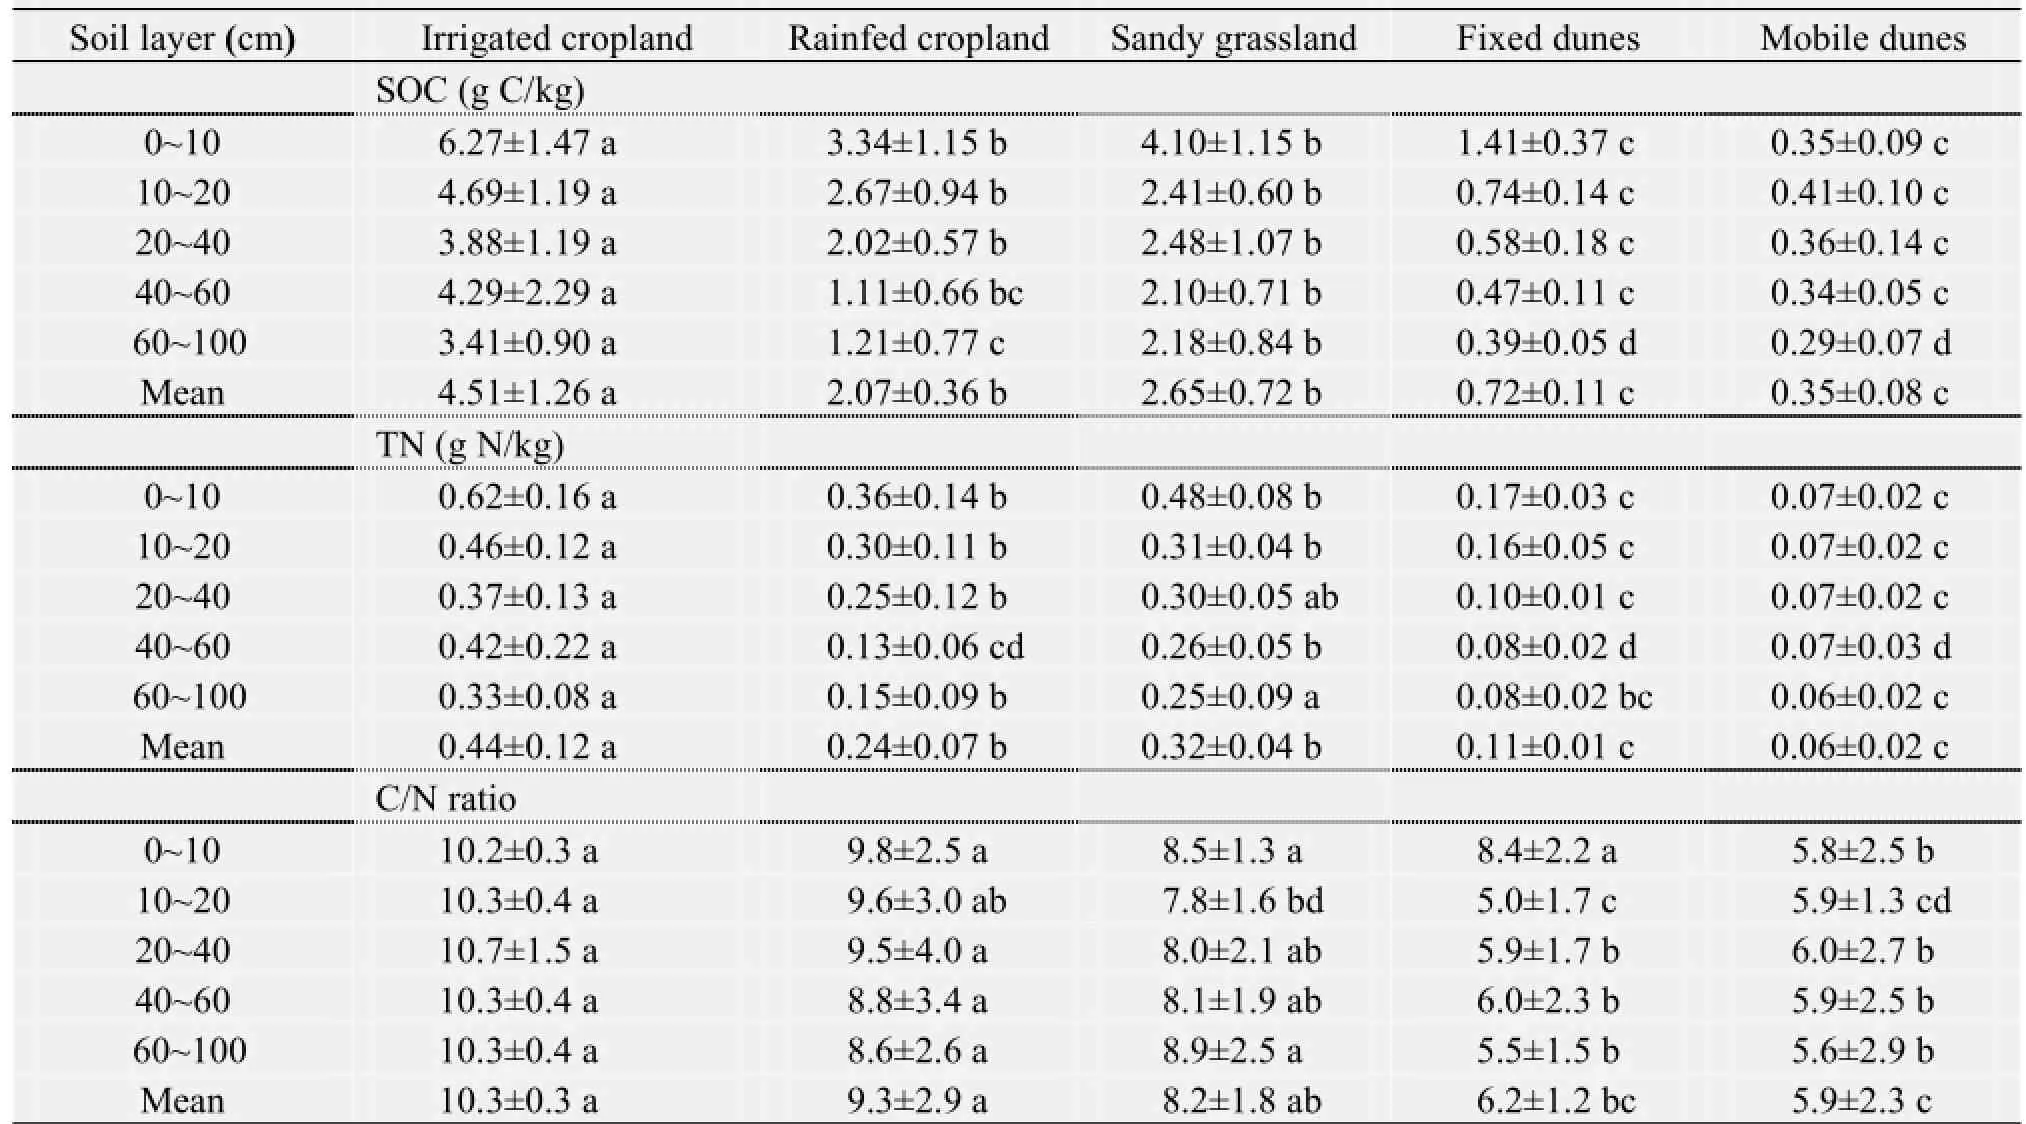
Table 1 Changes in the soil organic carbon (SOC) concentration,total nitrogen (TN) concentration,and C/N ratio to a depth of 100 cm in the five land-use and cover types
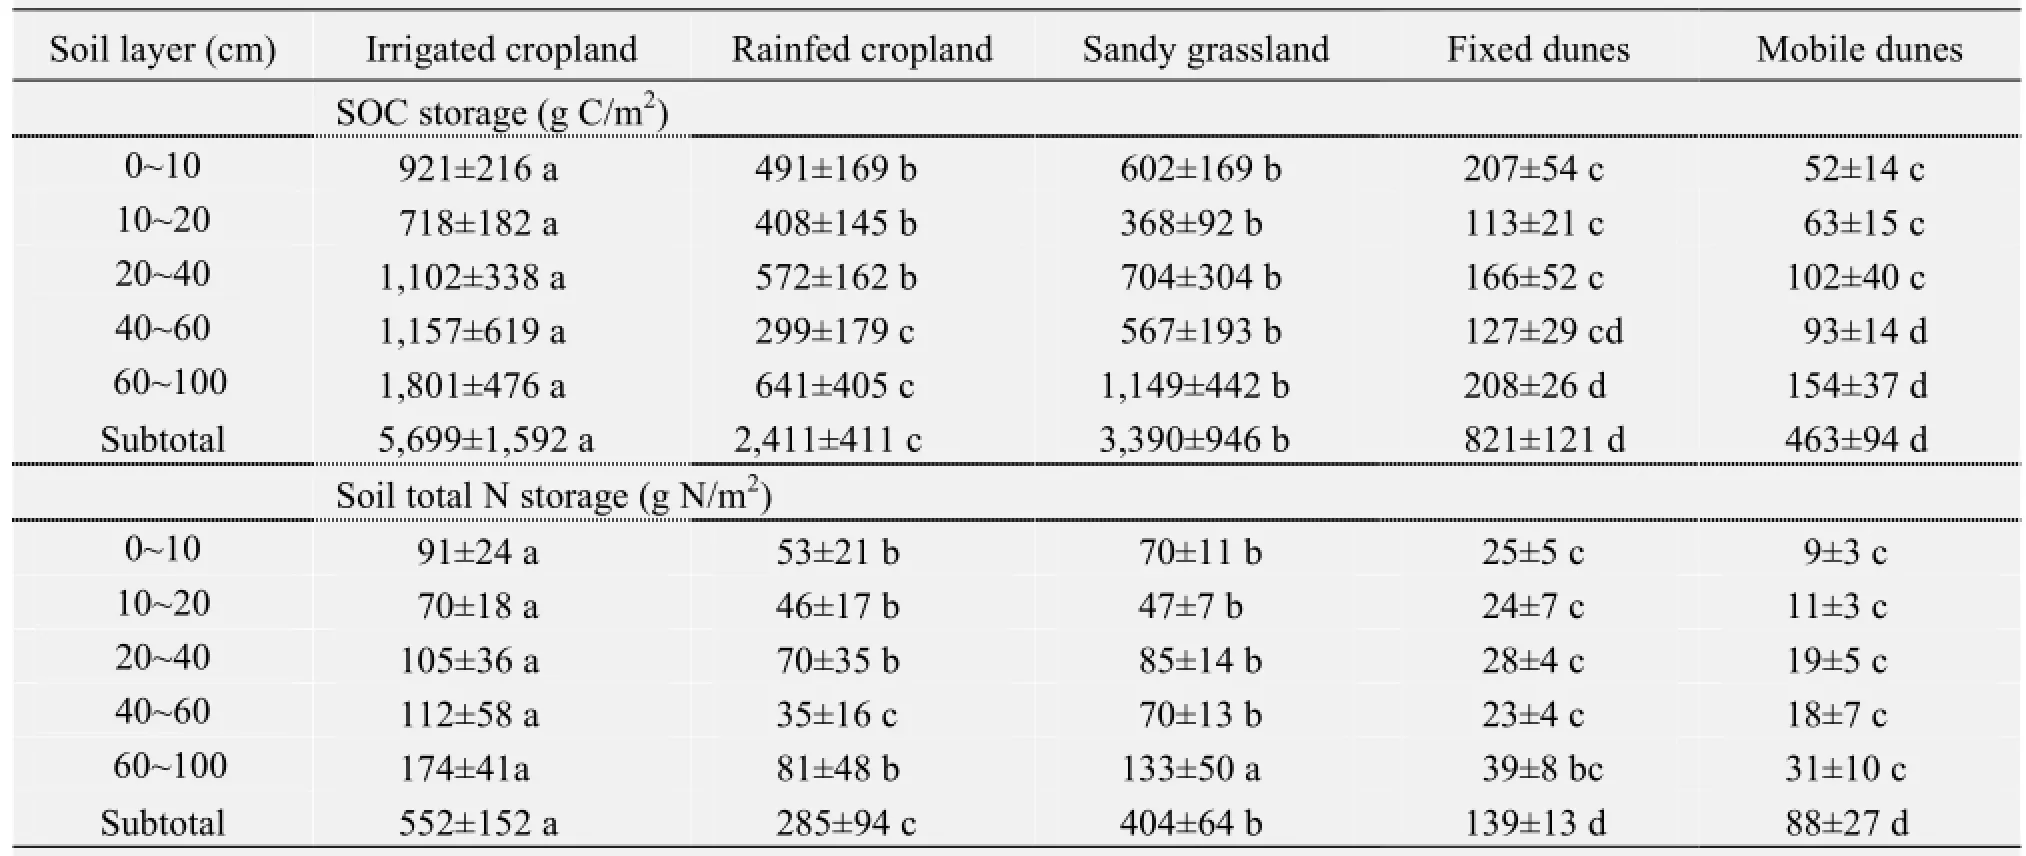
Table 2 Changes in soil organic C (SOC) and total N storage to a depth of 100 cm in the five land-use and cover types
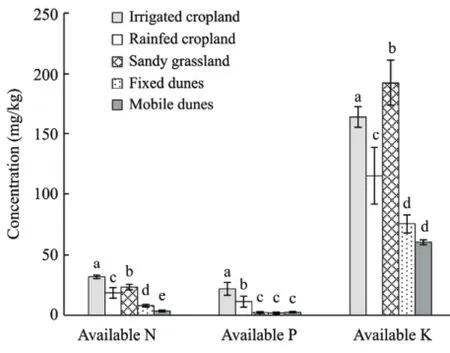
Figure 3 Available N,P,and K to a depth of 20 cm in the five land-use and cover types.For a given variable,bars labeled with different letters differed significantly (P <0.05) between land-use and cover types
3.4Total mineral elements
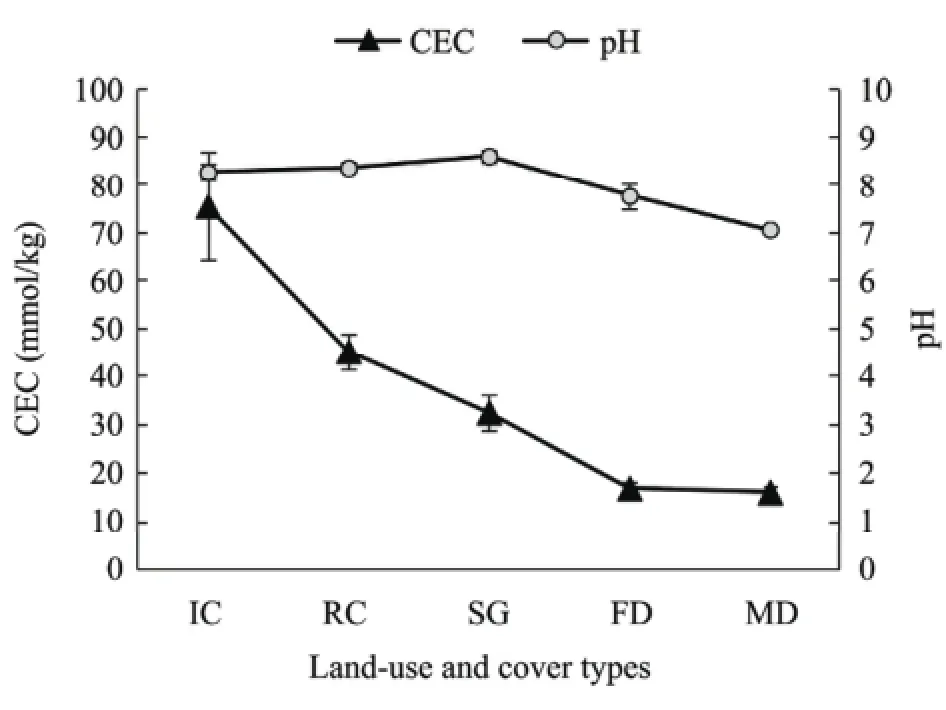
Figure 4 pH and CEC to a depth of 20 cm in irrigated cropland (IC),rainfed cropland (RC),sandy grassland (SG),fixed dunes (FD),and mobile dunes (MD).Values represent means ± SD
The average contents of total mineral elements for the top 100 cm of the soil under different land-use and cover types declined in the following order:SiO2>Al2O3> K2O > Na2O > Fe2O3> CaO > MgO > TiO2>P2O5≥ MnO,except for an Fe2O3content slightly greater than the Na2O content in irrigated cropland (Table 3).The K2O contents did not differ significantly among the land-use and cover types,but all other minerals showed significant differences; in general,the values for the two dune types were significantly lower than those for the other land-use and cover types.Across all sites,the average contents (%,dry weight basis) ranged from 73.2% to 88.3% for SiO2,6.0% to 11.2% for Al2O3,2.73% to 2.90% for K2O,1.20% to 2.27% for Na2O,0.58% to 2.44% for Fe2O3,0.34% to 2.23% for CaO,0.11% to 0.85% for MgO,0.09% to 0.50% for TiO2,0.02% to 0.07% for P2O5,and 0.02% to 0.05% for MnO.The irrigated cropland had the highest values for most minerals except K2O and SiO2.The highest value for K2O was found in sandy grassland.The mobile dunes had the highest value for SiO2.
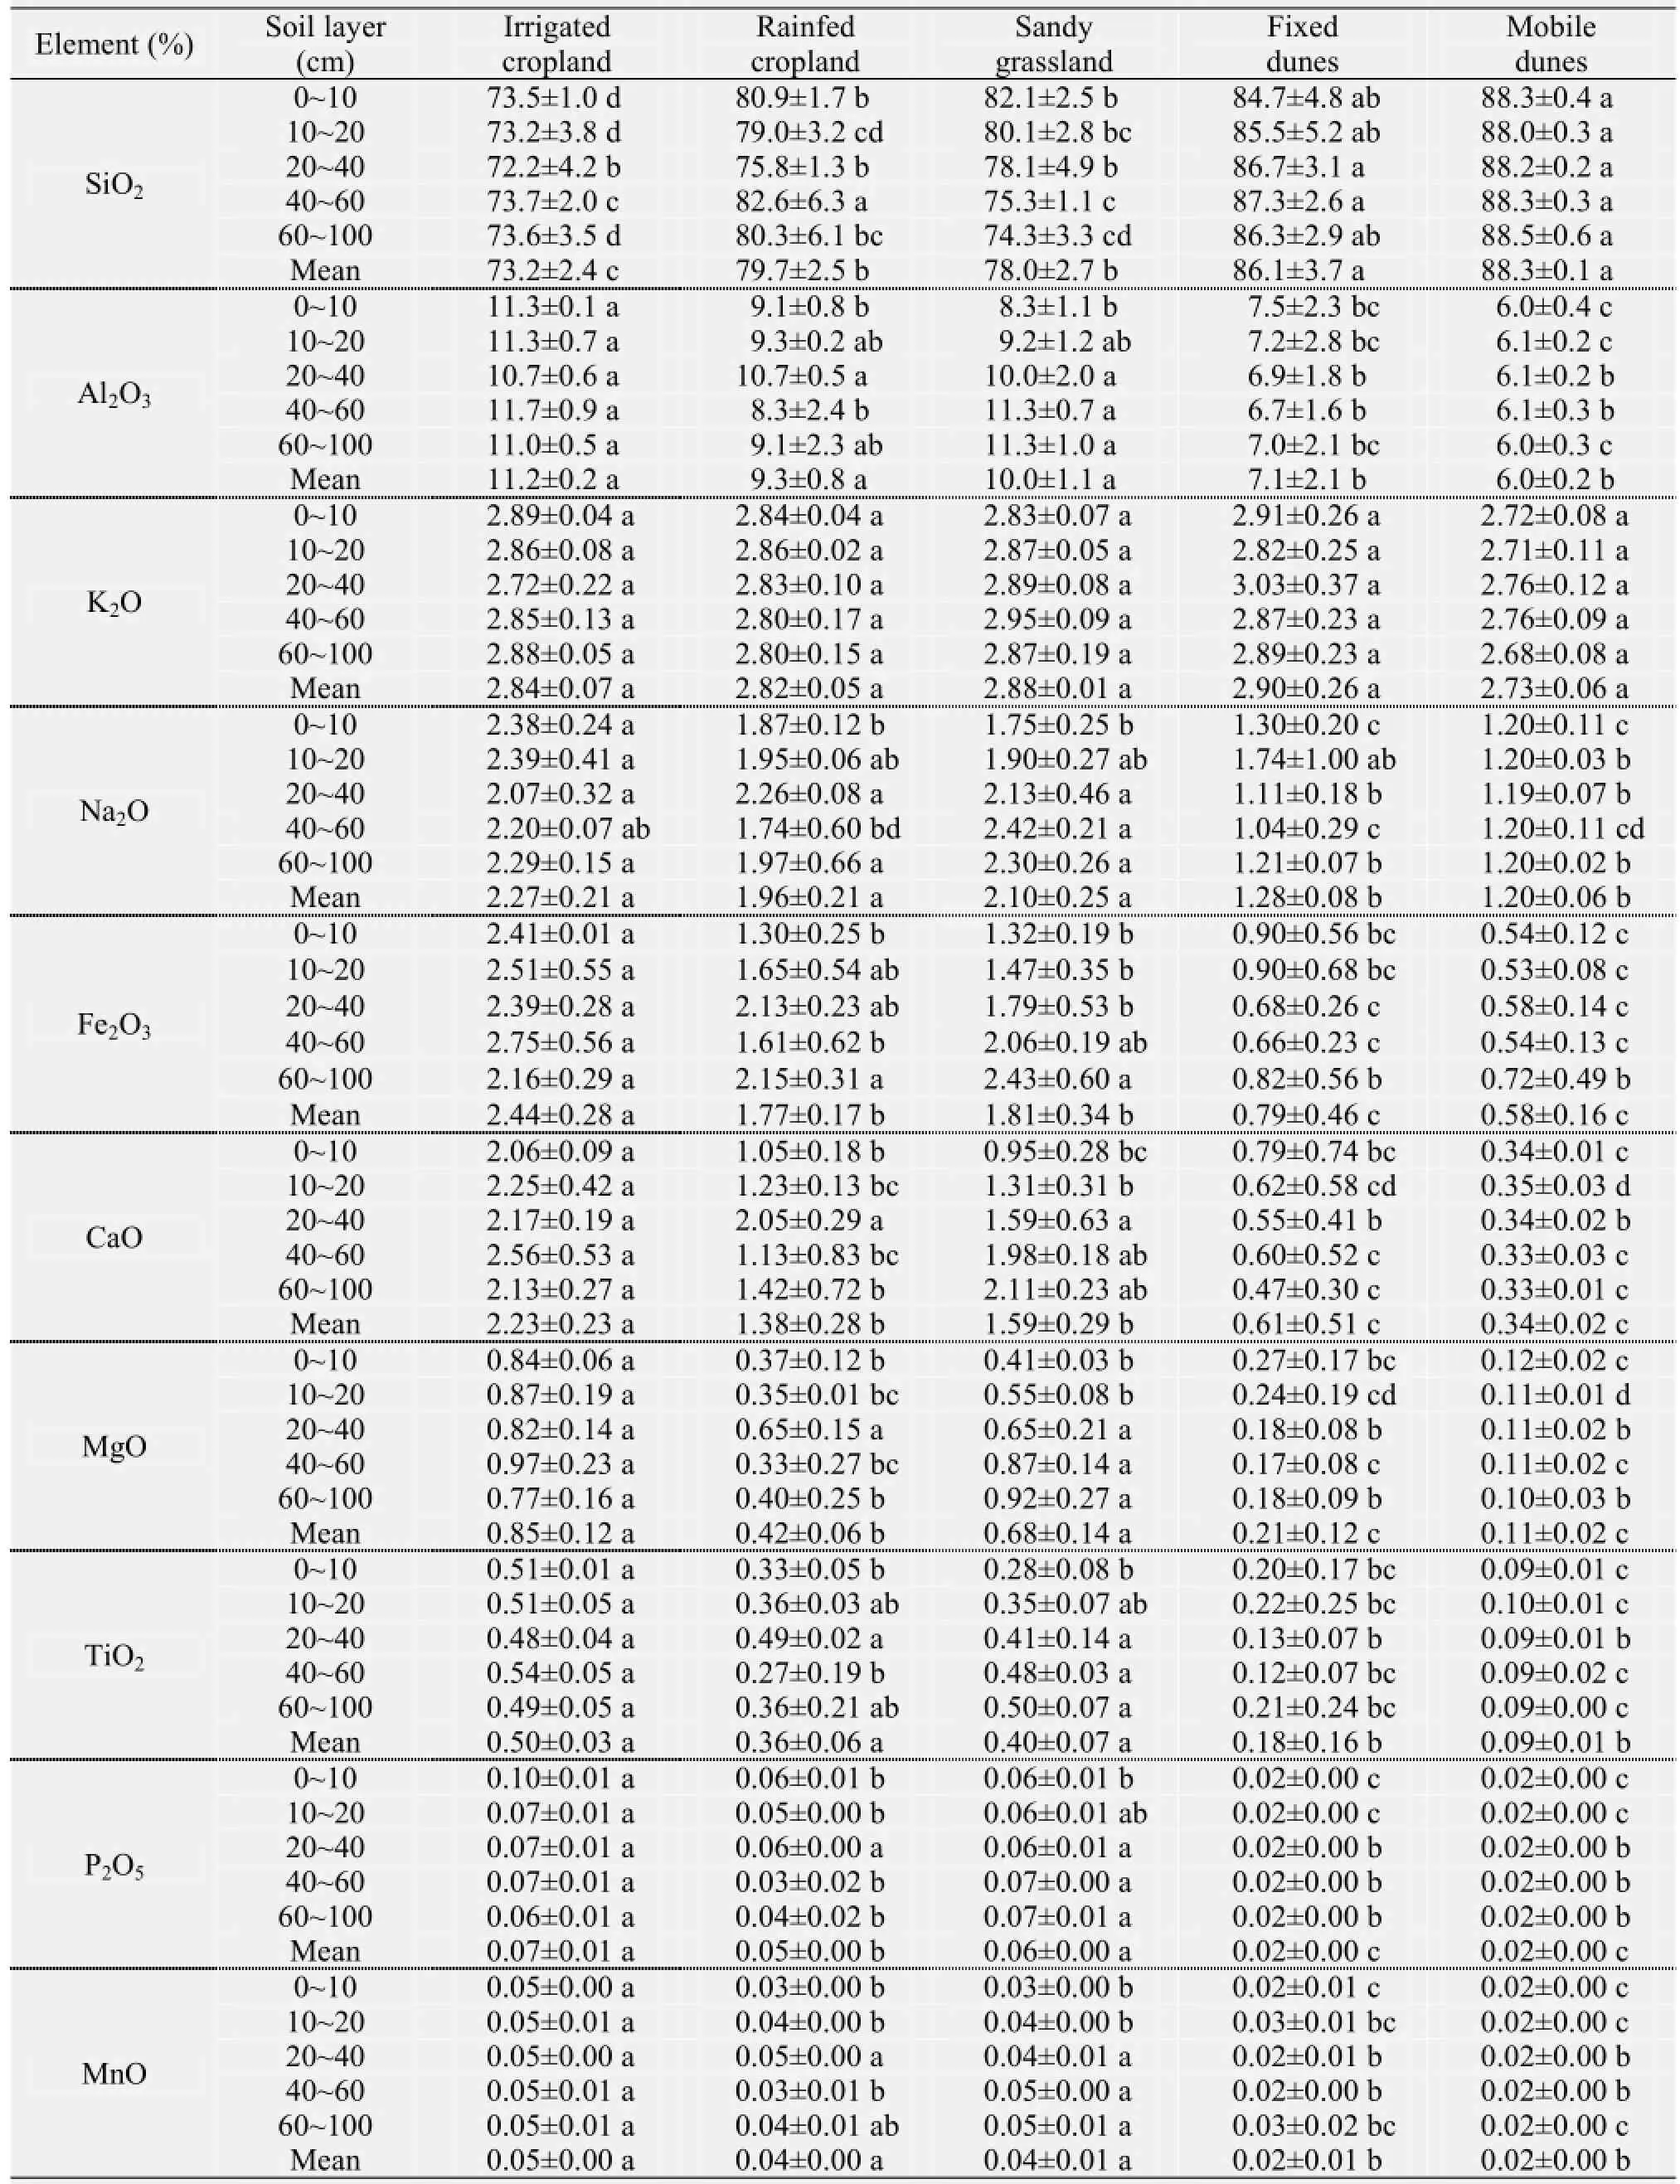
Table 3 Total concentrations (% of dry weight) of soil mineral elements to a depth of 100 cm in the five land-use and cover types
3.5Microelements
The average contents of the microelements to a depth of 100 cm in the soil differed significantly among the land-use and cover types (Table 4).The average microelement contents were in the order Fe >Mn > Zn > B > Cu > Mo at most sites; for sandy grassland,the order was Fe > Mn > B > Zn > Cu > Mo.The average contents of Fe,Mn,Zn,Cu,and Mo decreased in the order irrigated cropland > rainfed cropland > sandy grassland > fixed dunes > mobile dunes (except for slightly higher Mn in mobile dunes than in fixed dunes).For B,the order was sandy grassland > irrigated cropland > rainfed cropland >fixed dunes > mobile dunes.Across all sites,the highest value was 4.2 times the lowest value for Fe,versus 2.2 times for Mn,2.4 times for Zn,5.3 times for B,2.7 times for Cu,and 13.2 times for Mo.
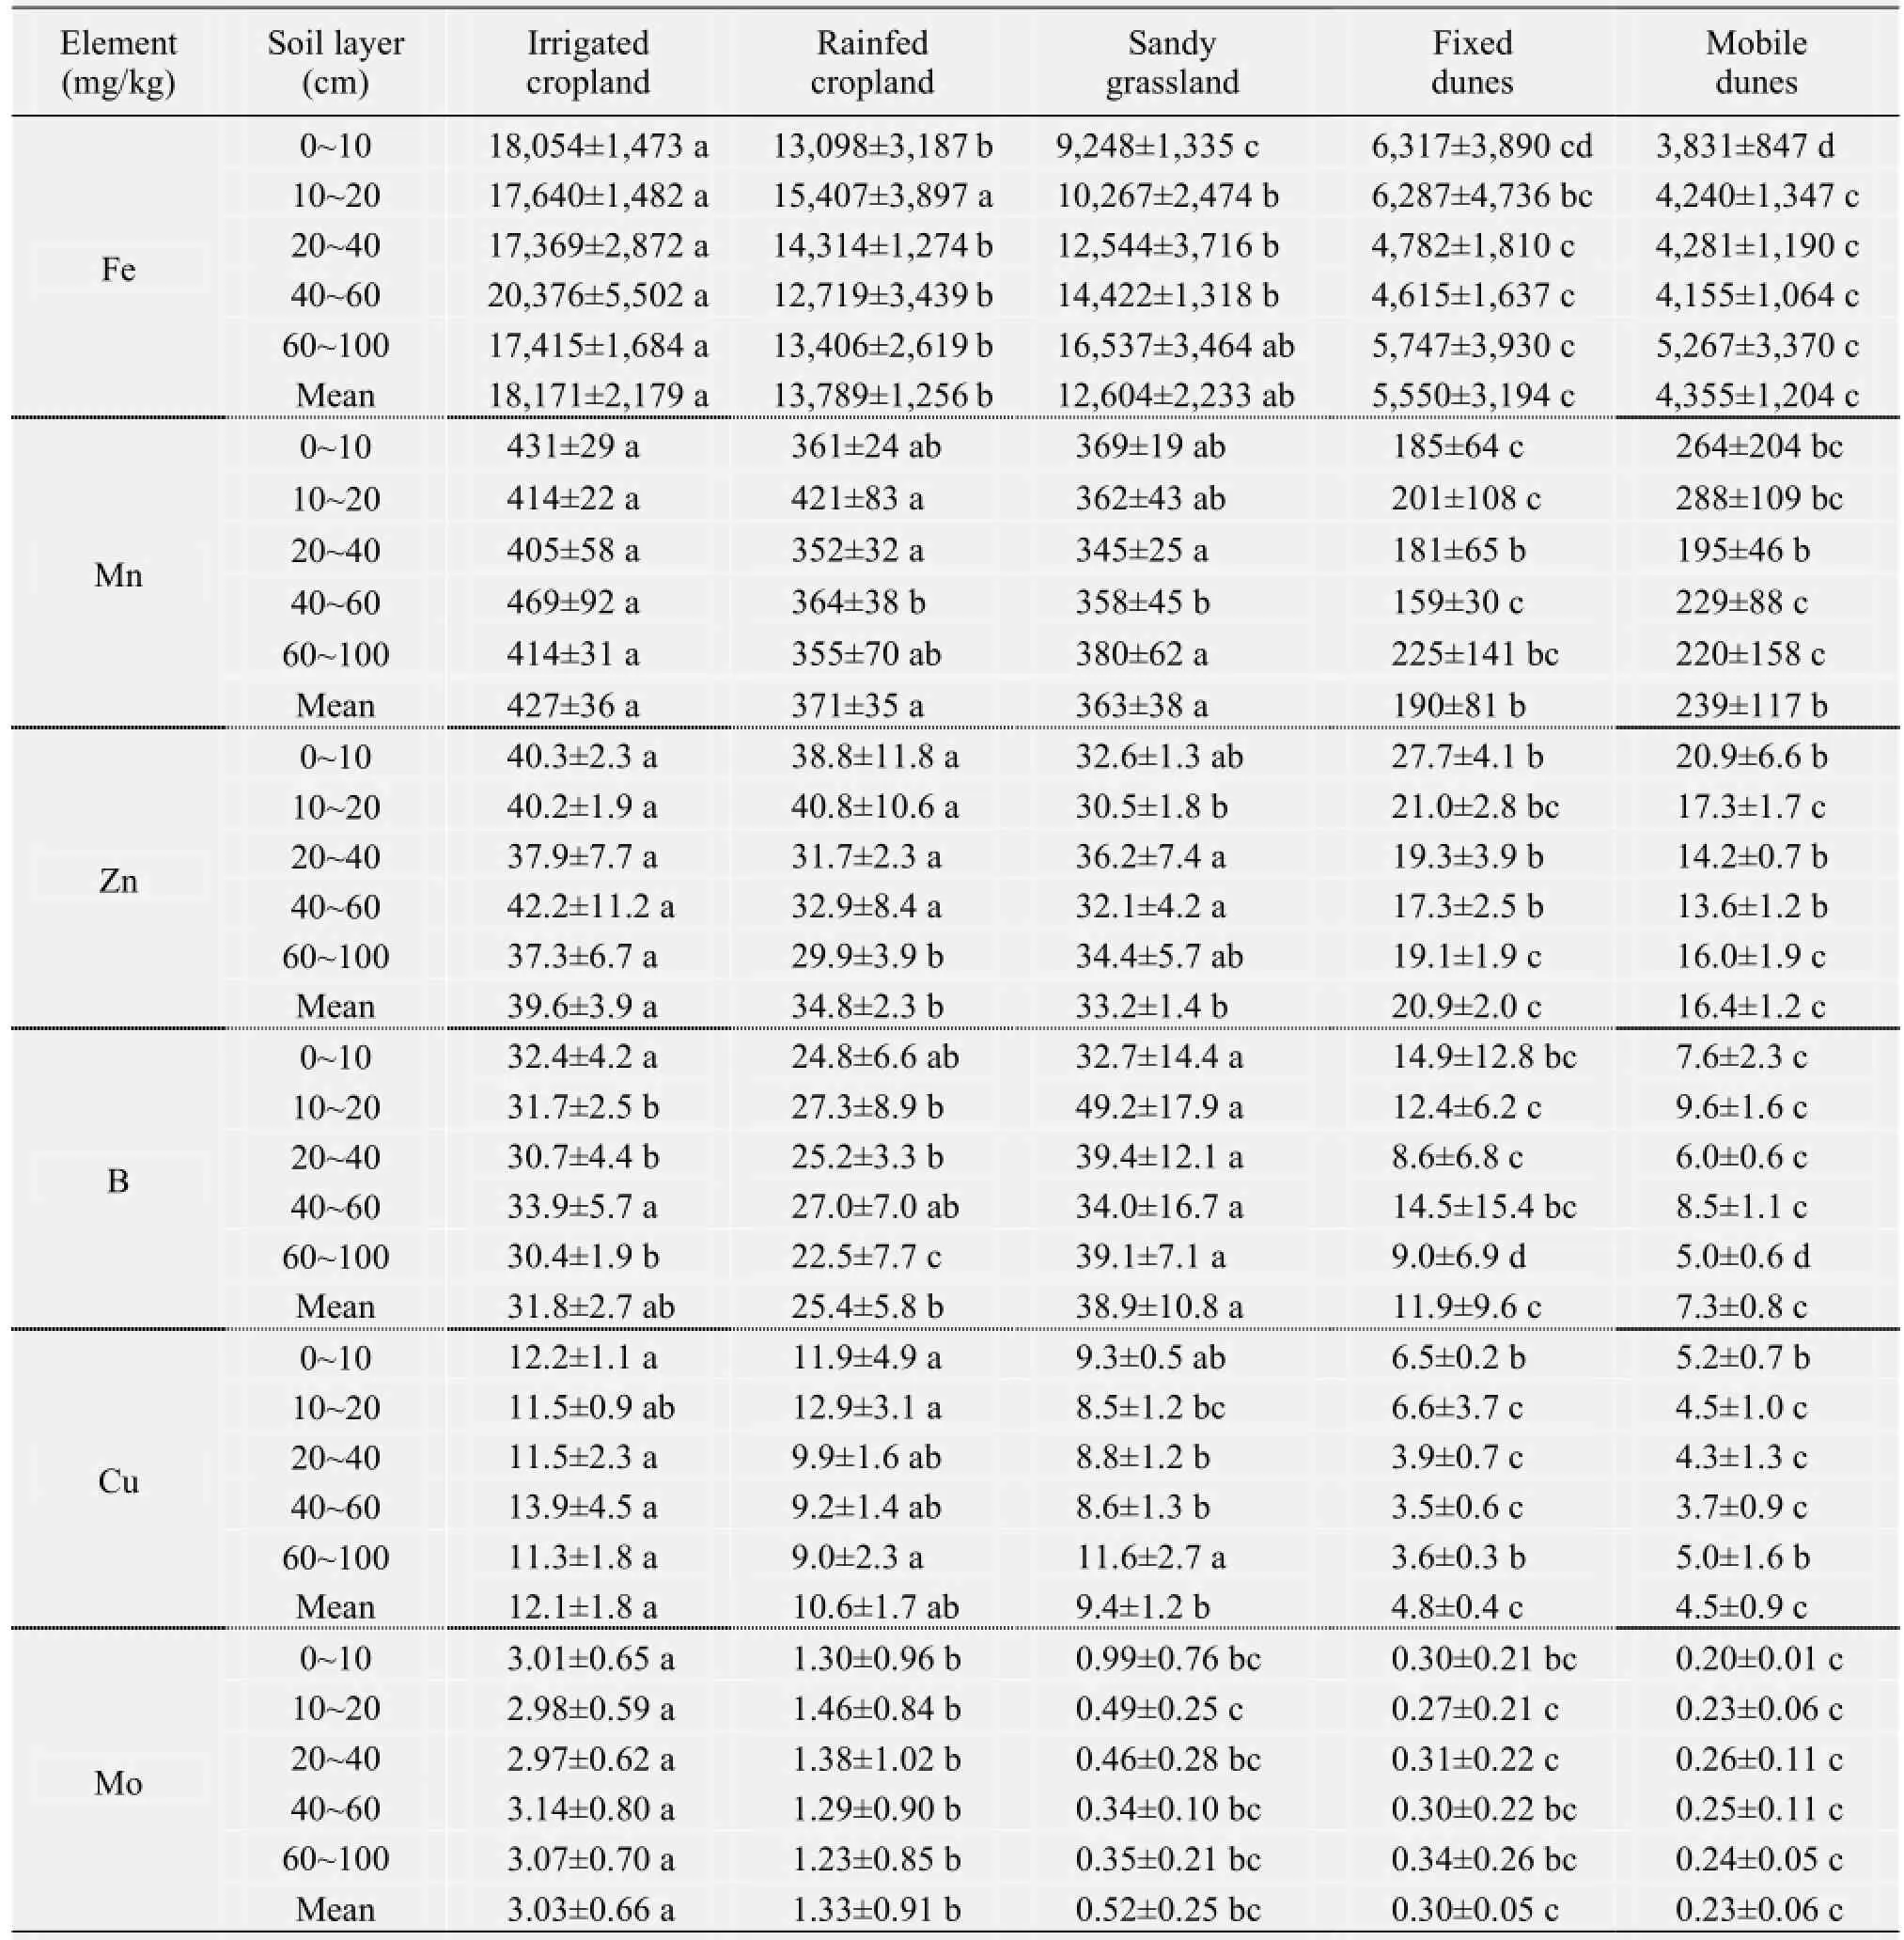
Table 4 Soil microelement contents to a depth of 100 cm in the five land-use and cover types
3.6Available microelements
Statistical analyses of the observation data to a depth of 20 cm indicated that the available microelements,apart from available Mo,differed significantly among the land-use and cover types (Figure 5).Their contents were generally significantly greater in the two cropland types and sandy grassland than in the two dune types,though available S was lower in rainfed cropland than in all the other types and available Fe was not significantly higher in sandy grassland than in the two dune types.Across the five sites,available Mn had the highest content and available Mo had the lowest content.Across all sites,the highest values of all available microelements except Mo occurred in irrigated cropland.The lowest values occurred in mobile dunes for available Cu,Zn,and Mn,versus in rainfed cropland for S,in fixed dunes for available Fe,and in both types of cropland for available Mo.
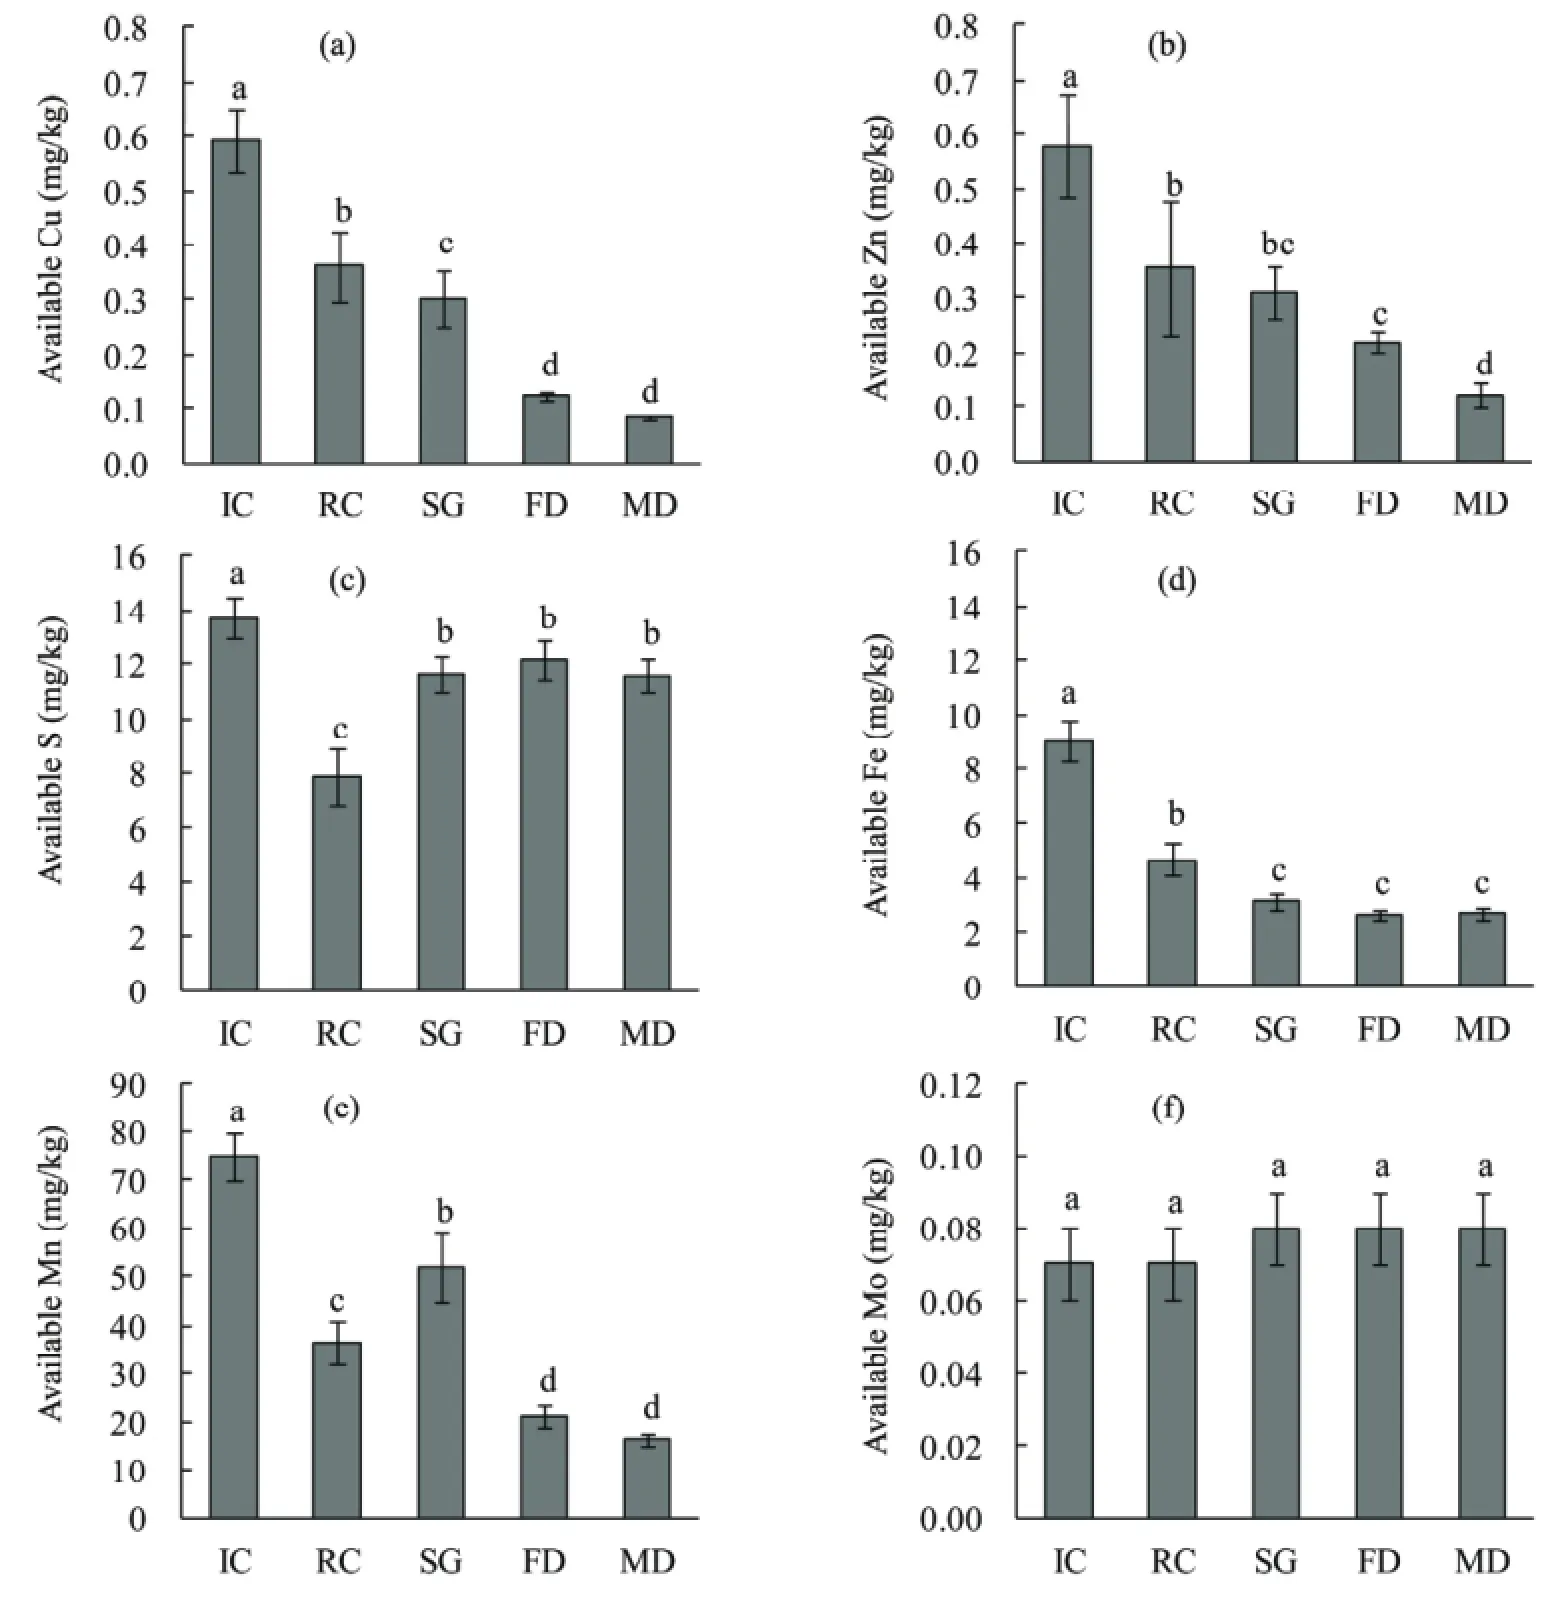
Figure 5 The contents of the available microelements to a depth of 20 cm.(a) available Cu,(b) available Zn,(c) available S,(d) available Fe,(e) available Mn,and (f) available Mo.Note that the y-axis scale differs greatly between graphs.Values are for irrigated cropland (IC),rainfed cropland (RC),sandy grassland (SG),fixed dunes (FD),and mobile dunes (MD).Values represent means ± SD.For a given microelement,bars labeled with different letters differed significantly (P <0.05) between land-use and cover types
4 Discussion
Our study indicates that the soil physico-chemical properties were closely related to the land-use and cover types.SOC derives from soil organic matter (SOM),which contains about 58% SOC (Stockmann et al.,2013).SOM exerts numerous positive effects on soil physical and chemical properties,as well as on the soil's capacity to provide regulatory ecosystem services (Brady and Weil,1999).As such,higher levels of SOC generally indicate better soil fertility and better soil quality.On this basis,the soil quality in thepresent study declined in the following order:irrigated cropland > sandy grassland > rainfed cropland >fixed dunes > mobile dunes.In previous research,the conversion of natural land into cropland led to a depletion of SOC,and the depletion was exacerbated by soil degradation,land misuse,and soil mismanagement; in contrast,changing land use from cropland to pasture or to permanent forest often resulted in a large increase in SOC storage (Reeder et al.,1998; Guo and Gifford,2002; Lal,2004; Poeplau and Don,2013).However,conversion to cropland can instead increase the SOC pool,particularly in degraded land,as a result of management practices such as conservation tillage,planting of cover crops,manuring,integrated nutrient management,crop rotation,planting of multiple crops in the same field,and agroforestry (Lal,2004).
In the present study,the irrigated cropland had been intensively cultivated for long periods.We lack information on the SOC level of the original grassland before the irrigated cropland was established,so we cannot evaluate the changes in SOC due to this land-use change.However,local records for the study area (Liu et al.,1996) suggest that the SOC content to a depth of 100 cm in non-degraded natural grassland ranged from 6.26 to 11.50 g/kg,with a mean value of 8.52 g/kg.In our study,the mean SOC content in irrigated cropland is 4.51 g C/kg for the top 100 cm of the soil.This suggests that cultivation of the original lush grassland resulted in a large loss of SOC.Guo and Gifford (2002) found that SOC decreased rapidly during the initial stage of land-use change from natural to agricultural ecosystems,and then changed slowly thereafter.A long-term (1930 to 2010) study of SOC dynamics after land-use change in Indonesia (Minasny et al.,2011) showed that total SOC declined greatly (by 60%) between 1930 and 1970 as a result of conversion of primary forest to plantations and cultivated land,but that SOC content had increased since 1970,reaching 55% of the initial level by 2000.This change from decreasing to increasing SOC most likely resulted from agricultural practices designed to increase plant production through fertilizer application and soil management.
Irrigated cropland is the major land-use type in our study area.Local farmers apply composted livestock manure and till crop stubble into the soil in the Horqin Sandy Land.Therefore,we hypothesize that SOC must have declined at the beginning of the land-use conversion from grassland to cropland,and then stabilized after a certain period.The SOC storage is unlikely to change greatly in the future if the current cultivation practices do not change dramatically.However,further site-specific SOC investigations should be conducted over a long term to test this hypothesis at the study sites.
In recent years,the soils of arid and semiarid regions,which are characterized by low SOC content,have been regarded as having the highest potential to sequester C because of their vast area combined with their widespread degradation (Nosetto et al.,2006).Enhancing C sequestration in degraded drylands could have direct environmental,economic,and social benefits for local people (FAO,2004).Yu et al.(2005) estimated that the SOC storage in the top 100 cm of the soil in China ranged from 0.143 to 446.25 kg/m2,with an average value of 9.60 kg/m2.In the present study,the SOC storage ranged from 0.463 kg/m2in mobile dunes to 5.70 kg/m2in irrigated cropland,which is well below the national average.However,in the semiarid Horqin Sandy Land,the major factors that are driving desertification are inappropriate activities,such as overgrazing and excessive cultivation,firewood harvesting,and groundwater withdrawal.The desertified lands in our study area could potentially recover and increase their SOC storage if the pressure induced by these inappropriate human activities were relieved.
Our previous studies confirmed that grazing exclosure and afforestation using Mongolian pine (Pinus sylvestris var.mongolica) in areas with mobile dunes have a high potential to sequester C in the plant-soil system (Li et al.,2012,2013).Among our current study sites,the fixed dunes,which resulted from restoration of the vegetation cover to stabilize mobile dunes,showed a higher SOC storage than the mobile dunes.Similarly,the rainfed cropland,which was established from desertified land with different kinds of sand dunes,showed higher SOC storage than the fixed or mobile dunes.These results further support our belief that the severely desertified land can increase its SOC accumulation by the adoption of improved management and cultivation practices.
In general,agricultural activity such as rainfed cropland with low management inputs might lead to the degradation of soil quality and semiarid ecosystem (Zhao et al.,2003).On the other hand,irrigated agriculture in arid and semiarid regions with more elaborate forms of cultivation,such as the use of no-tillage agriculture and application of more fertilizer and manure,can increase SOM content when more crop residues are returned to field.However,the sustainability of irrigated agriculture in many arid and semiarid areas of the world is at risk because of a combination of several interrelated factors,including lack of fresh water,lack of drainage,the presence of high water tables,and salinization of soil and groundwater resources (Schoups et al.,2005).These issues should be attached great importance in future research.
Soil has complex physical,chemical,and biological properties,and there are many relationships and interactions among these properties (Zhao et al.,2006).The SOC content is a particularly important soilquality attribute because of its effects on these relationships and because there is a significantly positive correlation between SOC content and soil fertility (Laik et al.,2009).In the present study,SOC was significantly positively correlated with a large proportion of the other soil physico-chemical parameters (0.882 < r < 0.996,P <0.05),including total N,CEC,available N,total mineral elements (Al2O3,Na2O,CaO,MgO,TiO2,P2O5,and MnO),microelements (Mn and Zn),available microelements (available Cu,Zn,Fe,and Mn),and the very fine sand and silt+clay contents.This suggests that increasing SOC storage is likely to support efforts to rehabilitate the soil quality in the degraded lands of our study area.
Acknowledgments:
This research was supported by the National Natural Science Foundation of China (Grant Nos.41271007,31260089,and 31560161) and the One Hundred Person Project of the Chinese Academy of Sciences (Y551821002).
References:
Brady NC,Weil RR,1999.The Nature and Properties of Soils.12th Edition.New Jersey:Prentice Hall.
Brovkin V,Boysen L,Arora VK,et al.,2013.Effect of anthropogenic land-use and land-cover changes on climate and land carbon storage in CMIP5 projections for the twenty-first century.Journal of Climate,26:6859-6881.DOI:10.1175/JCLI-D-12-00623.1.
Brovkin V,Sitch S,Von Bloh W,et al.,2004.Role of land cover changes for atmospheric CO2increase and climate change during the last 150 years.Global Change Biology,10:1253-1266.DOI:10.1111/j.1365-2486.2004.00812.x.
Chen FS,Zeng DH,Zhou B,et al.,2006.Seasonal variation in soil nitrogen availability under Mongolian pine plantations at the Keerqin Sand Lands,China.Journal of Arid Environment,67:226-239.DOI:10.1016/j.jaridenv.2006.02.017.
FAO (Food and Agriculture Organization of the United Nations),2004.Carbon sequestration in drylands.In:World Soil Resources Report 102.FAO,Rome,Italy.
FAO (Food and Agriculture Organization of the United Nations),2006.FAO/IUSS Working Group WRB,World reference base for soil resources 2006.In:World Soil Resources Reports 103.FAO,Rome,Italy.
Guo LB,Gifford RM,2002.Soil carbon stocks and land use change.Global Change Biology,8:345-360.DOI:10.1046/j.1354-1013.2002.00486.x.
Hesse PR,1972.A Textbook of Soil Chemical Analysis.New York:Chemical Publishing Co.Inc..
IPCC (Intergovernmental Panel on Climate Change),2007.Climate Change 2007:Synthesis Report.In:Pachauri RK,Reisinger A (eds.).Contribution of Working Groups I,II and III to the Fourth Assessment Report of the Intergovernmental Panel on Climate Change.IPCC,Geneva,Switzerland.
IPCC (Intergovernmental Panel on Climate Change),2013.Climate Change 2013:The Physical Science Basis.In:Stocker TF,Qin D,Plattner GK,et al.(eds.).Contribution of Working Group I to the Fifth Assessment Report of the Intergovernmental Panel on Climate Change.Cambridge University Press,Cambridge,United Kingdom and New York,NY,USA.
ISSCAS (Institute of Soil Sciences,Chinese Academy of Sciences),1978.Physical and Chemical Analysis Methods of Soils.Shanghai:Shanghai Science Technology Press.(in Chinese)
Laik R,Kumar K,Das DK,et al.,2009.Labile soil organic matter pools in a calciorthent after 18 years of afforestation by different plantations.Applied Soil Ecology,42:71-78.DOI:10.1016/j.apsoil.2009.02.004.
Lal R,2004.Soil carbon sequestration impacts on global climate change and food security.Science,304:1623-1627.DOI:10.1126/science.1097396.
Lal R,2010.Managing soils and ecosystems for mitigating anthropogenic carbon emissions and advancing global food security.Bioscience,60:708-721.DOI:10.1525/bio.2010.60.9.8.
Li YQ,Brandle J,Awada T,et al.,2013.Accumulation of carbon and nitrogen in the plant-soil system after afforestation of active sand dunes in China's Horqin Sandy Land.Agriculture,Ecosystem & Environment,177:75-84.DOI:10.1016/j.agee.2013.06.007.
Li YQ,Zhao XY,Wang SK,et al.,2015.Carbon accumulation in the bulk soil and different soil fractions during the rehabilitation of desertified grassland in Horqin Sandy Land,northern China.Polish Journal of Ecology,63:88-101.DOI:10.3161/15052249PJE2015.63.1.008.
Li YQ,Zhou XH,Brandle JR,et al.,2012.Temporal progress in improving carbon and nitrogen storage by grazing exclosure practice in a degraded land area of China's Horqin Sandy Grassland.Agriculture,Ecosystem & Environment,159:55-61.DOI:10.1016/j.agee.2012.06.024.
Liu XM,Zhao HL,Zhao AF,1996.Characteristics of Sandy Environment and Vegetation in the Horqin Sandy Land.Beijing:Science Press.(in Chinese)
McGill WB,Figueiredo CT,1993.Total nitrogen.In:Carter MR (ed.).Soil Sampling and Methods of Analysis.Boca Raton,FL:Canadian Society of Soil Science/Lewis Publishers.
Minasny B,Sulaeman Y,McBratney AB,2011.Is soil carbon disappearing? The dynamics of soil organic carbon in Java.Global Change Biology,17:1917-1924.DOI:10.1111/j.1365-2486.2010.02324.x.
Nelson DW,Sommers LE,1982.Total carbon,organic carbon and organic matter.In:Page AL,Miller RH,Keeney DR (eds.).Methods of soil Analysis.American Society of Agronomy,Madison,WI,pp.539-577.
Nosetto MD,Jobbágy EG,Paruelo JM,2006.Carbon sequestration in semiarid rangelands:comparison of Pinus ponderosa plantations and grazing exclusion in NW Patagonia.Journal of Arid Environment,67:142-156.DOI:10.1016/j.jaridenv.2005.12.008.
O'Sullivan L,Creamer RE,Fealy R,et al.,2015.Functional land management for managing soil functions:a case-study of the trade-off between primary productivity and carbon storage in response to the intervention of drainage systems in Ireland.Land Use Policy,42:426-431.DOI:10.1016/j.landusepol.2015.03.007.
Olsen SR,Cole CW,Watanabe FS et al.,1954.Estimation of available phosphorus in soils by extraction with sodium bi-carbonate.Circular,United States Department of Agriculture,No.939.
Ostle NJ,Levy PE,Evans CD,et al.,2009.UK land use and soil carbon sequestration.Land Use Policy,26S:S274-S283.DOI:10.1016/j.landusepol.2009.08.006.
Poeplau C,Don A,2013.Sensitivity of soil organic carbon stocks and fractions to different land-use changes across Europe.Geoderma,192:189-201.DOI:10.1016/j.geoderma.2012.08.003.
Reeder JD,Schuman GE,Bowman RA,1998.Soil C and N changes on conservation reserve program lands in central Great Plains.Soil Tillage & Research,47:339-349.DOI:10.1016/S0167-1987(98)00122-6.
Schoups G,Hopmans JW,Young CA,et al.,2005.Sustainability of irrigated agriculture in the San Joaquin Valley,California.Proceedings of the National Academy of Sciences of the United States of America,102:15352-15356.DOI:10.1073/pnas.0507723102.
Schulte RPO,Creamer RE,Donnellan T,et al.,2014.Functional land management:a framework for managing soil-based ecosystem services for the sustainable intensification of agriculture.Environmental Science & Policy,38:45-58.DOI:10.1016/j.envsci.2013.10.002.
Stockmann U,Adams MA,Crawford JW,et al.,2013.The knowns,known unknowns and unknowns of sequestration of soil organic carbon.Agriculture,Ecosystem & Environment,164:80-99.DOI:10.1016/j.agee.2012.10.001.
Su YZ,Zhao HL,2003.Soil properties and plant species in an age sequence of Caragana microphylla plantations in the Horqin Sandy Land,North China.Ecological Engineering,20:223-235.DOI:10.1016/S0925-8574(03)00042-9.
Yu DS,Shi XZ,Sun WX,et al.,2005.Estimation of China soil organic carbon storage and density based on 1:1000000 soil database.Chinese Journal of Applied Ecology,16:2279-2283.(in Chinese)
Zhao HL,He YH,Zhou RL,et al.,2009.Effects of desertification on soil organic C and N content in sandy farmland and grassland of Inner Mongolia.Catena,77:187-191.DOI:10.1016/j.catena.2008.12.007.
Zhao HL,Yi XY,Zhou RL,et al.,2006.Wind erosion and sand accumulation effects on soil properties in Horqin sandy farmland,Inner Mongolia.Catena,65:71-79.DOI:10.1016/j.catena.2005.10.001.
Zhao HL,Zhao XY,Zhang TH,et al.,2003.Desertification Processes and Its Restoration Mechanisms in the Horqin Sand Land.Beijing:Ocean Press.(in Chinese)
Zhou RL,Li YQ,Zhao HL,et al.,2008.Desertification effects on C and N content of sandy soils under grassland in Horqin,northern China.Geoderma,145:370-375.DOI:10.1016/j.geoderma.2008.04.003.
Li YQ,Zhang JP,Zhao XY,et al.,2016.Comparison of soil physico-chemical properties under different land-use and cover types in northeastern China's Horqin Sandy Land.Sciences in Cold and Arid Regions,8(6):0495-0506.
10.3724/SP.J.1226.2016.00495.
*Correspondence to:Ph.D.,YuQiang Li,Northwest Institute of Eco-Environment and Resources,Chinese Academy of Sciences.No.320,West Donggang Road,Lanzhou,Gansu 730000,China.E-mail:liyq@lzb.ac.cn
April 28,2016Accepted:June 20,2016
杂志排行
Sciences in Cold and Arid Regions的其它文章
- Interdecadal correlation of solar activity with Tibetan Plateau snow depth and winter atmospheric circulation in East Asia
- Relationship between sand-dust weather and water dynamics of desert areas in the middle reaches of Heihe River
- Quantitative retrieval of soil salt content based on measured spectral data
- Comparison analysis of sampling methods to estimate regionalprecipitation based on the Kriging interpolation methods:A case of northwestern China
- Revisit of event-based rainfall characteristics at Shapotou area in northern China
- Discussion on applying an analytical method to optimize the anti-freeze design parameters for underground water pipelines in seasonally frozen areas
