Simulation of the Interface between the Indian Summer Monsoon and the East Asian Summer Monsoon:Intercomparison between MPI-ESM and ECHAM5/MPI-OM
2016-11-25DepartmentofAtmosphericSciencesYunnanUniversityKunming65009
Department of Atmospheric Sciences,Yunnan University,Kunming 65009
2Yunnan Key Laboratory of International Rivers and Transboundary Eco-security,Kunming 650091
Simulation of the Interface between the Indian Summer Monsoon and the East Asian Summer Monsoon:Intercomparison between MPI-ESM and ECHAM5/MPI-OM
Yiran GUO1,Jie CAO∗1,2,Hui LI1,Jian WANG1,and Yuchao DING1
1Department of Atmospheric Sciences,Yunnan University,Kunming 650091
2Yunnan Key Laboratory of International Rivers and Transboundary Eco-security,Kunming 650091
The time-mean and interannual variability of the interface between the Indian summer monsoon and East Asian summer monsoon(IIE)was assessed using both Max-Planck-Institute Earth System Model(MPI-ESM)and ECHAM5/MPI-OM and by calculating diagnostics and skill metrics around the IIE area.Progress has been made in modeling these aspects by moving from ECHAM5/MPI-OM to MPI-ESM.MPI-ESM is more skillful than ECHAM5/MPI-OM in modeling the time-mean state and the extreme condition of the IIE.Though simulation of the interannual variability significantly deviates to some extent in both MPI-ESM and ECHAM5/MPI-OM,MPI-ESM-LR shows better skill in reflecting the relationship among sea surface temperature anomalies over the Pacific,circulation anomalies over East Asia,and IIE variability.The temperature becomes warmer under the RCP2.6 and RCP8.5 scenarios in comparison with the historical experiments,but the position of the IIE and the key physical process in relation to the IIE variability almost remains the same,suggesting that the Indian summer monsoon tends to change in phase with the East Asian summer monsoon under each RCP scenario.The relatively realistic description of the physical processes modulated by terrain in MPI-ESM may be one of the most important reasons why MPI-ESM performs better in simulating the IIE.
Asian summer monsoon,IIE,MPI-ESM,ECHAM5/MPI-OM,intercomparison
1.Introduction
The Asian monsoon influences more than 60%of the world’s population,through controlling droughts and floods, and plays a key role in the Earth’s climate system(Flohn, 1957;Ding,1994;Webster et al.,1998;Huang et al.,2012; Wu et al.,2012).Since the Asian monsoon varies greatly on multiple temporal and spatial scales,the performance of simulating the activity of the Asian monsoon has become one of the most important indicators to assess the quality of a numerical model.ECHAM5,released in 2003,has been extensively used in studying the variation of the Asian summer monsoon because of its high simulation efficiency(Roeckner etal.,2003,2006;Marslandetal.,2003).Forexample,Annamalaietal.(2007)studied the relationship between the Indian summer monsoon and ENSO with ECHAM5/MPI-OM.Li and Zhang(2009)found that ECHAM5/MPI-OM simulates the wind onset of the Asian summer monsoon reasonablywell.Lu and Fu(2010)compared 12 CMIP3 models including ECHAM5/MPI-OM.They found that these models can successfully reproduce the essential features of the present-day interannual variability in rainfall-related circulations.Xie et al.(2009)introduced the Indian Ocean capacitor effect on the Indo–western Pacific climate using ECHAM5. Zhou et al.(2009)tested the ability of ECHAM5 and 10 other GCMs in capturing the leading modes of the interannual variability of the Asian–Australian monsoon.Zhao and Fu(2010)found ECHAM5/MPI-OM can reproduce the general distributions of precipitation,specific humidity and wind vectors for the years 1978–2000.Huang et al.(2014)pointed out that a new global climate model integrating ECHAM5 with Nucleus for European Modelling of the Ocean(NEMO) can successfully capture the distribution of SST,precipitation,the seasonal cycle of equatorial Pacific SST and precipitation,and the circulation of the East Asian summer monsoon.The main interannual variations of the tropical Pacific SST,the East Asian and western North Pacific climate,and the East Asia–Pacific Pattern and El Ni˜no,are reproduced well.In 2012,MPI-ESM,whose atmospheric component isECHAM6,was released by the Max Planck Institute for Meteorology in Germany(Giorgetta et al.,2013).The land surface model(JSBACH)was extended by dynamic vegetation, for climate-consistent development of the geographic distribution of vegetation(Brovkin et al.,2009;Reick et al.,2013). The surface albedo scheme was improved to use a weighted average of the ice albedo and the water albedo,depending on solar zenith angle(Roeckner et al.,2012).The representation of shortwave radiative transfer,the height of the model top, model tuning and convective triggering have also changed in ECHAM6(Hagemann et al.,2013;Stevens et al.,2013). These changes lead ECHAM6 to provide a better representation than ECHAM5 of the mean climate(Stevens et al., 2013).For the ocean model,some improvements have been made in MPI-ESM-MR,including increased vertical resolution,while in MPI-ESM-LR it remains the same resolution as ECHAM5/MPI-OM(Jungclaus et al.,2013).
©Institute of Atmospheric Physics/Chinese Academy of Sciences,and Science Press and Springer-Verlag Berlin Heidelberg 2016
It is widely accepted that the Asian summer monsoon has two subsystems:the Indian summer monsoon system(Krishnamurti and Bhalme,1976)and the East Asian summer monsoon system(Tao and Chen,1987).There is an interface between the Indian and East Asian summer monsoons,referred to as the IIE(Jin and Chen,1982;Lau and Li,1984;Zhu et al.,1986;Tao and Chen,1987;Ding,1994;Wang and LinHo, 2002).Cao et al.(2012)found that the IIE is approximately locatedalong(18◦N,102.98◦E)at900hPa,(20◦N,101.68◦E) at850hPa,(22◦N,100.88◦E)at800hPa,(24◦N,100.96◦E)at 750 hPa,(26◦N,101.08◦E)at 650 hPa,and(28◦N,99.32◦E) at 600 hPa,and its variability can be quantified by the IIE index.As the IIE is a variable that describes the interaction between the East Asian summer monsoon and Indian summer monsoon,simulation of IIE variation may be crucial in understanding the impact of the two monsoon subsystems on local weather and climate.If the temporal and spatial evolution of the IIE can be better reproduced in GCMs, the skill of numerical models in simulating the Asian summer monsoon may also be improved.However,the performance of both ECHAM5/MPI-OM and MPI-ESM in simulating the IIE is not yet clear.The aim of this study,therefore,was to establish whether MPI-ESM can provide a better representation in modeling the IIE,and,if this is the case, then also determine the kinds of improvements that can be achieved.
The remainder of this paper is organized as follows:The model and observation data are described in section 2.In section 3,the abilities of ECHAM5/MPI-OM,MPI-ESM-LR and MPI-ESM-MR to reproduce the mean state of the atmospheric reanalysis data of the equivalent potential temperature around the IIE are analyzed.Section 4 investigates the capabilities of the three numerical models to represent the mean state and extreme condition of the IIE.The relationship between SST,circulation and middle–upper troposphere anomalies with IIE interannual variation is also discussed. The future changes of the IIE under the RCP2.6 and 8.5 scenarios are explored in section 5.A summary and discussion are provided in section 6.
2.Model and data
Three models—ECHAM5/MPI-OM,MPI-ESM-LR and MPI-ESM-MR—were employed in this study.In MPI-ESMLR,the GCM,ECHAM6,is run at T63 horizontal resolution(approximately 1.875◦on a Gaussian grid)with 47 hybrid sigma-pressure levels,and the ocean circulation model, MPI-OM,is run at a 1.5◦horizontal resolution(near the equator)and 40 z-levels in a bipolar grid.In MPI-ESMMR,ECHAM6 is run with 95 hybrid sigma-pressure levels with the same horizontal resolution as MPI-ESM-LR, and MPI-OM is run at 0.4◦horizontal resolution with the same vertical levels as MPI-ESM-LR.The top of the GCM reaches 0.01 hPa in both MPI-ESM-LR and MPI-ESM-MR. ECHAM5/MPI-OM has the same horizontal resolution as MPI-ESM-LR,except the 31 vertical levels of the GCM extend only to 10 hPa in ECHAM5.Further details of the three models can be found in Stevens et al.(2013),Jungclaus et al. (2013),Reicketal.(2013)andIlyinaetal.(2013).Themodel data were downloaded from http://www-pcmdi.llnl.gov/and https://esg.llnl.gov:8443/.
The 20th century reanalysis data(version 2)were provided by NOAA/OAR/ESRL Physical Sciences Division for the summers(June–July–August;JJA)(Whitaker et al.,2004; Compo et al.,2006,2011).The resolution of the reanalysis data is 2◦×2◦and there are 16 pressure levels from 1000 to 200 hPa.The SST data were from ERSST.v3b(Smith et al.,2008).The resolution of the SST data is 2◦×2◦on a latitude–longitude grid.The study area was selected as (16◦–30◦N,90◦–110◦E).The historical run spanned a total of 27 years from 1979 to 2005,and the future scenario runs spanned from 2006 to 2100.The IIE data were provided by Cao et al.(2012).
3.Comparisons of the longitude-pressure section of equivalent potential temperature between observational data and modeling data around the IIE area
Figure 1a shows that the observational summer equivalentpotentialtemperaturealong21.45◦Nhasatypicalsaddleshaped pattern.The equivalent potential temperature at the same isobaric level has a low–high–low pattern with an increase in longitude.The equivalent potential temperature at the same longitude features a high–low–high pattern as air pressure decreases.Two high centers with values above 351 K occur at the lower and mid–high levels of the troposphere, respectively.The saddle-shaped pattern of equivalent potential temperature is reproduced well in the three models but with different levels of superiority.For the positions of the two low centers around the mid-troposphere,the modeling results of both MPI-ESM-MR and MPI-ESM-LR are more accurate than those of ECHAM5/MPI-OM(Figs.1b and 1c). However,for the intensity of equivalent potential temperature,the modeling result of ECHAM5/MPI-OM is closer to observations.The negative deviations appear at the mid–highlevels of the troposphere in the three models,and are most conspicuous in MPI-ESM-MR,with center values below-6 K.The positive deviations mainly appear at the lower levels of the troposphere around 95◦E and 110◦E in the three models,and are most obvious in ECHAM5/MPI-OM.The sections of JJA equivalent potential temperature along five other latitudes—17.72◦N,19.59◦N,23.32◦N,25.18◦N and 27.05◦N(figures omitted)—share a similar pattern as Fig.1.
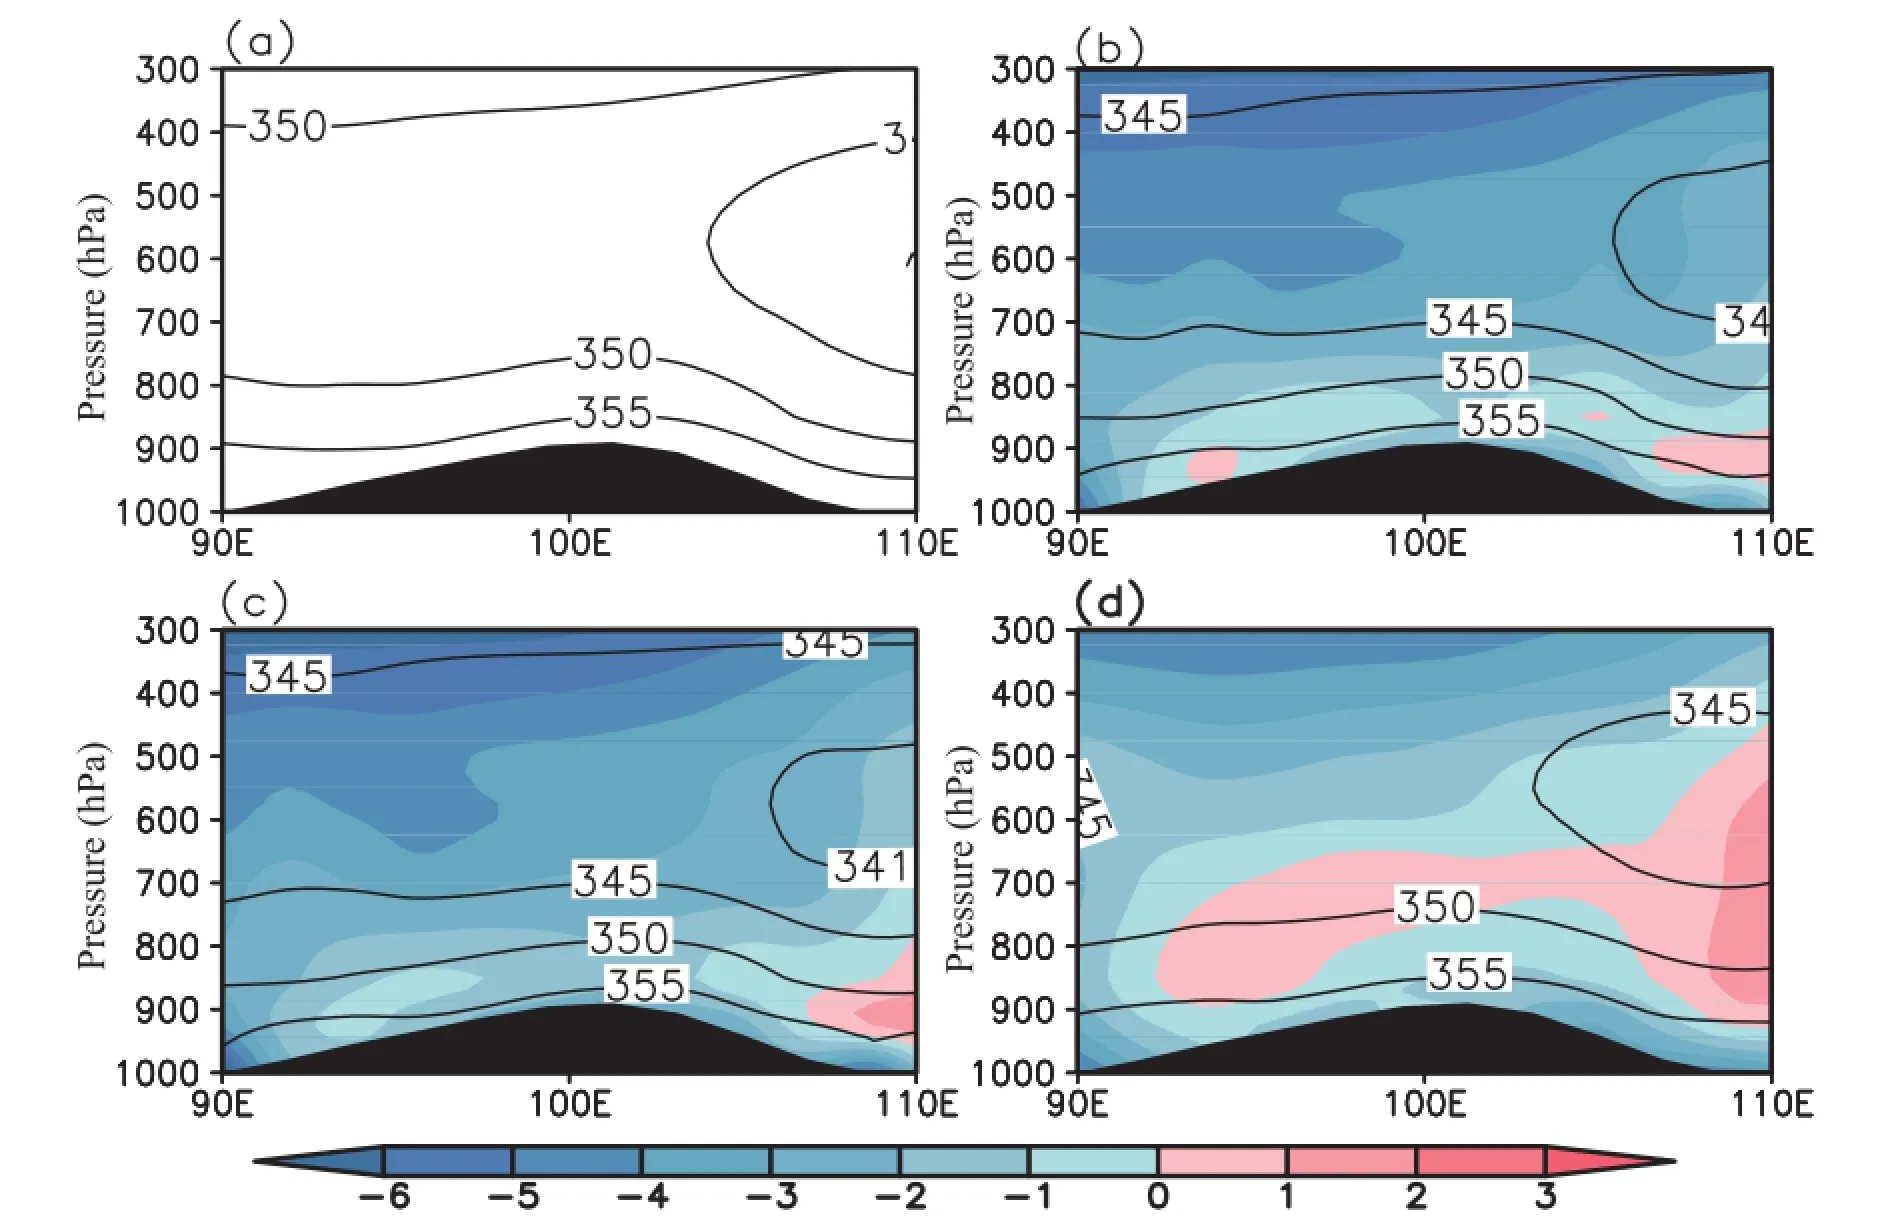
Fig.1.Section of JJA equivalent potential temperature along a Gaussian grid(21.45◦N)averaged between 1979 and 2005 from(a)20th century reanalysis data(version 2),(b)MPI-ESM-MR,(c)MPI-ESM-LR,and(d)ECHAM5/MPIOM.Shaded areas denote the difference between modeling results and observations.Units:K.
A Taylor diagram(Taylor,2001),which quantitatively demonstrates the modeling skill of the three models,is shown inFig.2.Comparingthecorrelationcoefficients,standarddeviation and root-mean-square deviation of the three models, it can be seen that the modeling skill of MPI-ESM-MR,MPIESM-LR and ECHAM5/MPI-OM are similar at 19.59◦N, 21.45◦N and 23.32◦N,but MPI-ESM-MR and MPI-ESM-LR possess greater skill than ECHAM5/MPI-OM at 25.18◦N and 27.05◦N.
4.Comparisons of the IIE state between observations and simulations
4.1.Position of the IIE
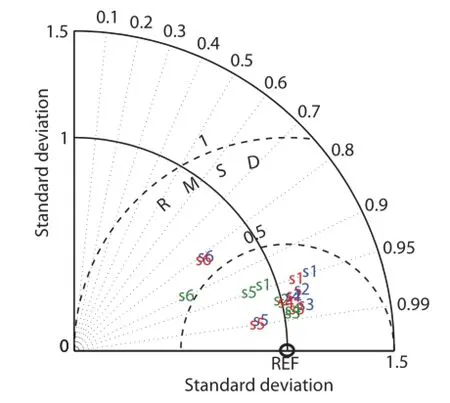
Fig.2.Taylor diagram illustrating a statistical comparison with observations of six equivalent geopotential temperature sections around the IIE area.The labels s1–s6 denote the sections of equivalent geopotential temperature along six Gaussian grids: 17.72◦N,19.58◦N,21.45◦N,23.35◦N,25.18◦N and 27.05◦N. Blue coloring denotes MPI-ESM-MR,red denotes MPI-ESMLR,and green denotes ECHAM5/MPI-OM.The black circle denotes the observations.
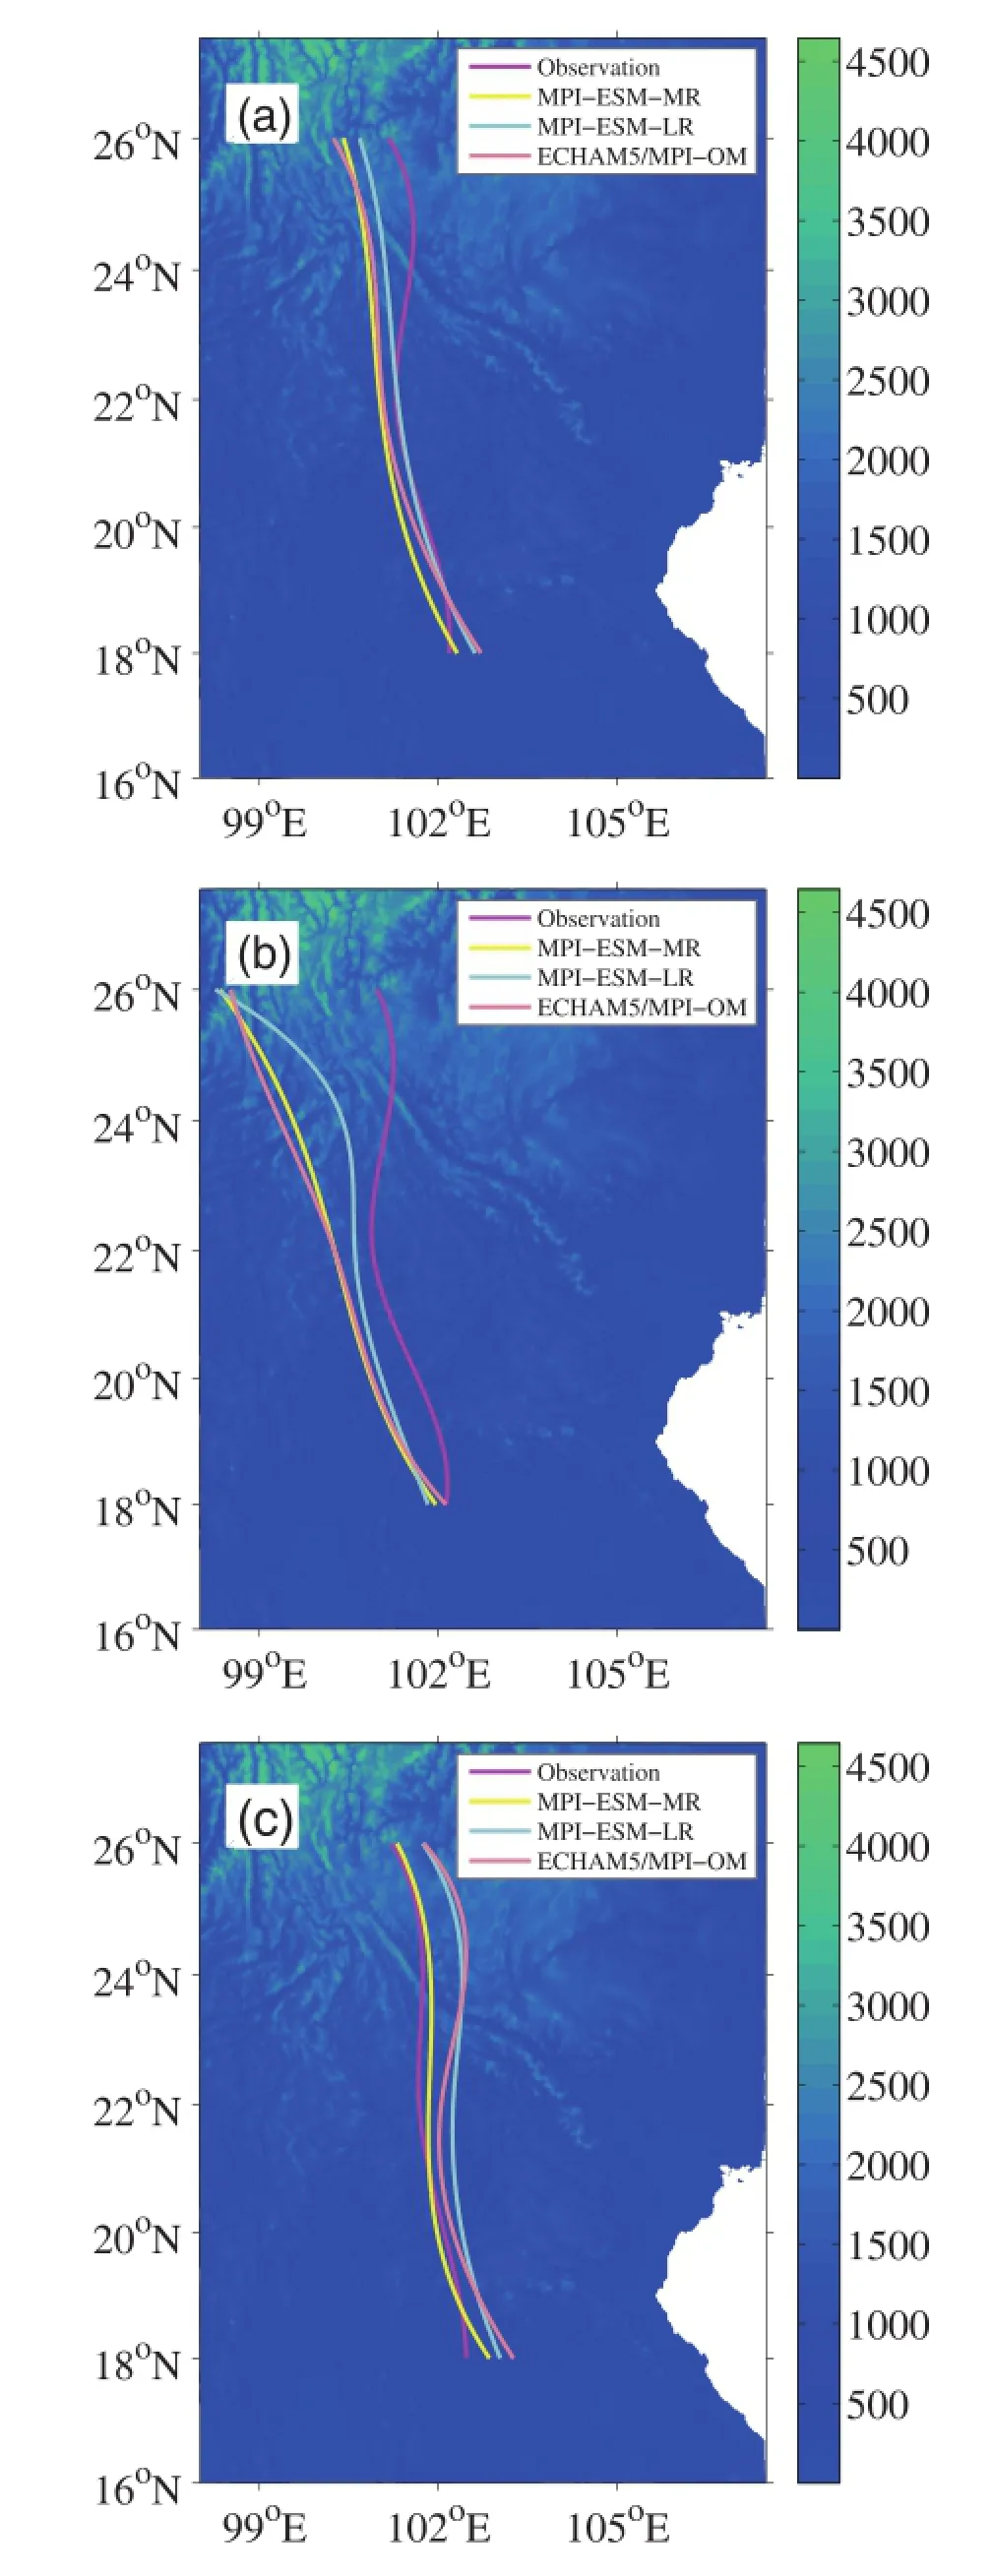
Fig.3.Positions of the IIE:(a)normal;(b)more westward;(c) more eastward.Magenta denotes the observation,yellow denotes MPI-ESM-MR,cyan denotes MPI-ESM-LR,and orange denotes ECHAM5/MPI-OM.Shaded areas denote the terrain (units:m).
According to the definition of the IIE developed by Cao et al.(2012)(the surface where the change of the equivalent potential temperature,θE,with respect to the longitude,λ, is zero,i.e.,∂θE/∂λ=0),we obtained the modeled IIE position along the Earth’s surface,averaged over 1979–2005, in MPI-ESM-MR,MPI-ESM-LR and ECHAM5/MPI-OM (Fig.3a).Figure 3a shows that at the Earth’s surface the IIE is distributed around 100◦E with a wavy pattern.The normal position of the IIE is reproduced well by the three models. In comparison with the observation,the simulated position of the IIE is farther west in all three models.The position of the IIE simulated by MPI-ESM-LR is the nearest to the observation.The main errors appearing in the model relate to the wavy pattern of the IIE changing with latitude.The maximum deviation is located in the northern part of the IIE. The anomalies of the IIE position are further shown in Figs. 3b and 3c.Figure 3b shows that the negative anomalous position of the IIE is reproduced by the three models,but they are situated more westward than observed.The deviation in modeling the wavy pattern of the IIE’s change with latitude is largest in negative anomaly years,followed by normal and positive anomaly years.The simulated pattern of the positive anomalous position of the IIE mirrors the negative condition to some extent.The three simulated positive anomalous positions are situated more eastward than in the observation.The wavy pattern of the IIE’s change with latitude in the positive anomalous condition is reproduced well(Fig.3c).
The corresponding Taylor diagram(Fig.4)quantitatively shows the capacity of the three models in simulating the IIE position.The evaluation results presented in Fig.4 coincide with the results in Fig.3.The models best simulate the positive anomalous position of the IIE,followed by the normal position of the IIE,and then the negative anomalous position of the IIE.However,even the lowest correlation coefficient(0.75)passes the significance test at the 99%confidence level.If we consider all three conditions of the IIE position together,it is apparent(Fig.4)that MPI-ESM-LR has the highest capacity in simulating the IIE position,because the distance between the evaluation and the observational points is the shortest.MPI-ESM-MR takes second place.The capacities of the two new models are better than that of ECHAM5/MPI-OM.
4.2.SST and circulation anomalies associated with IIE variability
Figure 5a shows observed JJA SST anomalies(SSTAs) regressed onto the IIE index.The SSTAs are similar to the decaying phase of an El Ni˜no event(or the developing phase of La Ni˜na).Previous studies have indicated that the decaying phase of El Ni˜no tends to intensify the western Pacific subtropical high(WPSH)(Huang et al.,1998;Chen,2002; Sui et al.,2007),which can result in an enhanced WPSH with a farther south position and stronger Mei-yu front appearing along the middle–lower reaches of the Yangtze River.An anomalous cyclone in relation to the stronger Mei-yu front further attracts the IIE to shift eastward(Cao et al.,2012).All three models capture the decaying El Ni˜no pattern.However, ECHAM5/MPI-OM overestimates the strength of decaying El Ni˜no,while MPI-ESM-MR underestimates its strength. MPI-ESM-LR simulates the decaying El Ni˜no pattern best among all three models.The fact that the results associated with ECHAM5/MPI-OM are quite different from those of the other two models may be caused by the large deviation in ECHAM5/MPI-OM in simulating the ENSO amplitude, which has been reduced in MPI-ESM(Jungclaus et al.,2013;Stevens et al.,2013).Actually,a general improvement from CMIP3 to CMIP5 models in their representation of ENSO’s amplitude,spectrum,and life cycle is apparent(Guilyardi et al.,2012;Bellenger et al.,2014).
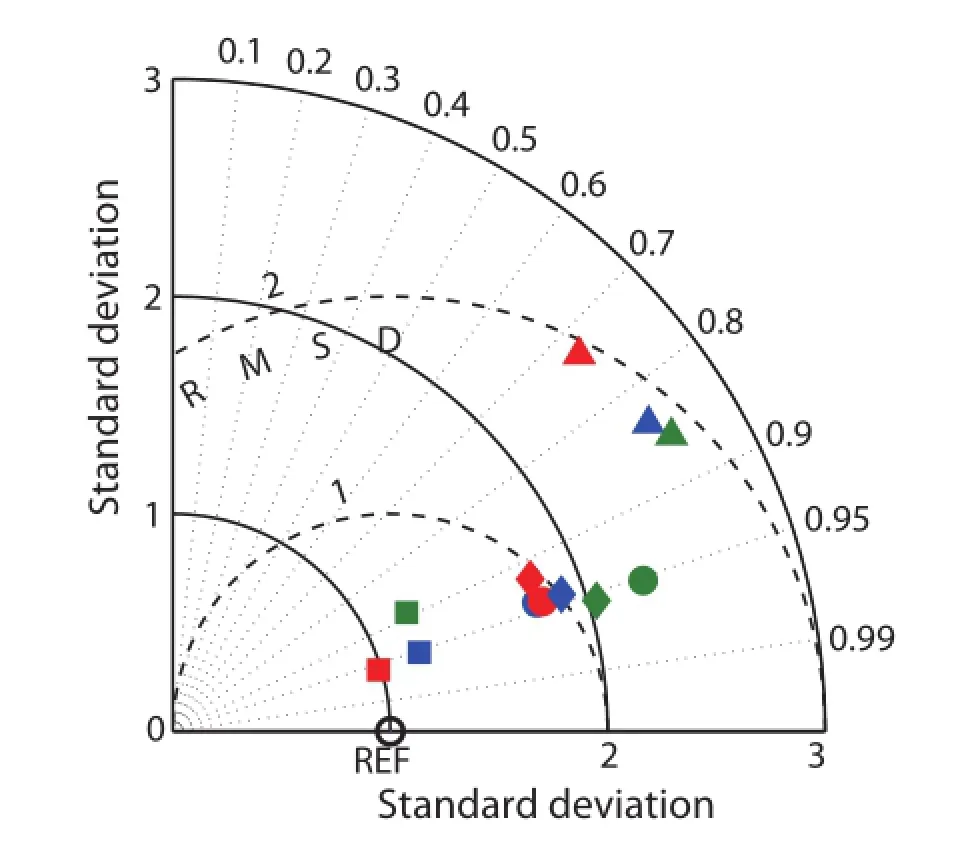
Fig.4.Taylor diagram of normal(solid circles),more westward (triangles),and more eastward(squares)positions of the IIE. Diamonds denote the composition of the three positions of the IIE.Blue denotes MPI-ESM-MR,red denotes MPI-ESM-LR, and black denotes ECHAM5/MPI-OM.The black circle denotes the observations.
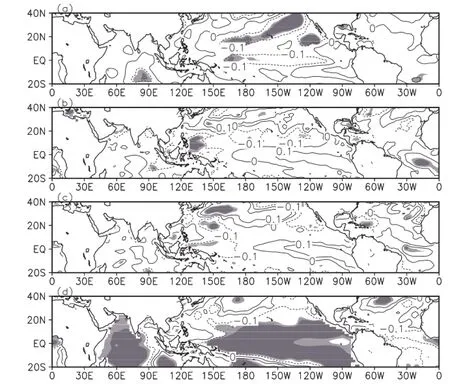
Fig.5.SST regressed onto the IIE time series:(a)observation;(b)MPI-ESM-MR;(c) MPI-ESM-LR;(d)ECHAM5/MPI-OM.Shaded areas from light to dark denote statistical significance at the 90%and 95%confidence level.
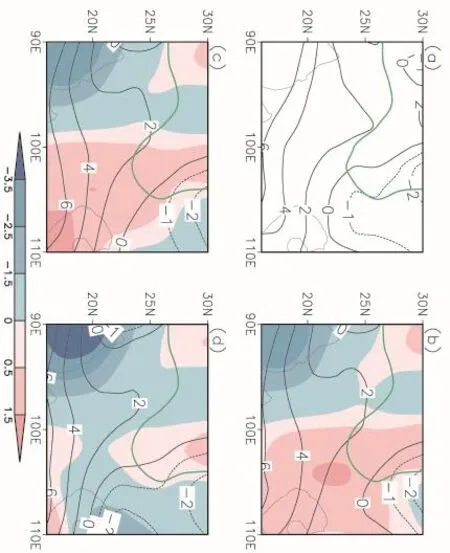
Fig.6.JJA zonal wind at 850 hPa:(a)20th century reanalysis data(version 2);(b)MPI-ESM-MR;(c)MPI-ESMLR;(d)ECHAM5/MPI-OM.Shaded areas denote the difference between the modeling results and observations.Units: m s-1.The green solid line represents the terrain.
Figure 6 shows the mean state of zonal wind and its difference between the modeling results and observations at 850 hPa.In summer,the interface between the easterly and westerly flow appears east of 100◦E(Fig.6a).Figures 6b–d show that all three models simulate the pattern of zonal wind well,but with deviation around 3.5 m s-1in an absolute sense.The maximum negative deviation of the three models appears around the western coast of the Indo-China Peninsula.The maximum positive deviation of MPI-ESMMR and MPI-ESM-LR mainly appears in the eastern research domain,with a value above 1.5 m s-1.The positive deviation of ECHAM5/MPI-OM is scattered in the northwestern,north-central and southeastern domains.The skill of MPI-ESM-MR and MPI-ESM-LR in modeling summer zonal wind is similar,and is slightly improved compared with ECHAM5/MPI-OM.Because the IIE interface is defined along the surface isobaric level,we focus our analysis here at 24◦N,850 hPa.The zero-line of zonal wind at 24◦N located at 102◦E agrees with the IIE position at 24◦N(Fig. 3a),suggesting the IIE position can be found in the observational zonal wind field.The modeling results reproduce this distribution characteristic but with a certain level of deviation.The position of the IIE varies significantly on the interannual time scale(Cao et al.,2012).Figure 7a shows the observational horizontal wind at 850 hPa regressed onto the observational IIE time series for 1979–2005.The most pronounced feature in Fig.6a is the enhanced anticyclone centered around 20◦N,dominating the region from the western Pacific to East Asia.The easterly anomalies at the southern flank of the enhanced anticyclone appear around 10◦N,and the southwesterly anomalies at the northwestern and western flank of the enhanced anticyclone appear between 20◦N and 30◦N.In the remaining area,the anomalous signals are not very significant.The enhanced anticyclonic pattern appears in all three modeling results.These results indicate that the three models can reflect the key physical process impacting the interannual variability of the IIE.There are,however, some deviations in the three modeling results(Figs.7b–d). The position of the enhanced anticyclone simulated by MPIESM-MR is located farther northward,with a center around 25◦N,and southwesterly anomalies over the northwestern flank of the enhanced anticyclone and easterly anomalies over the southern flank around the enhanced anticyclone are stronger than observed.The position of the enhanced anticyclone simulated by MPI-ESM-LR is similar to the observation.However,the southwesterly anomalies over the northwestern flank of the enhanced anticyclone are weaker,and the easterly anomalies over the southern flank around the enhanced anticyclone are stronger than observed.The position of the enhanced anticyclone simulated by ECHAM5/MPIOM is more southerly,with its center around 16◦N,and both the southwesterly anomalies over the northwestern flank of the enhanced anticyclone and the easterly anomalies over the southern flank around the enhanced anticyclone,resembling the wind anomalies simulated by MPI-ESM-MR,are too strong in comparison with the observation.This difference is probably related to the overestimated ENSO SSTA in the relationship between ENSO and IIE in ECHAM5/MPIOM.If we calculate the spatial correlation coefficients between the modeling results and observations around the IIE area(0◦–40◦N,90◦–140◦E)for both zonal and meridional winds,MPI-ESM-LR obtains the highest correlation coefficients,with 0.65 for the zonal wind field and 0.67 for the meridional wind field.MPI-ESM-MR has the lowest correlation coefficients,with 0.52 for the zonal wind field and 0.62 for the meridional wind field,and the correlation coefficients associated with ECHAM5/MPI-OM are between those of MPI-ESM-LR and MPI-ESM-MR,at 0.64 for the zonal wind field and 0.55 for meridional wind field.Therefore, the circulation anomalies in relation to the IIE are best represented by MPI-ESM-LR among the three models.
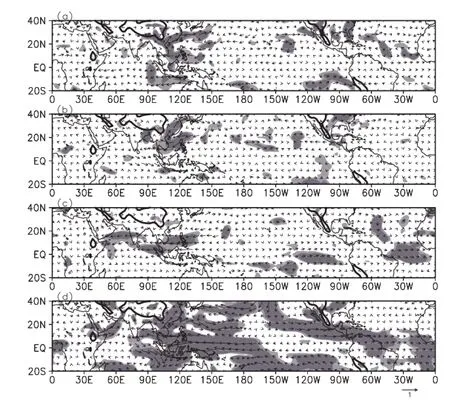
Fig.7.Horizontal wind at 850 hPa regressed onto the IIE time series:(a)observation; (b)MPI-ESM-MR;(c)MPI-ESM-LR;(d)ECHAM5/MPI-OM.Shaded areas from light to dark denote statistical significance at the 90%and 95%confidence level.The black solid line represents the terrain.
Figure 8 shows the geopotential height anomaly at 850 hPa regressed onto the IIE time series.The anomalous high with a center at around(20◦N,130◦E)is consistent with the anomalous horizontal wind pattern around the same region (Figs.7 and 8),suggesting that there is an enhanced WPSH. All three models capture the anomalous high over western Pacific.The maximum bias appears in ECHAM5/MPI-OM.However,while many areas pass the significance test at the 95%confidence level in ECHAM5/MPI-OM,these areas—except those around the western Pacific—cannot be found in the observation.In general,compared with ECHAM5/MPIOM,MPI-ESM has made progress,especially in reducing false circulation signals associated with the IIE variability.For the vertical mean temperature at 200–500 hPa(Fig. 9a),a positive center appears at 30◦N in East Asia,which might be related to the diabatic heating contributed by the summer Mei-yu front(Liu et al.,1999;Wu et al.,1999). When the diabatic heating is stronger than normal along the middle–lower reaches of the Yangtze River,the IIE is farther east than normal,and vice versa.Compared to MPIESM-LR and ECHAM5/MPI-OM,MPI-ESM-MR best captures the observational pattern of the vertical mean temperature at 200–500 hPa.These results suggest that MPI-ESMMR possesses a better simulation capability for the middle–upper troposphere,possibly because of the higher vertical resolution of MPI-ESM-MR compared with MPI-ESM-LR or ECHAM5/MPI-OM.
5.Future projections using MPI-ESM
5.1.Position of the IIE
Figure 10 shows the simulated longitude–pressure sections of equivalent potential temperature(along 21.45◦N)under the RCP2.6 and RCP8.5 scenarios during JJA.In all the longitude–pressure sections(Figs.10a–e),the equivalent potential temperatures exhibit a typical saddle-shaped pattern with the lower centers positioned around 100◦E,as in the historical experiment.Under the RCP2.6 scenario,the equivalent potential temperature tends to become warmer than the historical temperature at all isobaric surfaces,with more significant warming below 600 hPa.In comparison with the equivalent potential temperature under the RCP2.6 scenario, under the RCP8.5 scenario,the warming tendency of equivalent potential temperature is similar to that under the RCP2.6 scenario but with a different warming pattern:the relatively weak warming band(below 5 K)appears around the middle troposphere in both MPI-ESM-MR and MPI-ESM-LR. Figures 10c and f show that the equivalent potential temperature difference between RCP8.5 and RCP2.6 almost shares the same pattern:the equivalent potential temperature below 700 hPa becomes warmer than that above 700 hPa; namely,the positive difference has a stratified structure.The longitude–pressure sections of JJA equivalent potential temperature along five other latitudes(figures omitted)also share the similar pattern as Fig.10.
Figure 11 shows the IIE’s position averaged from 2006 to 2100 under both the RCP2.6 and RCP8.5 scenario.The IIE’s position and its spatial structure under the RCP2.6 and RCP8.5 scenarios are generally similar to those in the historical experiments.These results,obtained by both MPIESM-MR and MPI-ESM-LR,suggest that global warming may not significantly change the IIE’s position;namely,theFig.10.Simulated JJA equivalent potential temperature along 21.45◦N averaged from 2006 to 2100:(a)MPI-ESM-MR under RCP2.6;(b) MPI-ESM-MR under RCP8.5;(c)difference between RCP8.5 and RCP2.6 obtained by MPI-ESM-MR;(d)MPI-ESM-LR under RCP2.6; (e)MPI-ESM-LR under RCP8.5;(f)difference between RCP8.5 and RCP2.6 obtained by MPI-ESM-LR.Units:K. IIE’s mean distributions are insensitive to global warming.
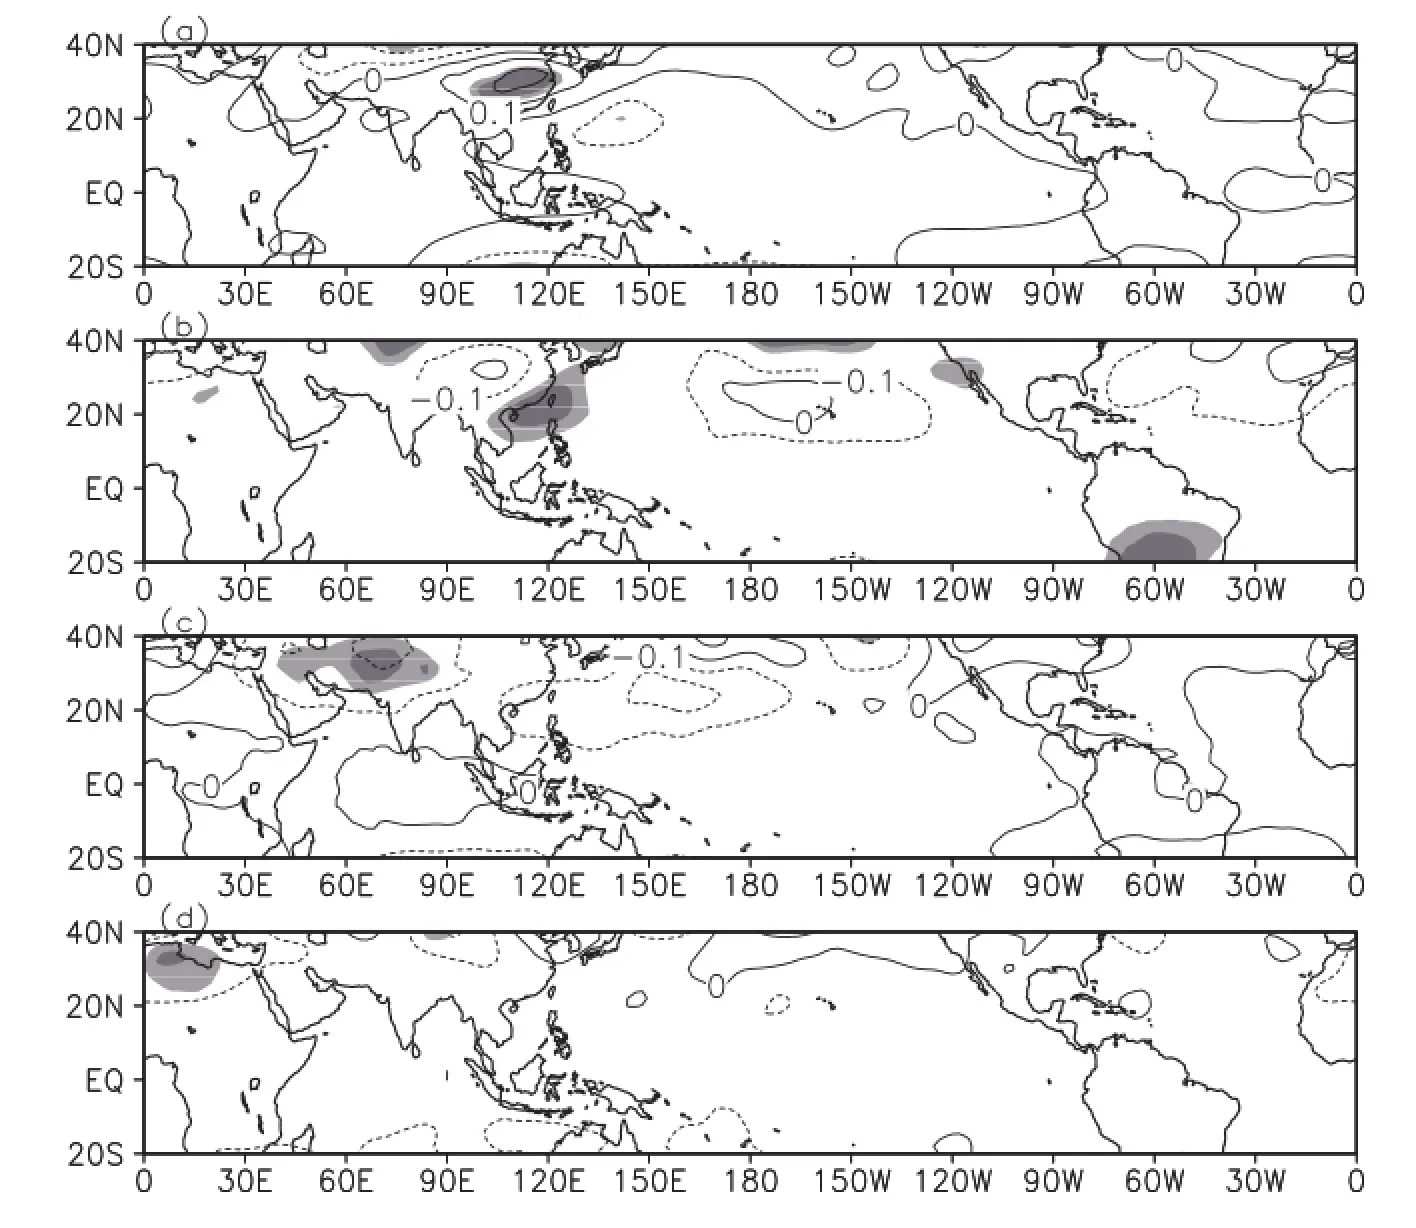
Fig.9.Vertical mean temperature at 200–500 hPa regressed onto the IIE time series: (a)observation;(b)MPI-ESM-MR;(c)MPI-ESM-LR;(d)ECHAM5/MPI-OM.Shaded areas from light to dark denote statistical significance at the 90%and 95%confidence level.
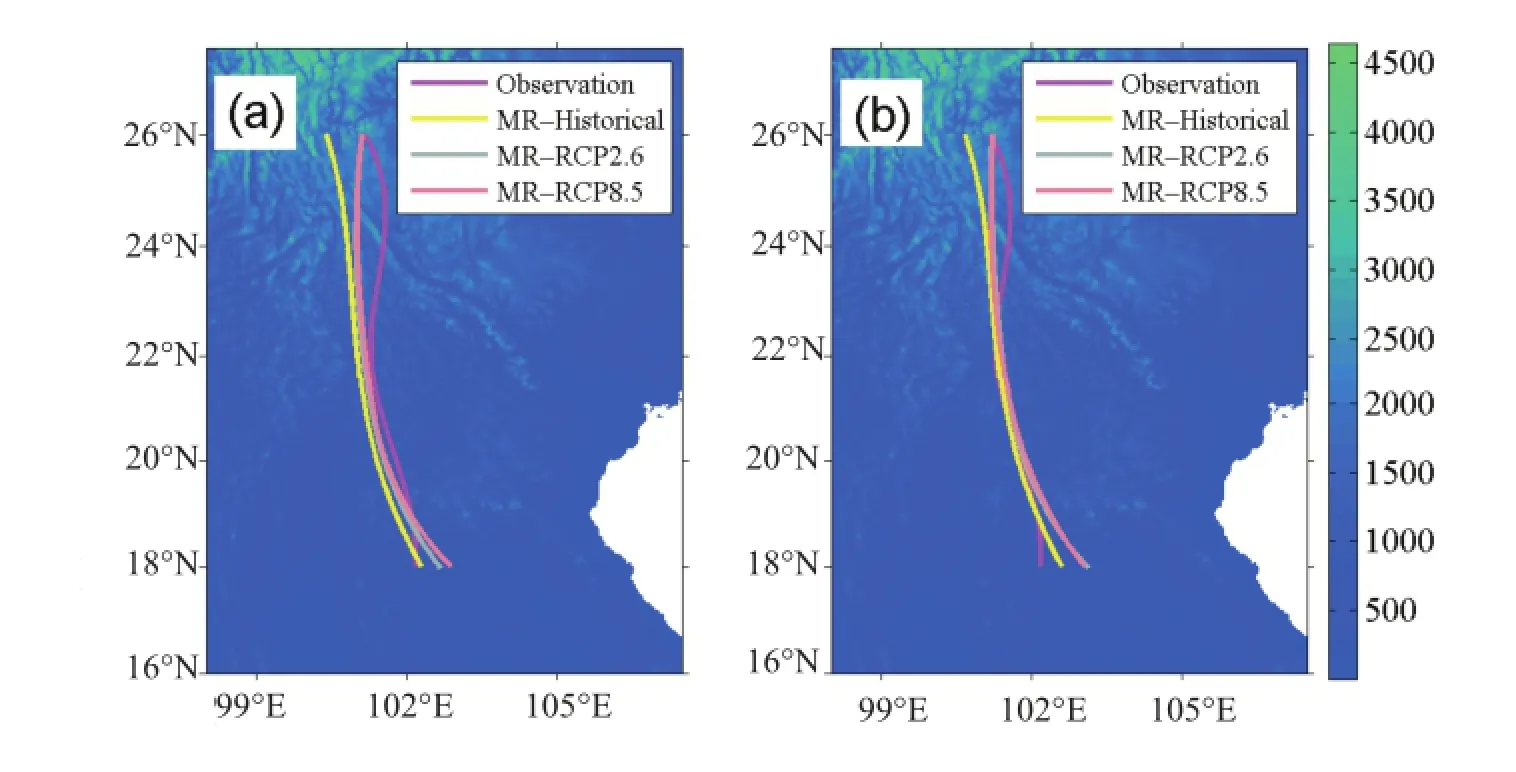
Fig.11.Position of the IIE averaged from 2006 to 2100 under the RCP2.6 and RCP8.5 scenarios: (a)MPI-ESM-MR;(b)MPI-ESM-LR.
5.2.Mean state of SST and circulation

Fig.12.Simulated JJA SST averaged from 2006 to 2100:(a)MPI-ESM-MR under RCP2.6;(b)MPI-ESM-LR under RCP2.6; (c)MPI-ESM-MR under RCP8.5;(d)MPI-ESM-LR under RCP8.5.Shading denotes the difference in SST between the RCP2.6/RCP8.5 scenario and the historical simulations.Units:K.
Fig.13.Simulated JJA horizontal wind at 850 hPa averaged from 2006 to 2100:(a)MPI-ESM-MR under RCP2.6;(b)MPIESM-LR under RCP2.6;(c)MPI-ESM-MR under RCP8.5;(d)MPI-ESM-LR under RCP8.5.Shading denotes the difference in zonal wind between the RCP2.6/RCP8.5 scenario and the historical simulations.Units:m s-1.
The mean state of SST averaged from 2006 to 2100 under the RCP2.6 and RCP8.5 scenarios is displayed in Fig.12. The SST mean states of MPI-ESM-LR and MPI-ESM-MR show an overall warming trend,with generally more warming in the RCP8.5 scenario(around 2 K)than the RCP2.6 scenario(around 1 K),but the spatial distributions of SST are similar.Figure 13 shows the mean state of horizontal wind at 850 hPa under the RCP2.6 and RCP8.5 scenarios. As with the spatial distributions of the SST mean state,the spatial distributions of the mean states of horizontal wind at 850 hPa share a similar pattern.In Asia,the easterlies are intensified in the tropical Pacific(within 2 m s-1)and the westerlies are intensified in the tropical Indian Ocean(within 2 m s-1).This implies that the East Asian summer monsoon and Indian summer monsoon consistently enhance under the RCP2.6 and RCP8.5 scenarios.These results associated with the horizontal wind at 850 hPa suggest that the overall SST warming may not significantly change the mean state of horizontal wind at 850 hPa.
5.3.SST and circulation anomalies associated with IIE variability
Figure 14 shows the JJA SSTAs regressed onto the IIE time series under the RCP2.6 and RCP8.5 scenarios.The results show that a developing La Ni˜na SSTA pattern appears under the RCP2.6 and RCP8.5 scenarios,suggesting that the relationship between SSTAs and the IIE remains unchanged against a warmer climate background.As with the historical experiments,the negative SSTAs over the tropical Pacific in MPI-ESM-LR are stronger than those in MPI-ESM-MR.
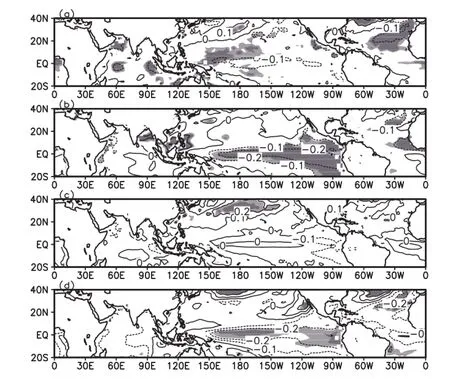
Fig.14.Future projection of SST onto the IIE time series:(a)MPI-ESM-MR under RCP2.6;(b)MPI-ESM-LR under RCP2.6;(c)MPI-ESM-MR under RCP8.5;(d)MPIESM-LR under RCP8.5.Shaded areas from light to dark denote statistical significance at the 90%and 95%confidence level.
Figure 15 shows the averaged 850 hPa zonal wind under the RCP2.6 and RCP8.5 scenarios.Basically,the projected wind field under both scenarios has a very similar distribution to that of the historical experiments in all four experiments(Figs.5 and 15).These patterns are consistent with the results that the IIE position in future projections shares a similar pattern with the historical experiments,implying that the zonal thermal gradient in this domain would not be significantly changed under global warming.Figure 16 shows the future projection of 850 hPa horizontal wind anomalies under the RCP2.6 and RCP8.5 scenarios.The results indicate that the enhanced anticyclone around 20◦N in East Asia will still be the major circulation feature associated with the IIE variability in the future.The 850 hPa geopotential height anomalies associated with the IIE variability in the observation and historical experiments is not reflected in the future projections(figures omitted),possibly because of the influence of global warming(Yang and Sun,2003;Lu et al.,2008).The future projected vertical mean temperature anomalies at 200–500 hPa are shown in Fig.17.A significant positive center is located around 30◦N in South China and a significant negative center is located around Indonesia in MPI-ESM-MR under RCP2.6.The future projection of vertical mean temperature anomalies in MPI-ESM-MR is generally similar to the observational results,but with larger negative anomalies than those seen in the historical experiments.In MPI-ESM-LR, the positive anomaly center does not appear,and the negative anomaly center moves farther west than MPI-ESM-MR, which resembles the results of MPI-ESM-LR in the historical experiments.Under RCP8.5,the magnitudes of the 200–500 hPa mean temperature anomalies are obviously larger than those under RCP2.6.However,these anomalous centers do not pass the significance test at the 90%confidence level in both MPI-ESM-LR and MPI-ESM-MR,suggesting that the relationship between the IIE and middle-and high-level temperature may change significantly under stronger global warming.
6.Summary and discussion
In this study,the capacities of MPI-ESM-LR,MPI-ESMMR and ECHAM5/MPI-OM in modeling the variability of the IIE were investigated with their integrated data from 1979 to 2005.Among the three models,MPI-ESM-LR outperforms the other two models for most of the diagnostics.In comparison to the 20th century reanalysis data(version 2), the IIE’s position is located around 100◦E under normal conditions and the position under extreme conditions is reproduced by the three models.The three models also reflect the key physical process:when the decaying phase of El Ni˜no appears,an enhanced WPSH will occur with a farther south position,and a significant anomalous cyclone controls the middle–lower reaches of the Yangtze River,which further results in a farther east position of the IIE.When the decaying phase of La Ni˜na appears,the opposite conditions will happen.The three models are sensitive to the different RCP scenarios.The equivalent potential temperature simulated by the three models is warmer under the RCP8.5 scenario than under the RCP2.6 scenario over the research domain,consistent with global warming.However,the saddle structure of the equivalent potential temperature vertical distribution is not sensitive to the RCP scenario used.This important feature directly implies that the IIE’s position simulated under different RCP scenarios by the three models is similar,and almost remains the same as in their historical experiments.The SSTA–anomalous circulation patterns associated with the IIE variability under different future scenarios resemble their historical experiments,suggesting that the key physical process remains unchanged against a global warming background. Through studying global monsoon change in CMIP5,Lee and Wang(2012)found that the monsoon domain does notchange appreciably,implying that the Indian summer monsoon tends to change in phase with the East Asian summer monsoon under each RCP scenario.This may be the main reason why the IIE only presents conspicuous variability on the interannual,but not on the interdecadal,timescale,in both the historical evolution and future changes of the IIE(Cao et al.,2012).
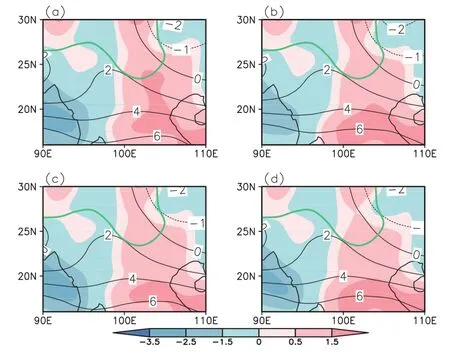
Fig.15.850 hPa zonal wind averaged from 2006 to 2100:(a)MPI-ESM-MR under RCP2.6;(b)MPI-ESM-MR under RCP8.5;(c)MPI-ESM-LR under RCP2.6;(d)MPI-ESM-LR under RCP8.5.Shaded areas denote the difference between the modeling results and observations.Units:m s-1.The green solid line represents the terrain.
Even so,the three models also produce errors in modeling the IIE’s spatial distribution and the physical process associated with the interannual variability of the IIE.Importantly,the deviation between the IIE’s position simulated by the three models and the observation generally become larger with latitude,increasing under normal and extreme conditions.If we compare the deviation for each condition,the maximum deviation appears under the condition in which the IIE is situated more westward than normal.The deviation under the normal position of the IIE varies less,and the minimum deviation occurs under the condition in which the IIE is situated more eastward than normal.Because the terrain becomes more complex with increasing latitude and longitude over the research domain,the error distribution suggests that terrain may be one of the most important factors impacting the formation of the IIE.The fact that the difference between MPI-ESM-MR and MPI-ESM-LR only manifests in the vertical resolution,and the physical processes modulated by terrain are described more realistically in MPIESM than in ECHAM5/MPI-OM,may also be used to interpret why the MPI-ESM-LR almost performs as efficiently as MPI-ESM-MR in modeling the IIE,but MPS-ESM presents higher efficiency than ECHAM5/MPI-OM.Meanwhile,the wavy pattern of the IIE is not sufficiently reproduced by the three models.All of these results imply that an appropriate increaseinthehorizontalresolutionofanumericalmodeland an improvement in describing the physical processes associated with terrain may easily achieve a better result in modeling the spatiotemporal distribution of the IIE.
Throughintercomparingthecapacitiesofnumericalmodels in simulating the Asian summer monsoon between CMIP3 and CMIP5,Sperber et al.(2013)demonstrated that there is a large deviation in the simulation of the WPSH, which,unfortunately,is one of the most important components of the East Asian summer monsoon system(Tao and Chen,1987).It significantly modulates the IIE’s interannual variability:when the WPSH’s position is more southward and westward than normal,the IIE will move more westward thannormal,andviceversa(Caoetal.,2012).Figure7showsalmost identical results to these previous studies,suggesting that an improvement in the simulation of the WPSH may be an efficient way to further improve the performance of MPIESM in modeling the interannual variability of the IIE.
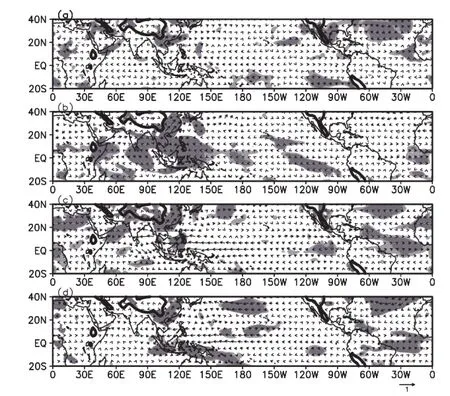
Fig.16.Future projection of 850 hPa horizontal wind regressed onto the IIE time series: (a)MPI-ESM-MR under RCP2.6;(b)MPI-ESM-LR under RCP2.6;(c)MPI-ESM-MR under RCP8.5;(d)MPI-ESM-LR under RCP8.5.Shaded areas from light to dark denote statistical significance at the 90%and 95%confidence level.The black solid line represents the terrain.
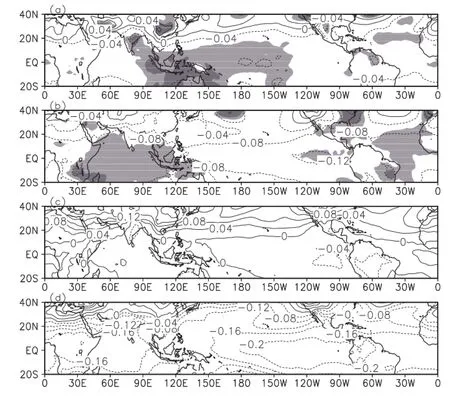
Fig.17.Future projection of vertical mean temperature at 200–500 hPa regressed onto the IIE time series:(a)MPI-ESM-MR under RCP2.6;(b)MPI-ESM-LR under RCP2.6; (c)MPI-ESM-MR under RCP8.5;(d)MPI-ESM-LR under RCP8.5.Shaded areas from light to dark denote statistical significance at the 90%and 95%confidence level.
Acknowledgements.We thank the anonymous reviewers for their valuable comments that led to improvement of the manuscript. This work was supported by the National Natural Science Foundation of China(Grant No.41375097)and the Jiangsu Collaborative Innovation Center for Climate Change.The data of MPI-ESM and ECHAM5/MPIOM were downloaded from http://www-pcmdi.llnl. gov/and https://esg.llnl.gov:8443/.The twentieth century reanalysis data(version 2)were downloaded from http://www.esrl.noaa.gov/ psd/.
REFERENCES
Annamalai,H.,K.Hamilton,and K.R.Sperber,2007:The South Asian summer monsoon and its relationship with ENSO in the IPCC AR4 simulations.J.Climate,20,1071–1092.
Bellenger,H.,E.Guilyardi,J.Leloup,M.Lengaigne,and J. Vialard,2014:ENSO representation in climate models:From CMIP3 to CMIP5.Climate Dyn.,42(7–8),1999–2018,doi: 10.1007/s00382-013-1783-z.
Brovkin,V.,T.Raddatz,C.H.Reick,M.Claussen,and V.Gayler, 2009:Global biogeophysical interactions between forest and climate.Geophys.Res.Lett.,36,L07405,doi:10.1029/2009 GL037543.
Cao,J.,J.M.Hu,and Y.Tao,2012:An index for the interface between the Indian summer monsoon and the East Asian summer monsoon.J.Geophys.Res.,117(D18),D18108,doi: 10.1029/2012JD017841.
Chen,W.,2002:Impacts of El Ni˜no and La Ni˜na on the cycle of the East Asian winter and summer monsoon.Chinese J.Atmos.Sci.,26,595–610.(in Chinese)
Compo,G.P.,J.S.Whitaker,and P.D.Sardeshmukh,2006:Feasibility of a 100 year reanalysis using only surface pressure data.Bull.Amer.Meteor.Soc.,87,175–190,doi:10.1175/ BAMS-87-2-175.
Compo,G.P.,and Coauthors,2011:The twentieth century reanalysis project.Quart.J.Roy.Meteor.Soc.,137,1–28.
Ding,Y.H.,1994:The summer monsoon in East Asia.Monsoons over China,Kluwer Acad.,90 pp.
Flohn,H.,1957:Large-scale aspects of the“summer monsoon”in South and East Asia.J.Meteor.Soc.Japan,75,180–186.
Giorgetta,M.,and Coauthors,2013:The atmospheric general circulation model ECHAM6:Model description.[Available online at http://www.mpimet.mpg.de/fileadmin/publikationen/ Reports/WEBBzE 135.pdf]
Guilyardi,E.,H.Bellenger,M.Collins,S.Ferrett,W.J.Cai,andA. T.Wittenberg,2012:A first look at ENSO in CMIP5.Clivar Exchanges,17(1),29–32.
Hagemann,S.,A.Loew,and A.Andersson,2013:Combined evaluation of MPI-ESM land surface water and energy fluxes.J. Adv.Model.Earth Syst.,5,259–286.
Huang,P.,P.F.Wang,K.M.Hu,G.Huang,Z.H.Zhang,Y.Liu, and B.L.Yan,2014:An introduction to the integrated climate model of the center for monsoon system research and its simulated influence of El Nin˜o on East Asian-western North Pacific climate.Adv.Atmos.Sci.,31(5),1136–1146, doi:10.1007/s00376-014-3233-1.
Huang,R.H.,Y.H.Xu,P.F.Wang,and L.T.Zhou,1998:The features of the catastrophic flood over the Changjiang river basin during the summer of 1998 and cause exploration.Climatic and Environmental Research,3(4),300–313.(in Chinese)
Huang,R.H.,J.L.Chen,L.Wang,and Z.D.Lin,2012:Characteristics,processes,and causes of the spatio-temporal variabilities of the East Asian monsoon system.Adv.Atmos.Sci., 29,910–942.
Ilyina,T.,K.D.Six,J.Segschneider,E.Maier-Reimer,H.M. Li,and I.N´u˜nez-Riboni,2013:Global ocean biogeochemistry model HAMOCC:Model architecture and performance as component of the MPI-Earth system model in different CMIP5 experimental realizations.Journal of Advances in Modeling Earth Systems,5,287–315.
Jin,Z.H.,and L.X.Chen,1982:On the medium-range oscillation of the East Asian monsoon circulation system and its relation with the Indian monsoon system.The National Symposium Collections on the Tropical Summer Monsoon,People’s Press Yunnan Province,Kunming,China,204–215.(in Chinese)
Jungclaus,J.H.,and Coauthors,2013:Characteristics of the ocean simulations in the Max Planck Institute Ocean Model (MPIOM)the ocean component of the MPI-Earth system model.J.Adv.Model.Earth Syst.,5,422–446.
Krishnamurti,T.N.,and H.N.Bhalme,1976:Oscillations of a monsoon system.Part I.Observational aspects.J.Atmos.Sci., 33,1937–1954.
Lau,K.M.,and M.T.Li,1984:The monsoon of East Asia and its global associations—A survey.Bull.Amer.Meteor.Soc.,65, 114–125.
Lee,J.-Y.,and B.Wang,2012:Future change of global monsoon in the CMIP5.Clim.Dyn.,42(1–2),101–119,doi: 10.1007/s00382-012-1564-0.
Li,J.P.,and L.Zhang,2009:Wind onset and withdrawal of Asian summer monsoon and their simulated performance in AMIP models.Climate Dyn.,32,935–968.
Liu,Y.M.,G.X.Wu,H.Liu,and P.Liu,1999:The effect of spatially nonuniform heating on the formation and variation of subtropical high.Part III:Condensation heating and South Asia high and western Pacific subtropical high.Acta Meteorologica Sinica,57(5),525–538.(in Chinese)
Lu,J.,G.Chen,and D.M.Frierson,2008:Response of the zonal mean atmospheric circulation to El Ni˜no versus global warming.J.Climate,21(22),5835–5851.
Lu,R.Y.,and Y.H.Fu,2010:Intensification of East Asian summer rainfall interannual variability in the twenty-first century simulated by 12 CMIP3 coupled models.J.Climate,23(12), 3316–3331.
Marsland,S.J.,H.Haak,J.H.Jungclaus,M.Latif,and F.R¨oske, 2003:The Max-Planck-Institute global ocean/sea ice model with orthogonal curvilinear coordinates.Ocean Model.,5, 91–127.
Reick,C.H.,T.Raddatz,V.Brovkin,and V.Gayler,2013:Representation of natural and anthropogenic land cover change in MPI-ESM.J.Adv.Model.Earth Syst.,5,459–482.
Roeckner,E.,and Coauthors,2003:The atmospheric general circulation model ECHAM5 Part I:Model description.Max Planck Institute f¨ur Meteorology Rep,No.349,127 pp.
Roeckner,E.,and Coauthors,2006:Sensitivity of simulated climate to horizontal and vertical resolution in the ECHAM5 atmosphere model.J.Climate,19,3771–3791.
Roeckner,E.,T.Mauritsen,M.Esch,and R.Brokopf,2012:Im-pact of melt ponds on Arctic sea ice in past and future climates as simulated by MPI-ESM.J.Adv.Model.Earth Syst., 4,M00A02,doi:10.1029/2012MS000157.
Smith,T.M.,R.W.Reynolds,T.C.Peterson,and J.Lawrimore, 2008:Improvements to NOAA’s historical merged land–oceantempanalysis(1880–2006).J.Climate,21,2283–2296. Sperber,K.R.,H.Annamalai,I.-S.Kang,A.Kitoh,A.Moise, A.Turner,B.Wang,and T.Zhou,2013:The Asian summer monsoon:An intercomparison of CMIP5 vs.CMIP3 simulations of the late 20th century.Climate Dyn.,41,2711–2744.
Stevens,B.,and Coauthors,2013:Atmospheric component of the MPI-M earth system model:ECHAM6.J.Adv.Model.Earth Syst.,5,146–172.
Sui,C.-H.,P.-H.Chung,and T.Li,2007:Interannual and interdecadal variability of the summertime western North Pacific subtropical high.Geophys.Res.Lett.,34(11),doi: 10.1029/2006GL029204.
Tao,S.Y.,and L.X.Chen,1987:A review of recent research on the East Asian summer monsoon in China.Monsoon Meteorology,C.P.Chang and T.N.Krishnamurti,Eds.,Oxford University Press,Oxford,U.K.,60–92.
Taylor,K.E.,2001:Summarizing multiple aspects of model performance in a single diagram.J.Geophys.Res.,106(D7), 7183–7192,doi:10.1029/2000JD900719.
Wang,B.,and LinHo,2002:Rainy season of the Asian–Pacific summer monsoon.J.Climate,15,386–398.
Webster,P.J.,V.O.Maga˜na,T.N.Palmer,J.Shukla,R.A.Tomas, M.Yanai,and T.Yasunari,1998:Monsoons:Processes,predictability,and the prospects for prediction.J.Geophy.Res., 103,14451–14510.
Whitaker,J.S.,G.P.Compo,X.Wei,and T.M.Hamill,2004: Reanalysis without radiosondes using ensemble data assimilation.Mon.Wea.Rev.,132,1190–1200.
Wu,G.X.,Y.M.Liu,and P.Liu,1999:The effect of spatially nonuniform heating on the formation and variation of subtropical high.Part I:Scale analysis.Acta Meteorologica Sinica,57(3), 257–263.(in Chinese)
Wu,G.X.,Y.M.Liu,B.He,Q.Bao,A.M.Duan,and F.F.Jin, 2012:Thermal controls on the Asian summer monsoon.Scientific Reports,2,404,doi:10.1038/srep00404.
Xie,S.P.,K.M.Hu,J.Hafner,H.Tokinaga,Y.Du,G.Huang, and T.Sampe,2009:Indian ocean capacitor effect on indo–Western Pacific climate during the summer following El Ni˜no.J.Climate,22,730–747.
Yang,H.,and S.Q.Sun,2003:Longitudinal displacement of the subtropical high in the western Pacific in summer and its influence.Adv.Atmos.Sci.,20(6),921–933,doi:10.1007/ BF02915515.
Zhao,D.M.,and C.B.Fu,2010:Comparisons of low-level circulation characteristics between ECHAM5/MPI-OM results and NCEP/NCAR re-analysis data in East Asia.Atmos.Oce. Sci.Lett.,3,189–194.
Zhou,T.J.,B.Wu,and B.Wang,2009:How well do atmospheric general circulation models capture the leading modes of the interannual variability of the Asian–Australian monsoon?J. Climate,22,1159–1173.
Zhu,Q.G.,J.H.He,and P.X.Wang,1986:A study of circulation differences between east-Asian and Indian summer monsoonswiththeirinteraction.Adv.Atmos.Sci.,3,466–477,doi: 10.1007/BF02657936.
Guo,Y.R.,J.Cao,H.Li,J.Wang,and Y.C.Ding,2016:Simulation of the interface between the Indian summer monsoon and the East Asian summer monsoon:Intercomparison between MPI-ESM and ECHAM5/MPI-OM.Adv.Atmos. Sci.,33(3),294–308,
10.1007/s00376-015-5073-z.
15 March 2015;revised 13 September 2015;accepted 28 September 2015)
∗Jie CAO
Email:caoj@ynu.edu.cn
杂志排行
Advances in Atmospheric Sciences的其它文章
- The Reliability of Global and Hemispheric Surface Temperature Records
- Projected Shifts in K¨oppen Climate Zones over China and Their Temporal Evolution in CMIP5 Multi-Model Simulations
- Impact of Planetary Wave Reflection on Tropospheric Blocking over the Urals-Siberia Region in January 2008
- Detecting the Origins of Moisture over Southeast China: Seasonal Variation and Heavy Rainfall
- Phase Transition of the Pacific Decadal Oscillation and Decadal Variation of the East Asian Summer Monsoon in the 20th Century
- Assessment of Interannual Sea Surface Salinity Variability and Its Effects on the Barrier Layer in the Equatorial Pacific Using BNU-ESM
