Impact of the Pacific-Japan Teleconnection Pattern on July Sea Fog over the Northwestern Pacific:Interannual Variations and Global Warming Effect
2016-11-24JingchaoLONGSupingZHANGYangCHENJingwuLIUandGengHAN
Jingchao LONG,Suping ZHANG∗,Yang CHEN,Jingwu LIU,and Geng HAN
1Physical Oceanography Laboratory,Ocean-Atmosphere Interaction and Climate Laboratory, Ocean University of China,Qingdao 266100
2Meteorological bureau of Quanzhou,Quanzhou 362000
Impact of the Pacific-Japan Teleconnection Pattern on July Sea Fog over the Northwestern Pacific:Interannual Variations and Global Warming Effect
Jingchao LONG1,Suping ZHANG∗1,Yang CHEN1,Jingwu LIU1,and Geng HAN2
1Physical Oceanography Laboratory,Ocean-Atmosphere Interaction and Climate Laboratory, Ocean University of China,Qingdao 266100
2Meteorological bureau of Quanzhou,Quanzhou 362000
The northwestern Pacific(NWP)is a fog-prone area,especially the ocean east of the Kuril Islands.The present study analyzes how the Pacific-Japan(PJ)teleconnection pattern influences July sea fog in the fog-prone area using independent datasets.The covariation between the PJ index and sea fog frequency(SFF)index in July indicates a close correlation,with a coefficient of 0.62 exceeding the 99%confidence level.Composite analysis based on the PJ index,a case study,and model analysis based on GFDL-ESM2M,show that in high PJ index years the convection over the east of the Philippines strengthens and then triggers a Rossby wave,which propagates northward to maintain an anticyclonic anomaly in the midlatitudes, indicating a northeastward shift of the NWP subtropical high.The anticyclonic anomaly facilitates the formation of relatively stable atmospheric stratification or even an inversion layer in the lower level of the troposphere,and strengthens the horizontal southerly moisture transportation from the tropical-subtropical oceans to the fog-prone area.On the other hand,a greater meridional SST gradient over the cold flank of the Kuroshio Extension,due to ocean downwelling,is produced by the anticyclonic wind stress anomaly.Both of these two aspects are favorable for the warm and humid air to cool,condense,and form fog droplets,when air masses cross the SST front.The opposite circumstances occur in low PJ index years,which are not conducive to the formation of sea fog.Finally,a multi-model ensemble mean projection reveals a prominent downward trend of the PJ index after the 2030s,implying a possible decline of the SFF in this period.
Pacific-Japan teleconnection,sea fog frequency,northwestern Pacific,global warming
1.Introduction
Sea fog is a weather phenomenon that occurs over oceans and coastal regions wherein tiny water droplets sustain in the atmospheric boundary layer and cause atmospheric horizontal visibility of less than 1 km.Sea fogs influence offshore activities,maritime routes,and port operations.Besides,the coverage of low-level cloud,including sea fog,plays a significant role in the energy balance of the global climate system (Norris and Leovy,1994;Clement et al.,2009).
Previous researches indicate that sea fogs may occur over the cold Yellow Sea surface under the conditions of plentiful moisture supply and stable atmospheric stratification(Wang, 1983;Hu and Zhou,1997;Gao et al.,2007,2010;Zhang and Bao,2008;Zhang et al.,2009).Besides,the transition of marine stratus cloud into fog,forced by subsidence from the Pacific high near the Californian coast,was proven by Koraˇcin et al.(2001).Climatologically,the sea fog frequency (SFF)over China's adjacent seas is characterized by prominent seasonal variation,which Zhang et al.(2009)comprehensively analyzed.On the interannual timescale,the variation in foggy days is controlled by the monsoon circulation anomaly in spring and summer in the Yellow Sea(Zhang et al.,2005;Wang et al.,2006).
The midlatitude region of the northwestern Pacific (NWP)is highly foggy.The maximum annual mean SFF is 23%(Fu and Song,2014),reaching its peak in July(Zhang et al.,2014a).Sugimoto et al.(2013)indicated that an intensified Okhotsk high and southward shrinking of the northern Pacific subtropical high(NPSH)are responsible for low SFF at Kushiro,Hokkaido,in July.Zhang et al.(2014a)suggested the primary controller of SFF in the NWP is the position and orientation of the NPSH.Yet,the mechanisms involved in the interannual variations of the atmospheric circulations associated with SFF are not well understood.
The Pacific-Japan(PJ),or East Asia-Pacific(EAP),teleconnection pattern is an important atmospheric bridge con-necting the tropical and midlatitude atmosphere.It is triggered by an SST anomaly in the western Pacific warm pool and maintained by the dispersive energy of a quasi-stationary Rossby wave(Nitta,1987;Huang and Li,1987;Huang, 1990;Lu and Huang,1998;Kosaka and Nakamura,2006, 2008,2010,2011).The PJ pattern can influence the atmospheric circulation,large-scale vertical motion,and moist static stability(Weaver and Ramanathan,1997),which may affect the SFF in the NWP.Zhang et al.(2009)found that the phase of the PJ plays an important role in the ending of the fog season in August in the Yellow Sea.
©Institute of Atmospheric Physics/Chinese Academy of Sciences,and Science Press and Springer-Verlag Berlin Heidelberg 2016
In this study,we investigate the impact of the PJ pattern on SFF,with a focus on the atmospheric circulation over the NWP.The paper is organized as follows:A brief description of the datasets used and some definitions is provided in section 2.Section 3 introduces the seasonal and interannual variations of the SFF.Section 4 presents composite analyses, case study and model analysis based on GFED-ESM2M.In section 5,we provide a projection of the PJ index and SFF under global warming conditions.The paper concludes with a summary and discussion in the final section.
2.Data and method
Thesurface-basedobservationsofvisibilityfromICOADS during 1981 to 2005 were used to obtain the SFF(Woodruff et al.,2011).The sounding data at Kushiro were obtained from the University of Wyoming(http://weather.uwyo.edu/ upperair/sounding.html),andunifiedto30-mvertical-interval boxes for calculation and drawing.Ocean temperature and velocity(1981-2005)were obtained from SODA(TAMU Research Group,2014)(Carton and Giese,2008)at a horizontal resolution of 0.5◦×0.5◦and 40 vertical levels with 10-m spacing near the surface(1981-2005).Climate Forecast System Reanalysis data(CFSR)for the period 1981-2005, with a horizontal resolution of 0.5◦×0.5◦,were applied in the analyses of cloud liquid water mixing ratio(CLWMR), geopotential height,air temperature,and winds(http:// nomads.ncdc.noaa.gov/modeldata/cmd pgbh/;Saha et al., 2010).These data include 12 vertical levels below 700 hPa and are capable of characterizing the marine atmospheric boundary layer(MABL)under different circulation conditions.The SST data(1981-2005),on a 2◦grid,were from ERSST.v3b(http://www.esrl.noaa.gov/psd/)(Xue et al.,2003; Smith et al.,2008).Data from CMIP5 were also used,including the following:the historical simulation data[precipitation,3D wind,geopotential height,air temperature,cloud liquid water(CLW),and SST]for the period 1951-2005 from GFDL-ESM2M(Dunne et al.,2012),for analyzing the relationship between precipitation over the east of the Philippines,the PJ pattern,and sea fog in the fog-prone area[horizontal resolution of 2.5◦lat×2◦lon,global grids (144×90),and 17 levels in the vertical direction];data from MIROC-ESM,CanESM2,GFDL-ESM2G,GFDL-ESM2M, CCSM4,CNRM-CM5,MIROC5,andMRI-CGCM3,including their historical and RCP4.5 experiments-used to project the possible trend of the PJ index under global warming. We interpolated the model data to a 2.5◦×2.5◦horizontal resolution,following NCEP-NCAR data.The PJ pattern is reproduced well by these CMIP5 models(figure not shown), comparative to the findings of Kosaka and Nakamura(2011) using CMIP3.
In this study,a fogaWhen the visibility in an observational report in a certain grid is less than 1 km(the code of VV is 90-94 in ICOADS)and there is neither rainfall nor snow at the same time,we defined this as a sea fog event in this grid.ICOADS data are not routinely collected,since the number of ships,buoys,and other platforms available change with time.To avoid this uncertainty,we defined the relative frequency of sea fog occurrence(SFF).The NWP was meshed into a 1◦×1◦grid to calculate the SFF.event was defined as when the visibility was less than 1000 m(excluding precipitation and dust), according to ICOADS.The relative SFF in the grid of 1◦×1◦over the NWP was calculated by

where Nfogis the number of fog events and Nobsis the total number of observations(Zhang et al.,2014a).We defined the ocean east of the Kuril Islands(40◦-50◦N,145◦-165◦E) as the climatological fog-prone area(hereinafter,fog-prone area),where the SFF is basically greater than 15%(Fig.1). The time series of the SFF in each July from 1981 to 2005 in the fog-prone area is defined as the SFF index.
According to Kosaka(2013,personal communication), the PJ pattern can be obtained by regressing vorticity or geopotential height anomalies onto the PJ index,which is extracted from the first principal component(PC1)of the EOF for the monthly meridional pressure gradient force at 850 hPa over the NWP(0◦-60◦N,100◦-160◦E),

in whichφand u represent geopotential height and zonal wind velocity at 850 hPa,respectively;f is the geostrophic parameter and y denote meridional direction.
3.Relationship between SFF and the PJ pattern over the NWP
The climatological annual mean SFF in the NWP is characterized by a zonally elongated band with a maximum up to 21%in the fog-prone area located over the cold flank of the Kuroshio Extension(KE)(Fig.1).The seasonal variations of the SFF are remarkable,with more fog in summer than in winter and a peak in July(Fig.1).
The regressions of geopotential height and the wind anomaly at 850 hPa in July onto the PJ index show that there are three anomalous centers-in the ocean east of the Philippines,southeast of Japan,and in the Okhotsk Sea(Fig.2a)-in agreement with the pattern proposed by Nitta(1987)and Huang and Li(1987).The fog-prone area is situated just between the two anomalous centers of the PJ pattern(the rectangle in Fig.2a).In Fig.2b,both the PJ index and the SFFindex in July exhibit a prominent interannual variability,with a correlation coefficient of 0.62 exceeding the 99%significant level.When the PJ index keeps in its positive phase,the convection over the tropical ocean east of the Philippines is stronger,which is conducive to the formation of a positive phase of the PJ pattern.Controlled by such a PJ pattern,the pressure pattern and associated southerly wind anomaly are favorable for fog formation;this is discussed in detail in the following sections.
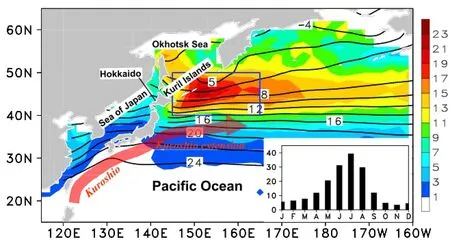
Fig.1.Climatological distribution of annual SFF(%)over the NWP(color scale),climatological SST(contours;◦C),and the SFF seasonal variation(bottom right)in the fog-prone area(blue rectangle in the figure),based on ICOADS.Schematic flow patterns of the Kuroshio and its extension are shown by the meandering red vector.

Fig.2.(a)Regressions of geopotential height anomalies(contours;gpm)and wind anomalies(vectors;m s−1)at 850 hPa in July onto the PJ index from 1981 to 2005(gray shading denotes the 90%confidence level for the geopotential height anomaly).(b)Interannual variation of PJ index and SFF index in the fog-prone area in July(the blue rectangle is the same as in Fig.1).
4.Comparison between high and low PJ index years
To further investigate the impacts of the PJ pattern on atmospheric circulation and hence the SFF,a composite analysis was performed.As shown in Fig.2b,1981,1984,1989, 1994,1997,1999,2000 and 2002 can be classified as high PJ index years(normalized PJ index of greater than 0.6)(hereinafter,HI years);and 1983,1986,1987,1988,1991,1993, 1998 and 2003 as low PJ index years(normalized PJ index of less than 0.6)(hereinafter,LI years).
4.1.Difference at the near-surface level
In HI years,the NPSH shifts northeastward,strengthening the southerly moisture flux over the fog-prone area (Fig.3a).However,the NPSH is narrow and extends southwestward in LI years;the easterly wind weakens the moisture flux(Fig.3b).Most of the moisture converges along the north flank of the NPSH over the south of the fog-prone area.The static stability at the low level(θ975hPa-θ1000hPa)is strongerin HI years than in LI years.The difference between HI years and LI years exhibits a PJ-like pattern in the geopotential height field with three anomalous centers(−,+,−,from south to north;Fig.3c).The characteristics of the quasistationary Rossby wave are revealed by the wave-activity flux,defined by Takaya and Nakamura(2001).The southerly wind anomalies over the fog-prone area may lead to stronger warm advection,creating a more stable stratification in the low-level atmosphere.
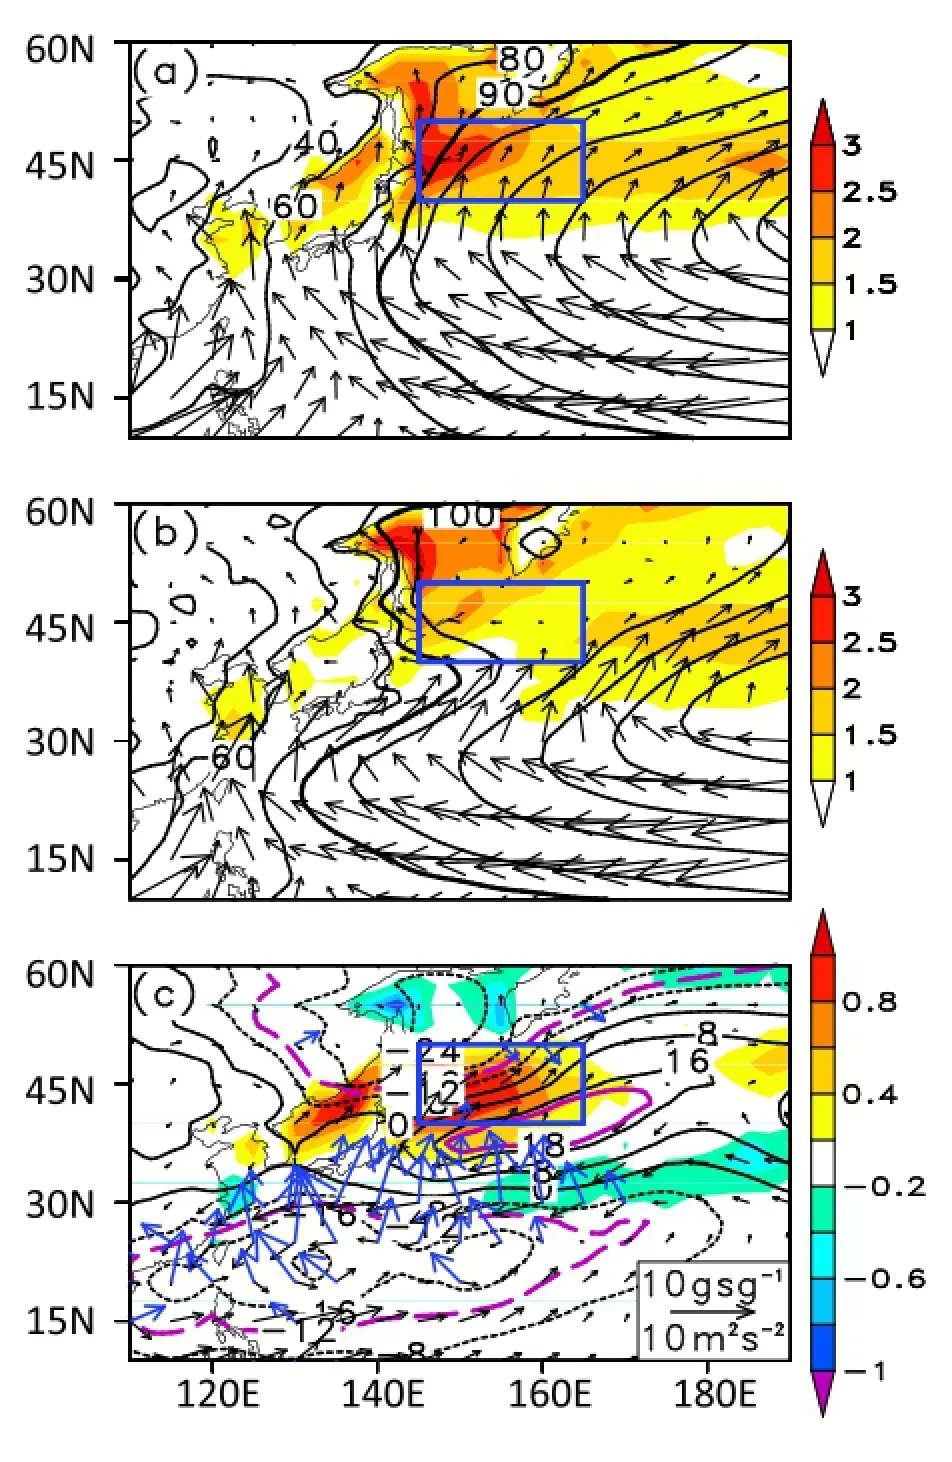
Fig.3.Composite map of(a)HI years,(b)LI years,and(c) the difference between HI years and LI years at 1000 hPa: geopotential height(contours;gpm),low level static stability (θ975hPa-θ1000hPa;shading;K),moisture flux(black vectors; kg m−1s−1),and wave-activity flux at 850 hPa(blue vectors; m2s−2),with scaling in the bottom right of(c).The area circled by the purple contours represents statistical significance at the 90%confidence level,based on the Student's t-test.The blue rectangle is the same as in Fig.1.
The SST(SAT;surface air temperature)in HI years is about 0.8◦C(1.5◦C)higher than in LI years over the north flank of the KE,with southerly wind anomalies(Fig.4a).The difference between SAT and SST,i.e.,SAT-SST,is adopted to denote the stability of the air-sea interface.The spatial pattern of the difference in SAT-SST between HI years and LI years(Fig.4b)resembles that of the low-level static stability in Fig.3c.The greater values of SAT-SST imply greater stability at the air-sea interface.This configuration,along with the low-level stability,facilitates a damping of the development of turbulence farther upward,which is favorable for the maintenance of fog in the fog-prone area.
The fog-prone area lies at the north flank of the KE,with sharp changes in SST(Fig.1).The difference in the meridional SST gradient between HI years and LI years shows that the SST front,which develops between the KE and Oyashio current with a sharp SST gradient,is stronger in HI years than in LI years(Fig.4b).Since sea fogs over this area in July are advection cooling fogs that form when a warmer air mass flows over a colder sea surface and the air temperature decreases to the dew point(Wang,1983),a sharp SST gradient will be favorable for air-mass cooling and hence fog formation(Klein and Hartmann,1993;Li and Zhang,2013).The reinforcement of the meridional SST gradient over the cold flank of the KE is likely to result from the increase in SST over the KE,which may be caused by the ocean downwelling associated with the anticyclonic wind stress anomaly(shown in Fig.4c).A longitude-depth section of sea temperature and ocean vertical motion confirms that the stronger downwelling will lead to a warmer sea temperature under an anticyclonic wind stress anomaly in HI years(Figs.4c and d).
4.2.Difference in vertical structure in the MABL
Figures5aandbshowthatthedepthoftheMABLisshallow at the cold flank of the SST front,and the strengthened vertical gradient of the virtual potential temperature implies thefrequentoccurrenceoftemperatureinversionscappingthe MABL.Over the SST front and its warm flank,virtual potential temperature is relatively uniform under 950 hPa,indicating a well-mixed MABL.The CLWMR is used to represent the fog or cloud.
In HI years,the stable atmospheric stratification and low MABL over the northern edge of the NPSH produces more horizontal motion;the southerly winds march to 50◦N,taking more humid and warmer air to the fog-prone area below 920 hPa.The CLWMR is horizontally distributed with its peak around 960 hPa over the SST front and to its north(Fig. 5a).Whereas,the southerly wind in LI years,with an obvious ascending motion,results in the higher MABL and the rise of the maximum center of CLWMR to 940 hPa,which is probably related to low-level clouds(Fig.5b).The averaged vertical profiles at Kushiro(the location is shown in Fig.6b) in July 2010(typical HI;Fig.5d)and in July 2013(typical LI;Fig.5e)further clarify the difference.In July 2010,the temperature and virtual potential temperature(VPT)profiles show an inversion layer below 300 m.The VPT increases with height,indicating stable stratification in the low-level atmosphere,which results from the configuration of southerly wind below 800 m and westerly wind in the upper layer.The southerly wind in the low-level atmosphere is conducive to the transport of more moisture northward,consistent with Fig.5a.However,the atmospheric stratification is unstable in the low-level atmosphere in July 2013,which is possibly associated with counterclockwise changes in wind direction,from southeasterly at around 400 m to easterly at around 800 m.
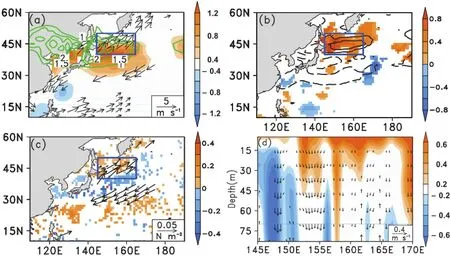
Fig.4.Difference between HI years and LI years:(a)SST(color scale;◦C),SAT(green contours;◦C)and wind(vectors;m s−1)at 1000 hPa,with scaling in the bottom right;(b)air temperature at 2 m minus SST (color scale)and meridional SST gradient(black contours at 0.8 K km−1intervals,±0.8,±1.6,±2.4);(c) ocean vertical motion averaged from the sea surface to 50 m(color scale;m s−1)and wind stress(vectors; N m−2);(d)longitude-depth section of sea temperature(color scale;K),zonal(m s−1)and vertical velocity (10−4m s−1),averaged from 35◦to 45◦N.The difference fields above show statistical significance at the 90%confidence level,based on the Student's t-test.The rectangle is the same as in Fig.1.
In HI years,the positive SAT-SST corresponds to a low and stable MABL,with the CLWMR base close to the sea surface,indicating more fog(Fig.5a).The positive SATSST results from the even larger increase in SAT associated with warm advection(Fig.5a),in spite of the warmer SST in HI years(Fig.5c).In LI years,the weaker warm advection leads to SAT-SST below or near 0◦C,which brings about an unstable air-sea interface that facilitates the lift of the MABL and the level of the maximum CLWMR(Fig.5b).The difference between HI years and LI years shows that a positive CLWMR near the sea surface is capped by a warmer potential temperature anomaly(Fig.5c).The peak of the SAT-SST is not collocated with the maximum of the potential temperature,but is shifted to the north by about 2◦,probably as a result of advection by the southerly wind in HI years(Fig. 5c).
The northeasterly migration of the NPSH in HI years enhances the southerly advection,which is conducive to more moisture transportation and a more stable and lower MABL. On the other hand,the NPSH anomaly favors heating of the SST over the warm flank of the SST front,via downwelling forcing,producing a stronger SST gradient.All of these factors facilitate the generation of sea fog.
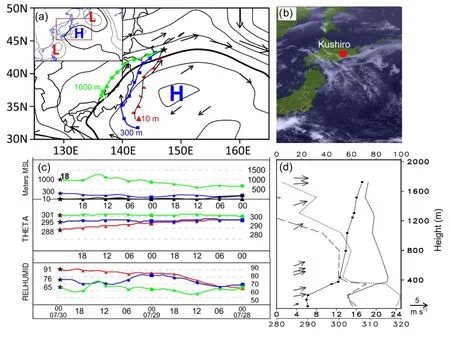
Fig.6.Fog case:(a)Synoptic map.Geopotential height(thick black contours represent 1016 hPa;contours with intervals of 2 hPa)and wind(arrows)at 1000 hPa.The trajectories are represented by red,blue and green lines at 10 m,300 m and 1000 m,respectively.An overview of atmospheric circulation over the NWP is shown in the top left, and the red rectangle denotes the detail shown in the main part of the panel.(b)Multifunctional Transport Satellites (MTSAT)MTSAT visible cloud image at 0000 UTC 30 July.(c)Backward trajectories.Asterisks represent the starting point of the backward tracking.Meters MSL:height,THETA:potential temperature,RELHUMID:relative humidity. (d)Sounding at Kushiro at 0000 UTC 30 July,virtual potential temperature(solid line with black dots;K),temperature (solid line;◦C),dewpoint(dashed line,◦C),RH(dotted line;%),and horizontal wind(arrows;m s−1).
4.3.Case study
To confirm the results from the climatological analysis, we investigated a fog event(30-31 July 2014)and a nonfog event(23 July 2013)in the fog-prone area,based on ICOADS.HYSPLIT(version 4)was used to operate the backward tracing of the air parcels.For the fog event,Fig. 6b shows sea fog covered the ocean to the southeast of Hokkaido.The large-scale circulation pattern was positive-PJ-like(inserted in Fig.6a),and the fog-prone area was controlled by an anticyclonic circulation with southerly wind and stable stratification(Figs.6a and d).The backward tracing of the air parcels shows that the parcels at 10 m,300 m and 1000 mcamefromsouthofthestartlocation[(43◦N,147◦E);asterisks in Fig.6a],indicating the influence a deep Pacific high. The potential temperature(PT)maintained at 295 K and the RH at 10 m increased from 70%to 85%when the air parcel was over the KE,implying a possible contribution of the KE to maintaining the high temperature and humidity(Zhang etal.,2014a).Meanwhile,the PT decreased rapidly to 288 K once it had flowed across to the north flank of the KE,and the RH reached 91%,suggesting the possibility of fog occurrence.
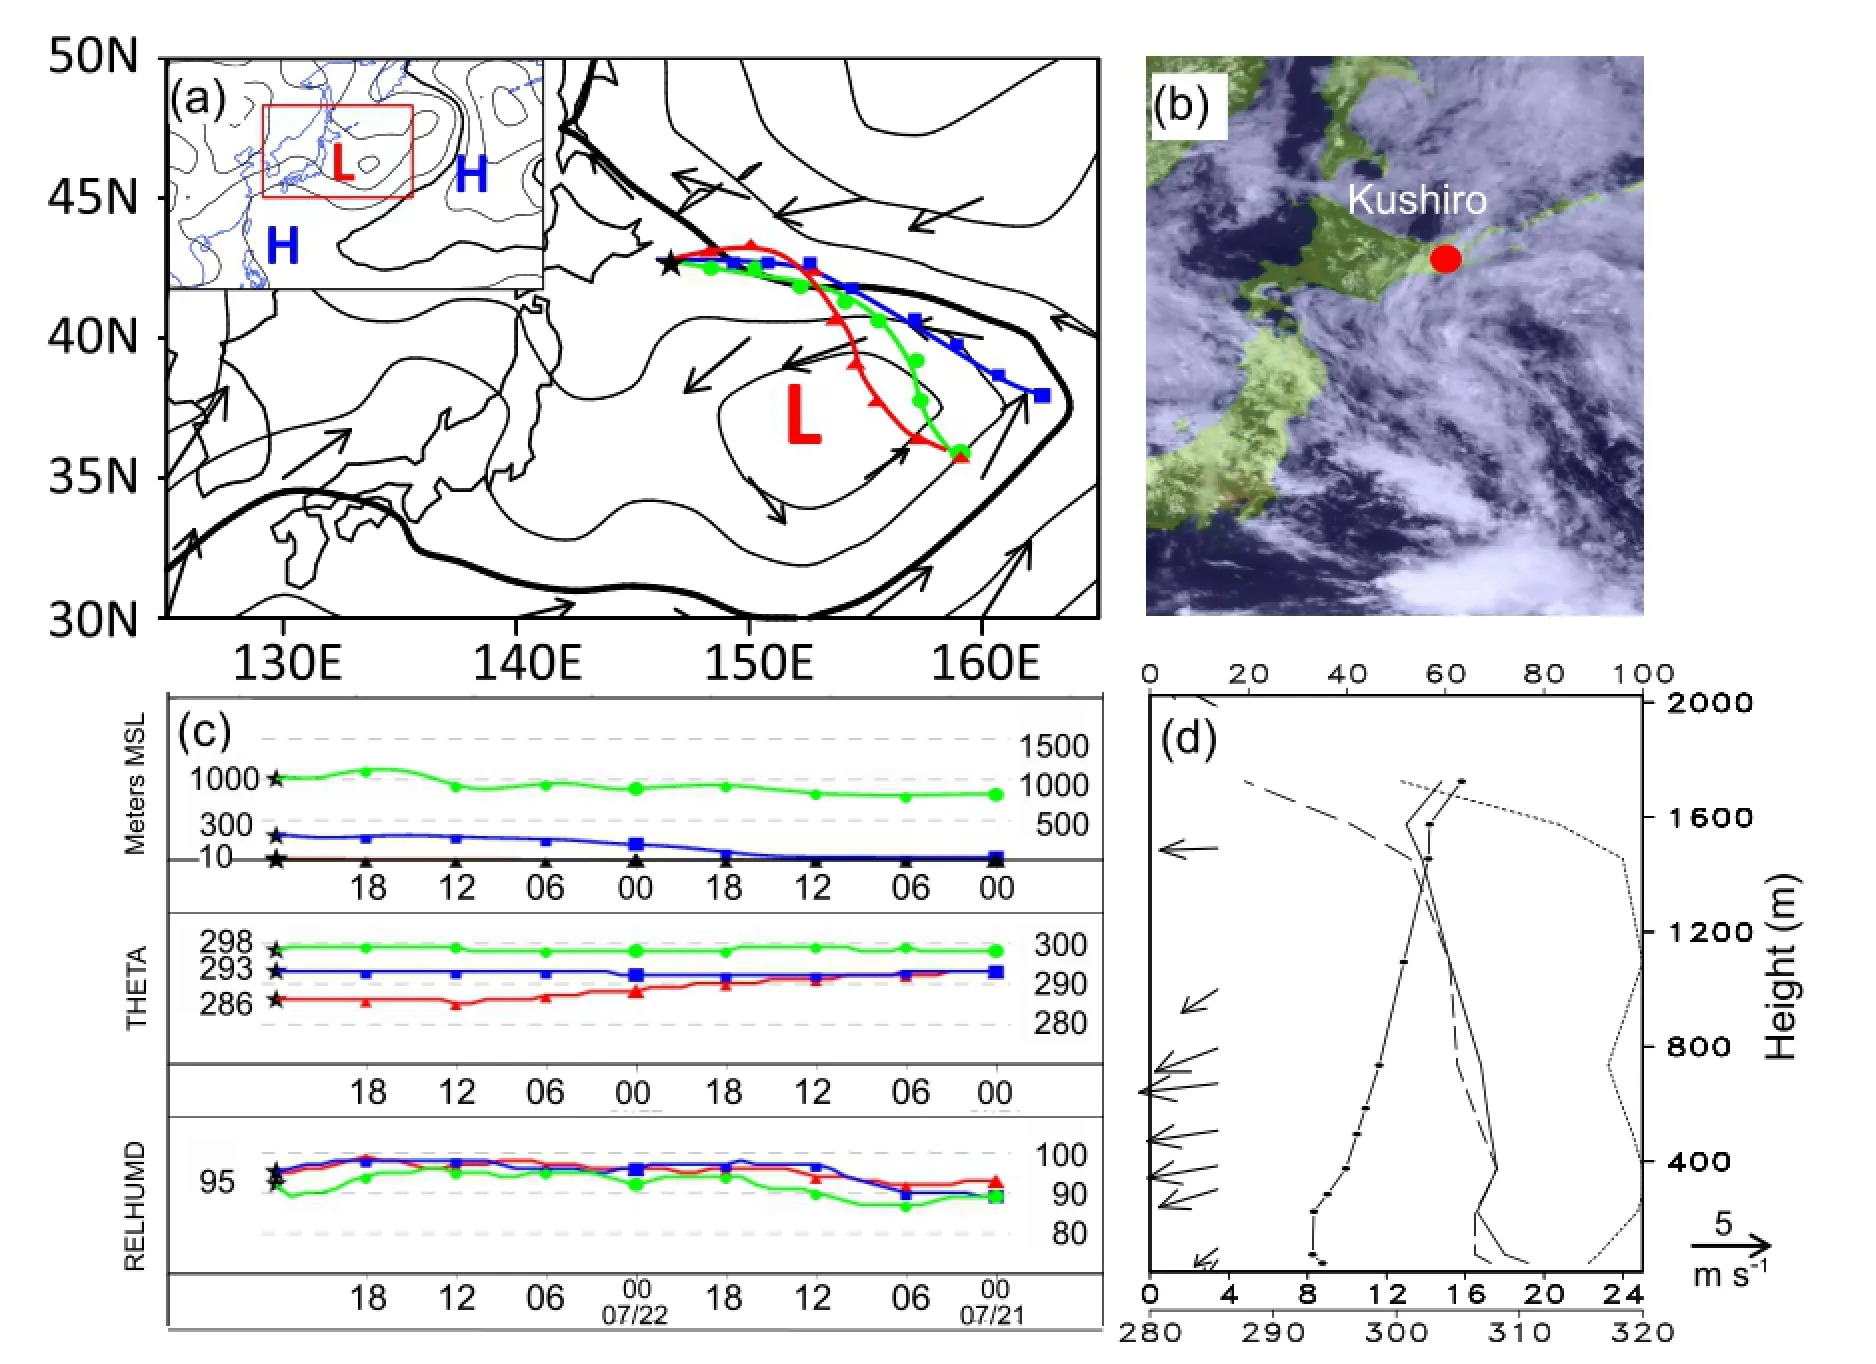
For the non-fog case,Fig.7a shows that the fog-prone area was controlled by a cyclone with northeasterly wind and unstable stratification(Figs.7a and d),favorable for cloud (Fig.7b).The large-scale circulation pattern in this case was negative-PJ-like(inserted in Fig.7a).The trajectory analyses show that the PT at 10 m was almost equal to,or even higher than,that at 300 m,suggestive of weakened stratification in the MABL over the cyclone.The PT dropped remarkably owing to the sharp front,while the RH almost reached saturation from near the sea surface to 1000 m,indicating a deep cloud layer.
The above results imply that the atmospheric circulation and KE front play different roles in the formation of sea fog. The former determines the favorable wind direction and stable atmospheric stratification,while the latter is conducive to maintaining high temperature and humidity and,hence,condensation to fog droplets,after moving across the SST front, which is basically in agreement with the climatological results.
4.4.Analysis based on GFDL-ESM2M
GFDL-ESM2M was used to analyze the atmospheric response to changes in the PJ pattern.Since the PJ pattern is maintained by the dispersive energy of the quasi-stationary Rossby wave triggered by the enhanced anomalous convection over the east of the Philippines(Nitta,1987;Huang and Li,1987;Kosaka and Nakamura,2006),the normalized regional mean(15◦-25◦N,145◦-160◦E)precipitation was used to define enhanced(weakened)convection years,with a value greater than 1.4(less than−1.4),from which the composite analysis was made.In enhanced convection years,the intensified precipitation over the ocean east of the Philippines results in a negative stream function anomaly at 850 hPa,and triggers prominent wave activity flux propagating from the convective zone to the anticyclonic anomaly in the midlatitudes(Fig.8c).At 200 hPa,the anticyclonic anomaly in the midlatitudes is also remarkable,but shifts to the north slightly,indicating a barotropic anticyclone(Figs.8a and c),i.e.,a PJ pattern consistent with Huang and Li(1987) and Kosaka and Nakamura(2006).The CLW anomaly near the sea surface,capped with a positive PT anomaly,denotes greater sea fog occurrence,when the convection strengthens over the east of the Philippines(Fig.8e).In weakened convection years,anomalous atmospheric circulation is opposite compared with enhanced convection years(Figs.8b and d). A northerly wind anomaly and unstable atmospheric stratification are dominant in the MABL(Fig.8f),which are unfavorable for the formation of sea fog.All of these features are in agreement with the results from the reanalysis data and indicate that the model can simulate the PJ pattern and reflectits physical relations with sea fog in the fog-prone area.

Fig.8.Composited anomalies of(a)stream function and wave activity flux at 200 hPa,(c) stream function,wave activity flux at 850 hPa(blue arrows with blue scaling in the bottom right)and precipitation(green contours),(e)latitude-height section of potential temperature (contours;interval of 0.2 K),CLW(color scale),meridional wind(m s−1)and vertical velocity (−10−2hPa s−1)vectors,with black scaling in the bottom right in(d)and SST,averaged from 150◦E to 155◦E,in enhanced convection(high PJ index)years.The composited anomalies in weakened convection(low PJ index)years are shown in(b,d and f).The gray shading,precipitation contours and synthetic fields above show statistical significance at the 95%confidence level,based on the Student's t-test.
5.Possible trend of the PJ index and SFF under global warming conditions
Based on the relations between the SFF and PJ index discussed above,we projected the possible trend of the PJ index and SFF under global warming conditions using eight models under the RCP4.5 scenario.
The multi-model ensemble(MME)mean projection of the PJ index in the eight models reveals an obvious declining trend,statistically significant at the 99%confidence level, from the 2030s to the end of the 21st century(Fig.9).During the 2030s and 2050s,the frequency of the positive phase of the PJ index is higher than that of the negative phase.After 2060,the negative phase increases,implying weakened convection over the ocean east of the Philippines and thus lower SFF in the fog-prone area.The Student's t-test shows the difference in the PJ index between 2030-2050 and 2060-2100 exceeds the 99%confidence level.The shift is similar to the projection of the EAP index in the SRES A1B experiment in IPCC AR4 models(Huang and Qu,2009).Such a change in phase of the PJ pattern may decrease the SFF over the fog-prone area by the end of the 21st century,which is in agreement with our results.
6.Summary and discussion
The midlatitudes of the NWP is a highly foggy area,especially the ocean east of the Kuril Islands in July.In this study,we investigated the influences of the PJ pattern on sea fog over the fog-prone area in July and discussed the possible trend of the PJ pattern and the associated SFF under the conditions of global warming using eight models.
Composite analysis,a case study,and analysis based on GFDL-ESM2M showed that,in HI years,the convective activity over the east of the Philippines strengthens,which triggers a Rossby wave to propagate northward and the maintenance of an anticyclone anomaly in the midlatitudes.In the geopotential height field,the NPSH shifts northeastward,strengthening the southerly wind and moisture flux over the fog-prone area.Under the influence of the northern edge of the NPSH,the atmospheric stratification in the lower troposphere is relatively stable.The reinforced horizontal southerly winds enhance the warm advection in the lower atmosphere,resulting in a stronger inversion layer over the cold flank of the SST front and a stable air-sea interface,providing favorable atmospheric conditions for fog formation.Thegreater meridional SST gradient over the cold flank of the KE,which results from the warming in the KE due to ocean downwelling forced by the anticyclonic wind stress anomaly, is conducive to a cooling and condensing of the warm and humid air to form fog droplets,when air masses cross the SST front.InlowPJindexyears,theoppositesetofcircumstances exists,which is unfavorable for the formation of sea fog.

Fig.9.Normalized PJ index in eight models under the RCP4.5 scenario from 2006 to 2099.The black bold line and red trend line denote the MME mean and linear trend in the period 2037-99, respectively.
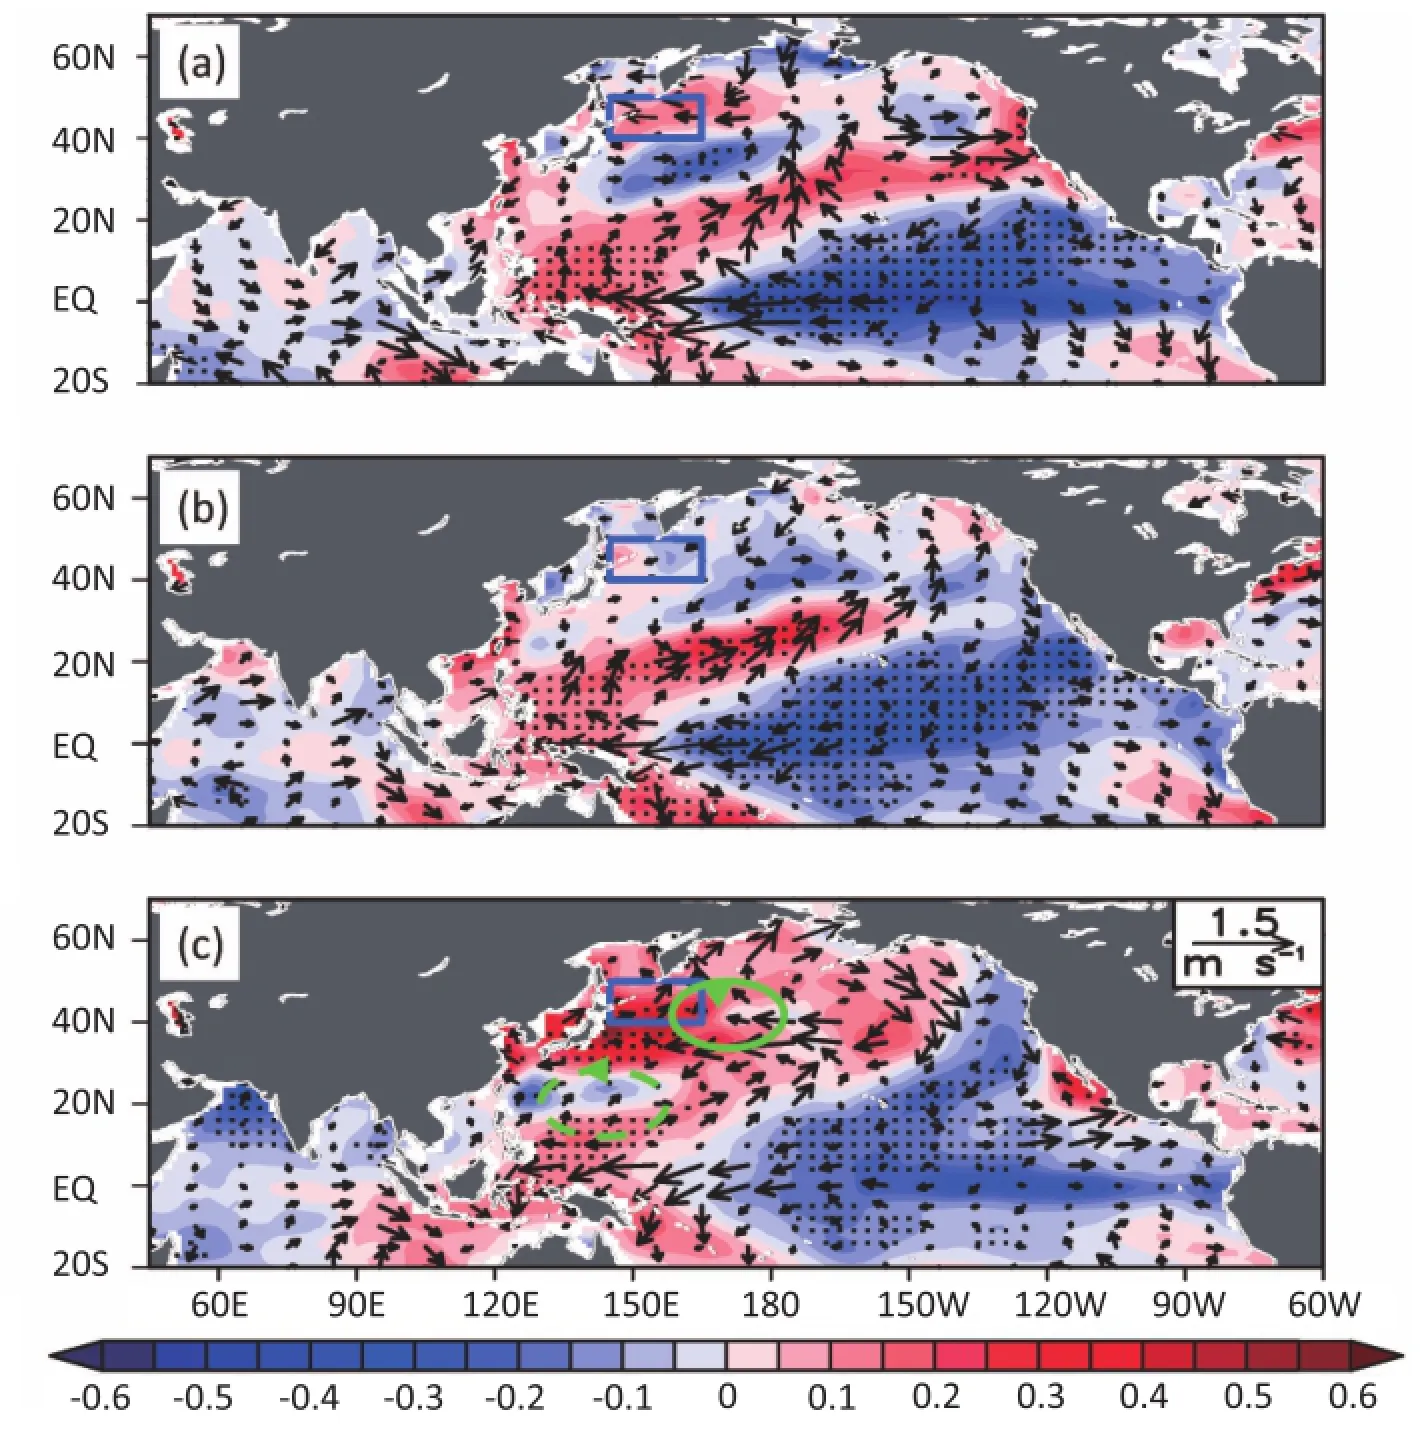
Fig.10.Regressions of the SST(color scale;◦C)and wind anomalies at 1000 hPa[vectors, with scaling in the top left in(c)]onto the SFF index from 1981 to 2005:(a)preceding winter (December-February);(b)spring(March-May);(c)summer(June-August).The dotted areas denote statistical significance at the greater than 90%confidence level.The green circles represent the cyclonic and anticyclonic surface circulation anomalies,and the rectangle is the same as in Fig.1.
Previous research suggests that the PJ wave train is associated with remote anomalous SST forcing(Xie et al.,2009; Kosaka and Nakamura,2010).The regressions of the SST and wind anomalies in the preceding winter onto the SFF index show that high SFF is more likely to occur in the subsequent summer of La Ni˜na-like events(Fig.10).The SST cooling in the tropical mid-eastern Pacific in La Ni˜na-like winters can result in the decreases in SST in the following spring-summer in the northern Indian Ocean through the“capacitor effect”,which triggers the positive phase of the PJ pattern,according to previous studies.Thus,the SFF might be projected by the phase of the PJ pattern as well as the changes in SST in the tropical mid-eastern Pacific.So,the projection of SST rising notably over the tropical eastern Pacific in the 21st century(Lu et al.,2008;Zhang et al.,2014a) also supports the possibility of a high frequency in the negative phase of the PJ index.It is worth noting that rainfall, associated with the cyclonic anomaly,may increase over the ocean east of the Kuril Islands,and there may be a decrease in atmospheric stability(corresponding to a negative PJ pattern) under global warming conditions,based on the“warmer-getwetter”theory(Xie et al.,2010),which is highly compatible with our results.
The present work focused mainly on the impact of the PJ pattern,with the signal coming from the tropical SST anomaly.A number of other influences were not considered in this study,such as the“Silk Road”pattern(Kosaka et al., 2009;Kosaka and Nakamura,2011),forcing by local SST, and intraseasonal variation in the PJ pattern,all of which may also play a role in the formation of sea fog.These aspects constitute the next step in our research.
Acknowledgements.The authors wish to thank Prof.Shang-Ping XIE for his constructive suggestions,and Dr.Yi LI,Wen-Xiu ZHONG,and Lei WANG for their helpful discussions.The authors arethankfulto thetwoanonymousreviewersfor theircomments and suggestions.The dataset was from the Earth System Grid Federation,CISL Research Data Archive.This work was supported by a“973”project(Grant No.2012CB955602)Natural Science Foundation of China and the Shandong Joint Fund for Marine Science Research Centers(Grant No.U1406401),and the NSFC(Grant No. 41175006),J.W.Liu was supported by the Fundamental Research Funds for the Central Universities.
REFERENCES
Carton,J.A.,and B.S.Giese,2008:A reanalysis of ocean climate using Simple Ocean Data Assimilation(SODA).Mon.Wea. Rev.,136,2999-3017.
Clement,A.C.,R.Burgman,and J.R.Norris,2009:Observational and model evidence for positive low-level cloud feedback.Science,325,460-464.
Dunne,J.P.,and Coauthors,2012:GFDL's ESM2 global coupled climate-carbon earth system models.Part I:physical formulation and baseline simulation characteristics.J.Climate,25, 6646-6665.
Fu,G.,and Y.J.Song.,2014:Climatology characteristics of sea fog frequency over the Northern Pacific.Periodical of Ocean University of China,44,35-41.(in Chinese)
Gao,S.H.,H.Lin,B.Shen,andG.Fu,2007:Aheavyseafogevent over the Yellow Sea in March 2005:Analysis and numerical modeling.Adv.Atmos.Sci.,24,65-81,doi:10.1007/s00376-007-0065-2.
Gao,S.H.,S.B.Zhang,Y.L.Qi,and G.Fu,2010:Initial conditions improvement of sea fog numerical modeling over the Yellow Sea by using cycling 3DVAR-Part II:RAMS numerical experiments.Periodical of Ocean University of China,40, 1-10,18.(in Chinese)
Hu,R.J.,and F.Zhou,1997:A numerical study on the effects on air sea conditions on the process of sea fog.Journal of Ocean University of China,27,282-290.(in Chinese)
Huang,G.,and X.Qu,2009:Meridional location of west pacific subtropical high in Summer in IPCC AR4 simulation.Transactions of Atmospheric Sciences,32,351-359.(in Chinese)
Huang,R.H.,1990:Studies on the teleconnections of the general circulation anomalies of East Asia causing the summer droughtandfloodinChinaandtheirphysicalmechanism.Scientia Atmospheric Sinica,14,108-117.(in Chinese)
Huang,R.H.,and W.J.Li,1987:Influence of the anomaly of heat source over the northwestern tropical Pacific for the subtropical high over East Asia.Proc.International Conf.on the General Circulation of East Asia,April 10-15,1987,Chengdu, China,40-45.
Klein,S.A.,and D.L.Hartmann,1993:The seasonal cycle of low stratiform clouds.J.Climate,6,1587-1606.
Koraˇcin,D.,J.Lewis,and W.T.Thompson,2001:Transition of stratus into fog along the California coast:observations and modeling.J.Atmos.Sci.,58,1714-1731.
Kosaka,Y.,and H.Nakamura,2006:Structure and dynamics of the summertime Pacific-Japan teleconnection pattern.Quart. J.Roy.Meteor.Soc.,132,2009-2030.
Kosaka,Y.,and H.Nakamura,2008:A comparative study on the dynamics of the Pacific-Japan(PJ)teleconnection pattern based on reanalysis datasets.SOLA,4,9-12.
Kosaka,Y.,and H.Nakamura,2010:Mechanisms of meridional teleconnection observed between a summer monsoon system and a subtropical anticyclone.Part II:A global survey.J.Climate,23,5109-5125.
Kosaka,Y.,and H.Nakamura,2011:Dominant mode of climate variability,intermodel diversity,and projected future changes over the summertime Western North Pacific simulated in the CMIP3 models.J.Climate,24,3935-3955.
Kosaka,Y.,H.Nakamura,M.Watanabe,and M.Kimoto,2009: Analysis on the dynamics of a wave-like teleconnection pattern along the summertime Asian jet based on a reanalysis dataset and climate model simulations.J.Meteor.Soc.Japan, 87,561-580.
Li,M.,and S.P.Zhang,2013:Impact of sea surface temperature front on stratus-sea fog over the Yellow and East China Seas-A case study with implications for climatology.Journal of Ocean University of China,12,301-311.
Lu,R.Y.,and R.H.Huang,1998:Influence of East Asia/Pacificteleconnection pattern on the interannual variations of the blocking highs over the Northeastern Asia in summer.Scientia Atmospheric Sinica,22,727-734.(in Chinese)
Lu,J.,C.Gang,and D.M.W.Frierson,2008:Response of the zonal mean atmospheric circulation to El Ni˜no versus global warming.J.Climate,21,5835-5851.
Nitta,T.,1987:Convective activities in the tropical Western Pacific and their impact on the northern Hemisphere summer circulation.J.Meteor.Soc.Japan,65,373-390.
Norris,J.R.,and C.B.Leovy,1994:Interannual variability in stratiform cloudiness and sea surface temperature.J.Climate, 7,1915-1925.
Saha,S.,and Coauthors,2010:The NCEP climate forecast system reanalysis.Bull.Amer.Meteor.Soc.,91,1015-1057.
Smith,T.M.,R.W.Reynolds,T.C.Peterson,and J.Lawrimore, 2008:Improvements to NOAAs historical merged land-ocean temp analysis(1880-2006).J.Climate,21,2283-2296.
Sugimoto,S.,T.Sato,and K.Nakamura,2013:Effects of synoptic-scale control on long-term declining trends of summer fog frequency over the pacific side of Hokkaido Island.J. Appl.Meteor.and Climatol.,52,2226-2242.
Takaya,K.,and H.Nakamura,2001:A formulation of a phaseindependent wave-activity flux for stationary and migratory quasi geostrophic eddies on a zonally varying basic flow.J. Atmos.Sci.,58,608-627.
TAMU Research Group,cited 2014:SODA 2.2.4.[Available online at http://sodaserver.tamu.edu/assim/SODA 2.2.4/]
Wang,B.H.,1983:Sea Fog.China Ocean Press,Beijing,352 pp. (in Chinese)
Wang,X.,F.Huang,and X.Zhou,2006:Climatic characteristics of sea fog formation of the Huanghai Sea in summer.Acta Oceanologica Sinica,28,26-34.(in Chinese)
Weaver,C.P.,and V.Ramanathan,1997:Relationships between large-scale vertical velocity,static stability,and cloud radiative forcing over Northern Hemisphere Extratropical Oceans. J.Climate,10,2871-2887.
Woodruff,S.D.,and Coauthors,2011:ICOADS Release 2.5:Extensions and enhancements to the surface marine meteorological archive.Int.J.Climatol.,31,951-967.
Xie,S.P.,K.M.Hu,Jan Hafner,H.Tokinaga,Y.Du,G.Huang, and T.Sampe,2009:Indian Ocean capacitor effect on indowestern Pacific climate during the summer following El Ni˜no. J.Climate,22,730-747.
Xie,S.P.,C.Deser,G.A.Vecchi,J.Ma,H.Y.Teng,and A.T. Wittenberg,2010:Global warming pattern formation:Sea surface temperature and rainfall.J.Climate,23,966-986.
Xue,Y.,T.M.Smith,and R.W.Reynolds,2003:Interdecadal changes of 30-Yr SST normals during 1871-2000.J.Climate, 16,1601-1612.
Zhang,S.P.,and X.W.Bao,2008:The main advances in sea fog research in China.Periodical of Ocean University of China, 38,359-366.(in Chinese)
Zhang,H.Y.,F.X.Zhou,and X.H.Zhang,2005:Interannual change of sea fog over the Yellow Sea in spring.Oceanologia et Limnologia Sinica,36,36-42.(in Chinese)
Zhang,S.P.,S.P.Xie,Q.Y.Liu,Y.Q.Yang,X.G.Wang,and Z. P.Ren,2009:Seasonal variations of yellow sea fog:Observations and mechanisms.J.Climate,22,6758-6772.
Zhang,S.P.,Y.Chen,J.C.Long,and G.Han,2014a:Interannual variability of sea fog frequency in the Northwestern Pacific in July.Atmos.Res.,151,189-199.
Zhang,S.P.,J.C.Long,Y.J.Yin,W.Y.Yang,and W.B.Yang, 2014b:Analysis of the process of a local sea fog lifted into low cloud in eastern China.Periodical of Ocean University of China,44,1-10.(in Chinese)
Long,J.,S.Zhang,Y.Chen,J.Liu,and G.Han,2016:Impact of the Pacific-Japan teleconnection pattern on July sea fog over the northwestern Pacific:Interannual variations and global warming effect.Adv.Atmos.Sci.,33(4),511-521,
10.1007/s00376-015-5097-4.
16 April 2015;revised 2 October 2015;accepted 20 October 2015)
∗Suping ZHANG
Email:zsping@ouc.edu.cn
杂志排行
Advances in Atmospheric Sciences的其它文章
- Indo-Western Pacific Ocean Capacitor and Coherent Climate Anomalies in Post-ENSO Summer:A Review
- Evaluating the Formation Mechanisms of the Equatorial Pacif c SST Warming Pattern in CMIP5 Models
- Role of Horizontal Density Advection in Seasonal Deepening of the Mixed Layer in the Subtropical Southeast Pacific
- Changes in Mixed Layer Depth and Spring Bloom in the Kuroshio Extension under Global Warming
- Historical Change and Future Scenarios of Sea Level Rise in Macau and Adjacent Waters
- The Positive Indian Ocean Dipole-like Response in the Tropical Indian Ocean to Global Warming
