Parametric study of turbine NGV blade lean and vortex design
2016-11-21ZhngShowenDvidMcMnusLuoJinqio
Zhng Showen,Dvid G.McMnus,Luo Jinqio
aDepartment of Turbine Design,China Aviation Powerplant Research Institute,AVIC,Zhuzhou 412002,China
bSchool of Aerospace,Transport and Manufacturing,Cran field University,Cran field,Bedfordshire MK430AL,UK
1.Introduction
Blade lean has been applied in turbine designs over the last 30 years and has been used for controlling the radial distribution of reaction of a turbine stage and for further improving turbine ef ficiency.1–4Although the potential bene fit from the application of blade lean has drawn much attention there isstill a lack of clarity on how blade lean affects row ef ficiency.This is partially related to the on-going uncertainty regarding loss mechanisms,the complexity of secondary flows and their sensitivity to the three-dimensional aspects of turbine nozzle guide vane design.A core aspect of this is that within the open literature there are con flicting results on the impact of blade lean1–6and it is these aspects which are parametrically considered in this work.The effects of blade lean on row ef ficiency have been previously examined1–4and broadly similar results have been observed for the radial distribution of losses.For example,with a straight lean con figuration the loss is reduced at the hub(or the high pressure end of a linear cascade)and is increased at tip(low pressure end).However,the effect of blade lean on overall vanes losses is less certain.Loss reduction for positive straight lean was found in the research of Walker1,D’Ippolito et al.2,and Gimenez3;however,opposite results were reported by Harrison4and Han.5Positive compound lean was found to bene fit the vane ef ficiency in the studies of Walker1,Gimenez3and Tan et al.6,while opposite characteristics were found in the results of Harrison4,Han5,Bagshaw et al.7and Rosic et al.8This con flict in the open literature is widely recognized,and the reason was considered as being due to the difference in the original con figurations where blade lean applied.9However,it is still unclear as to key differences in the original con figurations which cause different final results.An explanation much closer to the turbine aerodynamics still needs to be explored.
There are two different ways to explain the in fluence of blade lean on losses.The first explanation is related to the change in blade loading,10which can be reduced at the high pressure end and increased at the low pressure end.As a consequence,the wall friction losses are reduced at the high pressure end with the opposite effect at the low pressure end.The other explanation is related to the changes in the secondary flows.11By applying blade lean,the low momentum fluid in the endwall boundary layer at the high pressure end moves away from the endwall.This avoids the accumulation of low momentum fluid and hence reduces the losses.Conversely,at the low pressure end,losses are increased.These two explanations were discussed by Walker1,by whom the first explanation was supported.The subsequent researchers commonly examined both loading and secondary flow effects in their research as well as in some optimization work.2–4,8
To show the in fluence of blade lean it is usual to consider the radial distribution of row ef ficiency.The row ef ficiency is a mass-averaged value,which eliminates the mass- flow redistribution effects under blade lean.The overall row ef ficiency change is a combination of modi fications to the row ef ficiency distribution and the mass flow rate distribution.Hence,the mass- flow rate distribution is regarded as an additional factor to be studied.
In this current work,a parametric study using computational fluid dynamics(CFD)simulations on a series of turbine vane annular cascades is carried out.The base vane annular case is designed according to the design parameters of the first nozzle guide vane(NGV)of the energy ef ficient engine12which is selected to study the phenomenon in an environment closer to the engineering application.The matrix of con figurations of turbine cascade con figurations is constructed with different lean arrangements and different vane vortex designs applied to the base cascade.
The secondary flow structure for the base cascade is first analyzed and compared to the classical secondary flow structure.Losses are broken down to pro file loss,secondary loss,trailing edge loss and endwall friction loss to identify the fraction of overall loss which is caused by secondary loss.The vane ef ficiency and secondary kinetic energy for different con figurations are compared and subsequently the effects of the mass flow radialdistribution changesunderblade lean are considered.
In addition,the radial distribution of mass flow ratio is proposed as an additional aspect which needs to be considered in the use of in blade lean.The turbine vortex design is used in this paper together with blade lean to generate NGV geometries which provide similar radial distributions of row ef ficiency but produce different mass flow distributions.
2.Computational method
2.1.Numerical methods
The computational method is using the commercial code,ANSYS-CFX,which solves the Reynolds-averaged Navier–Stokes equations using a finite-volume,node-centered approach with high resolution schemes for convective fluxes and implicit time integration.The turbulence model isk–ω–SST and a steady state calculation is used,with the levels of residual iterative convergence less than 1×10⁻⁶.In addition,variations in the key integral parameters such as total pressure,vorticity and the domain exit varied by less than 10-6with iteration.
2.2.Datum con figuration
The geometry of the first NGV of the energy ef ficient engine12is used as the con figuration to undertake a mesh independence study and for CFD method validation.This NGV has an axial chord of 33.78 mm at mid-height and 46 blades around the annulus.The NGV height is 40 mm at the trailing edge(TE).It is designed for an axial inlet flow and at mid-height the NGV exit angle is 74.2°.The TE thickness is 0.965 mm and the uncovered turning is 8.4°at mid height.The solid vane rig test con figurations with a total-to-static pressure ratio is 1.66 and a measured vane ef ficiency of 0.9667(Eq.(2))is used as the validation case.The aerodynamic design point is for a mid-height exit Mach number of 0.878 with an NGV Reynolds number based on the throat dimension of 17600.
2.3.Mesh convergence study
Grid convergence index(GCI)was proposed by Roache13as a grid convergence criteria based on Richardson’s extrapolation.Apth order method using three grid values14is employed wherepis de fined as

fis the row ef ficiency changing with the grid spacingh,andFSis the safety factor,with a typical recommended value of 3.The subscripts 2 and 1 refer to the fine mesh and coarse meshes,respectively.The orderpand GCI can be calculated by three grids and results.
The computational domain is shown in Fig.1,which extends from 2 axial chords(c)upstream of the leading edge(LE)to 2.6 axial chords downstream of the trailing edge,denoted as stations 0 and 1,respectively.The row ef ficiency is calculated from the inlet to exit plane,which is 0.285c after the trailing edge and is denoted with a subscript exi.The axial position is denoted asx,andxTEis the axial position of trailing edge.The boundary conditions used are listed in Table 1.
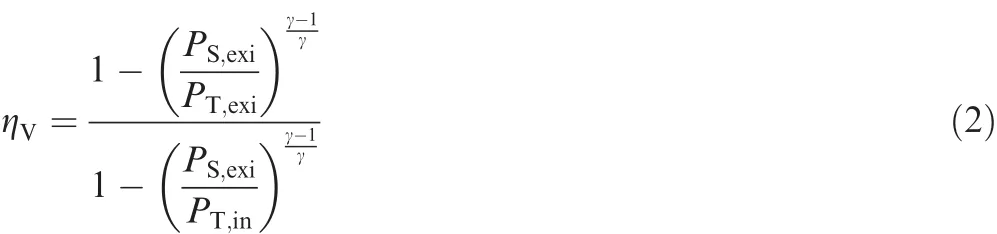
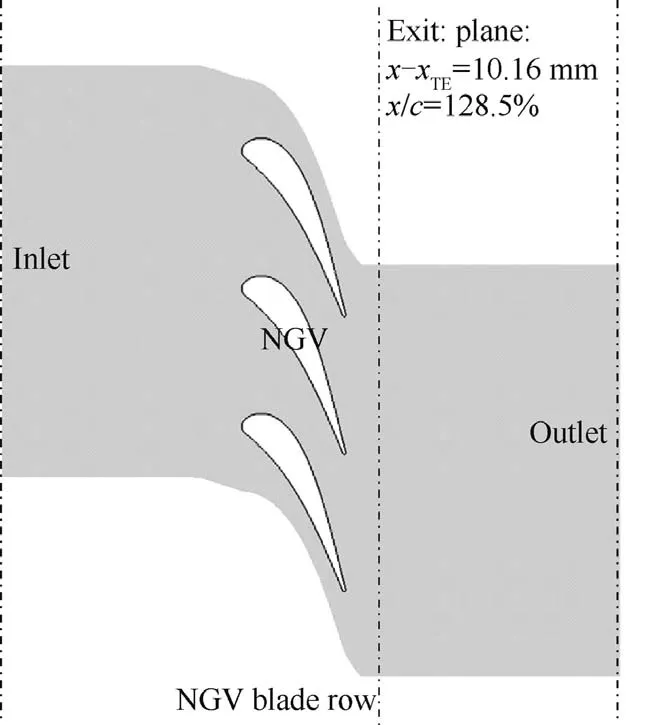
Fig.1 Axial stations and periodic boundary de finitions in NGV blade row.

Table 1 Boundary condition in NGV blade row calculation.
The de finition of row ef ficiency in this paper is where ηVis row ef ficiency,γ is the air speci fic heat ratio,andPSandPTare static pressure and total pressure,respectively.The subscript in and exi denote the inlet plane and exit plane de fined in Fig.1.
Thek–ω–SST turbulent model is used and under the no-slip wall conditions the boundary layer is resolved with ay+of approximately 1 throughout the domain as required to resolve the near wall region and to avoid the use of wall functions.The 3D mesh of the simulated region is shown in Fig.2.Three grids of the NGV with mesh nodes of 2.08 million,2.5 million and 3.0 million are used to calculate the GCI,and the results are listed in Table 2,from which both the fine grid(3.0 million nodes)and the coarse grid(2.08 million nodes)have a GCI of 0.07%and 0.03%,respectively.Hence,a mesh with around 2 million nodes in the NGV passage was selected for these studies.The error in vane ef ficiency due to mesh resolution is in the order of 10-4.In the following text,parametric study of NGVs will show that the variation in vane ef ficiency caused by geometry and design change is in the order of 10-3.
2.4.CFD validation

Fig.2 NGV 3D mesh.

Table 2 Grid convergence study parameters and results.
The validation of the CFD method considered the datum NGV design and operating conditions(Table 1).The results of the simulation were compared with the available experimental data which comprised radial distributions of vane ef ficiency and total temperature ratio,and the isentropic Mach number on the NGV surface.12The comparison between the predicted isentropic Mach number with the experimental data at hub,mean and tip are shown in Fig.3,whereRis the height of the section andHis the height of the blade.The differences between most of the measured points with the predicted value are less than 0.05,except one high Mach point on the suction side(SS)at mid-span and at the blade tip.The source of this difference is unclear.The measurements indicate that at midheight the local Mach number is just above sonic followed by a sub-sonic region.Although this could be a local sonic region and terminating shock,it would require a substantial acceleration of the flow from the point of good agreement just upstream atx/c=0.5.Given the good agreement at the surrounding location it may indicate that there is a large uncertainty at this measurement location.Indeed,it is worth noting that previous workers who have undertaken computational studies have also noted similar differences and postulated thatthedifferencewasdueto an experimental uncertainty.
Fig.4 compares the calculated and measured data of radial distributions of vane ef ficiency and temperature ratio,whereTT,inandTT,exiare total temperature at inlet and at exit plane,respectively.The difference between calculated and experimental radial distributions of vane ef ficiency is around-0.7%at mid-height,-1.0%at 20%span and+0.05%at 80%span.Compared with the experimental data,there is a great discrepancy at the upper part of the blade(>85%span)where the measured exit total temperature ratio is much lower than the average value.This was reported in the experiment as being caused by an erroneous leakage of relatively cool air on the test rig.At the NGV inner sections(<85%span)the measured temperature ratio is higher than 100%.This is because the measurements are normalized by the average inlet temperature which was lower than the peak value.Suf ficient information was not available to include these two aspects in the computational work which partially explains the differences.

Fig.3 Isentropic Mach number distributions.
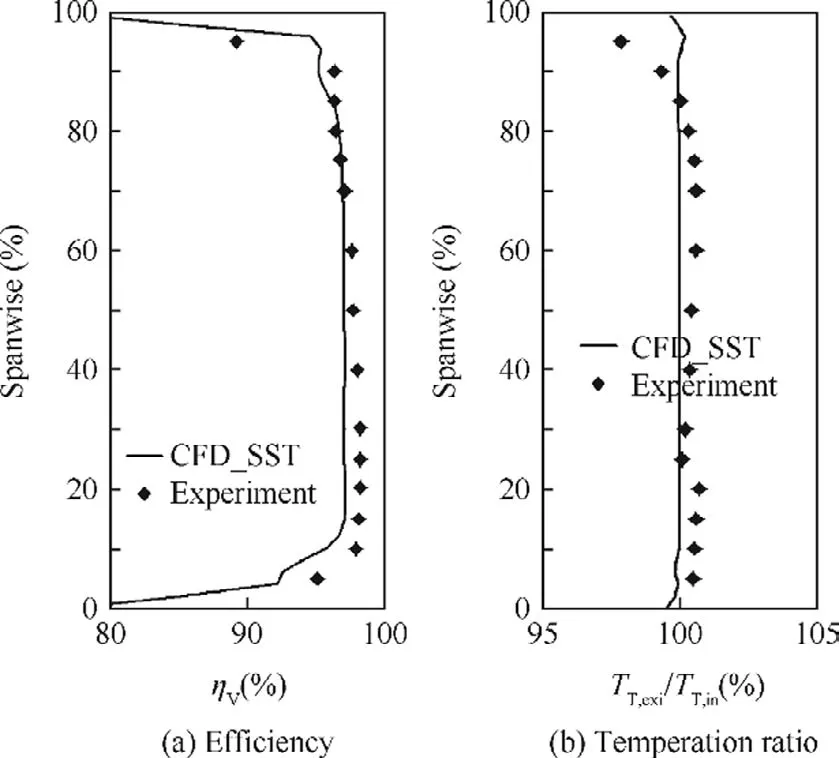
Fig.4 Radial distributions of ef ficiency and temperature ratio.
The validation suggests that the CFD method is generally able to predict the Mach number and temperature distributions to a reasonable level.The loss in turbine blade row is more dif ficult to calculate and the vane ef ficiency difference in this study is generally less than 1.0%.This is considered to be acceptable for the purpose of this comparison study.
3.Parametric designs
For this systematic parametric study a total of 17 NGV con figurations with different blade lean and vortex designs are constructed,which includethedatum NGV design.The parametric con figurations are based on the initial datum NGV which is redesigned applying the same design parameters with the NGV geometry used in CFD validation section.
The NGV hub,mean and tip sections are used as three design sections,on which the stream-surface airfoils are designed.An additional 18 sections are then interpolated as shown in Fig.5.The stream-surface airfoils are designed using Prichard 11-parameter method,with pressure side(PS)and suction side constructed by Bezier lines.The airfoil design method is illustrated in Fig.6.The datum NGV geometry uses a simple radial stack around the NGV trailing edge with no lean,and the design parameters are listed in Table 3.12The NGV exit angle is 75.4°at tip,74.2°at mid-height and 73.1°at the hub.The other 16 NGVs are constructed by applying different lean and vortex con figurations(Table 4).Positive lean angle(SPL)and negative lean angle(SNL)with 10°lean angle are applied to studying the effects of simple linear lean(Fig.7).Compound lean with negative local lean angle-10°(CNL)results in a radially concave pressure side(Fig.7)while the complimentary con figuration of compound positive lean angle-10°(CPL)has a radially convex NGV airfoil shape.The lean angles,-10°and 10°are selected based on the results which show that, firstly,these lean angles provide suf ficient geometry changes when applied to the datum design,and secondly,the geometry changes result in appropriate aerodynamic changes,including loading,secondary flow and mass- flow distribution changes.Along with the considerations of the NGV radial stacking,the effect of the vortex design is also employed as another measure to control the radial distributions of mass flow and local and overall ef ficiency.By redesigning the airfoil,a linear vortex change with a-2°reduction in hub vane exit angle(Fig.6)and an increased tip exit angle of 2°is denoted as vortex design A(VrA).The opposite change of+2°at the hub and-2°at the tip is denoted as vortex design B(VrB).A parabolic vortex change with an increase in the hub and tip vane exit angle by 2°and a reduced mean section vane exit angle of 1.5°is denoted as vortex design C(VrC).The inverse con figuration is denoted as vortex design D(VrD).The determination of the angle values in the vortex design is to meet the requirements that, firstly,the variation in aerodynamics,including loading,secondary flow and mass- flow distribution,caused by vortex changes should match those caused by the lean.Secondly,the mass- flow ratio needs to be kept constant when different vortexes are applied to the datum design.In the parabolic vortex(VrC and VrD),the angle change at mid span is smaller than those at the hub and tip due to the throat area is more sensitive with mid-span exit angle change than with those in the endwall regions.
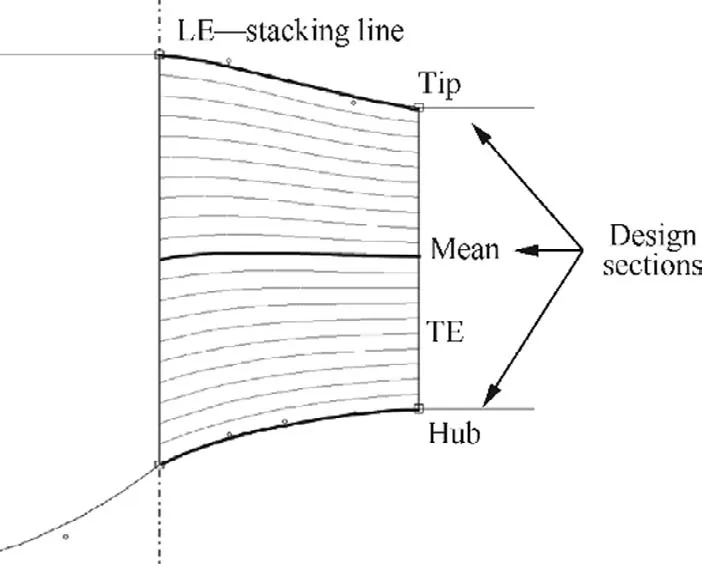
Fig.5 Blade design sections and stacking line.

Fig.6 Turbine blade pro file paramedic design.

Table 3 Design parameters of datum NGV sections.
Straight lean stack con figurations were combined with linear vortex designs and compound lean arrangements were combined with parabolic vortex designs to generate a set of relative changes in radial distributions of mass flow and NGV row ef ficiency.The 3D geometries are shown in Fig.7 and the construction methods are summarized in Table 4.
4.Results and discussion
4.1.Aerodynamics

Table 4 Summary of NGV con figurations.
A detailed analysis of the flow structure is important for understanding the flow features in the NGV passage to assess if the computations are capable of resolving the expected typical flow structures.As described in the literature on classical secondary flows,a turbine NGV passage includes leading edge horse-shoe vortex,passage vortex,corner vortex,wall vortex and trailing edge vortex.However,in this particular NGV,the overall NGV turning is modest(datum NGV mid-height turning=74.2°),the passage is highly converged with a mid-height velocity ratio of around 9 and consequently only the leading edge horse-shoe vortex and passage vortex are signi ficant.
Fig.8 shows the surface skin-friction lines at the hub and the shroud.Based on the topology of the flow,the local separation lines at the hub and shroud around the leading edge are identi fied and show that the distance between the lift-off line and the blade on the hub is much smaller than that on the shroud.This indicates that the inlet boundary layer thickness at the hub is thinner than that at the shroud as a result of the highly converging hub flow path.
To show the flow structures,the flow vorticity is considered as de fined in(Eq.(3)).15


Fig.7 NGV 3D geometries with different lean and vortex designs.

Fig.8 Surface stream line at hub(left)and shroud(right).
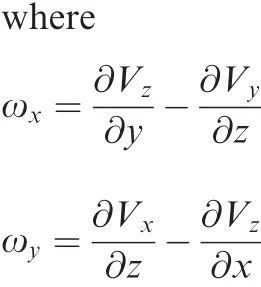

∇is vector rotation operator,ω is the vorticity,with three components,ωxωyωz,which are curls of velocity.Vx,VyandVzare velocity component in Cartesian coordinates.
Neglecting the radial flow,streamwise vorticity can then be used to identify vortical aspects relative to the local flow circumferential direction as de fined in(Eq.(4)).

wherexdirection is the axial direction and α is the mass flow averaged flow angle on the cross-section surface where the streamwise vortex is calculated.
The streamwise vorticity at a set of axial locations,that arex/c=0.0(leading edge),0.28,0.85 and 1.105,are shown in.Atx/c=0.0 chord,near the upper endwall the pressure side horse-shoe vortex(HVp)and suction side horse-shoe vortex(HVs)are shown as the positive and negative regions,respectively.The suction side leg is notably more intense then the pressure side leg.At the inner endwall similar vortices are evident;however they are smaller than that at the outer casing.This is due to the notable curvature of the hub path line which results in a strong acceleration and a reduction of the inlet boundary layer thickness.
Atx/c=0.28(Fig.9),the HVs at the casing gradually decays and moves away from the endwall under the in fluence of the new developed passage vortex(PVt).The HVp,however,is gradually strengthened by the migration of low momentum fluid driven by the pitchwise pressure gradient and moves to the mid-pitch position.The unaffected part of inlet boundary layer at the leading edge which is not rolled up into the HVp is also driven by the pitchwise pressure gradient and forms the other part of passage vortex.
In the tip region atx/c=0.85,the separation line has moved to the suction side(Fig.8),which means that the low momentum fluid in the endwall boundary layer before the separation line has been rolled into the passage vortex and the passage vortex develops in the suction endwall corner.The HVs migrates further away from the endwall and is further weakened.The other positive vorticity in this region is due to the over-turning of the newly developed endwall boundary layer from the core of the other passage vortex.
Near the NGV suction surface there are regions of streamwise vorticity,generated from the radial movement of the blade surface boundary layer driven by the radial pressure gradient.Since the suction surface boundary layer is much thicker,this vorticity is much stronger on the suction side and it is named as blade-surface vorticity on the suction side(BVs).
At the exit of the NGV trailing edge(x/c=1.015)the two separate cores of the passage vortices(PVt and PVh)are still clear.A region of signi ficant strong vorticity at the trailing edge becomes the dominant flow feature,which is caused by the blade surface boundary layer shed off from the trailing edge and is identi fied as the trailing edge shed vortex(TSV).
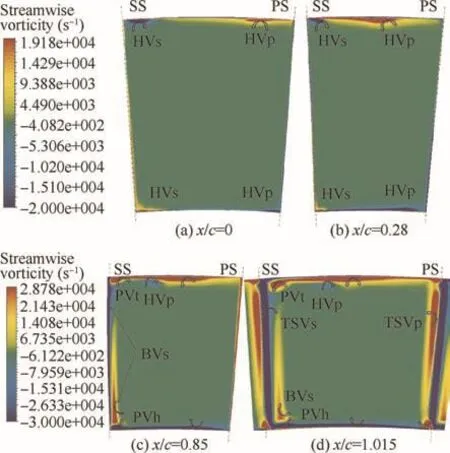
Fig.9 Streamwise vorticity distributions in datum NGV passage at a set of chordwise locations.
In summary,the typical secondary flow features of the horse-shoe vortex,passage vortex and trailing edge shed vorticity were observed.However,relative to previous work,16–18two small differences were found:the first one is two passage vortex cores observed at the tip region.This difference from the classical secondary flow structure is caused by the use of an axial in flow NGV cascade,instead of a cascade with inlet swirl used in experiment employed in secondary flow study.The axial in flow cascade does not have large pitchwise pressure gradients at the inlet region and hence the pitchwise movement of the newly developed endwall boundary layer after the separation line is relatively modest.Many classical secondary flow studies use high de flection blades which generate larger pitchwise pressure gradients within the passage.This drives the pressure side horseshoe vortex and the new boundary layer migrates rapidly to the passage suction side.The second difference from the classical secondary flow structure is the blade surface vortex.Typically the blade rows used in many experiments to get the secondary flow structure are radially stacked straight blade linear cascades to reduce the system complexity.However,this arrangement also eliminates the radial difference of static pressure.The initial NGV geometry in this work is not a straight blade and is also in an annular cascade,which generates a radial non-uniform static pressure field.Under this radial pressure gradient,the blade surface boundary layer,especially on the suction side,moves radially,which generates streamwise vorticity.
4.2.Loss breakdown
The distribution of mass flow-averaged entropy from inlet to outlet is calculated and compared in this section for the purpose of identifying the magnitude and locations of the loss.Four key cases are studied in this study according to the analysis of the design cases:these are the INI,CPL,VrC and CPL_VrC as de fined in Table 4.
The entropy generation in an uncooled subsonic turbine NGV passage is commonly classi fied as pro file loss(Sp),secondary loss(Ssec)and trailing edge loss(STE).9In this study,the simulated outlet region is relatively long compared with that in a stage environment.In the outlet region,the secondary flow,trailing edge blade boundary layer and wake continue to mix with main flow,which resulting large amount of losses generated from endwall friction after the trailing edge.The loss evaluation is made at the nominal mixing out plane,shown in Fig.10,where the trailing edge blade boundary layer,the wake and secondary flow are mixed out with the main flow.To simplify and make the loss break down clear,it is assumed that the secondary flows are mainly due to endwall boundary layers and that the NGV airfoils boundary layer does not make a signi ficant contribution to the secondary flows.Based on the assumption,the breakdown of the loss terms are de fined as follows:
Sppro file loss generated from the blade surface friction,from leading edge to trailing edge.
Ssec1secondary loss,due to secondary flow in passage from leading edge to trailing edge.
S4downstream loss due to downstream endwall friction and mixing of wakes,blade trailing edge boundary layers and secondary loss terms.
S5trailing edge loss generated from blade boundary layer at trailing edge and wake mixing from the trailing edge to the mixing out plane.
S6downstream endwall region loss due to endwall friction and secondary flow mixing,from trailing edge to mixing out plane.

Fig.10 Axial distributions of mass- flow-averaged entropy and entropy generation rate for datum NGV design(INI NGV).
Hence the entropy(Entropy1)at the outlet is expressed as

Fig.10 shows the axial distributions of mass flow averaged entropy and entropy generation rate(ds/dx)for the initial NGV design.The entropy is non-dimensionalized by the outlet entropy at the exit of the calculation domain(Fig.1),denoted as Entropy1,and labeled on the left hand vertical axis.The abscissa axis covers the calculation region from 2 axial chords before the leading edge to around 3.6 axial chords after the trailing edge.The leading edge is located atx/c=0,while the trailing edge is located atx/c=1.
Since secondary loss is caused by the inlet boundary layer and the passage endwall friction,to separate the secondary loss and pro file loss,two kinds of simulation were conducted as shown in Fig.10.The only difference between the two simulations lies in that the endwalls of one calculation are free-slip walls while the other calculation is performed using common no-slip wall boundary condition as described in Section 2.By setting the endwalls to a slip condition,the NGV endwall boundary layers are eliminated,the secondary endwall flow are eliminated and the entropy generated in the NGV passage is only the blade pro file entropy,which is shown as ‘Entropy slip endwalls”in Fig.10.Although this approach neglects interactions between the loss sources,it is a useful approach in identifying the first-order magnitude of the different loss sources.By subtracting the blade pro file entropy from the passage overall entropy,the secondary entropy,including passage endwallentropy and secondary flow entropy can be determined.
From the distributions of entropy between the slip-endwall calculation and no-slip endwall calculation,it is estimated that full mixing arises at aroundx/c=2.5 i.e.1.5 chords downstream of the trailing edge.The pro file entropy of the initial NGV is shown as ‘Sp’in Fig.10 which takes up around 39%of the total entropy generation.In comparison,the secondary entropy,denoted as ‘Ssec1’,takes approximately 8%of the total entropy.Downstream of blade trailing edge,the loss due to blade trailing edge boundary layer and wakes mixing,S5,is around 15%of the total loss.The last term of loss,S6,generated from downstream endwall friction and secondary flow mixing takes the rest part of the over loss,which is approximately 38%.
The summary of these losses are listed in Table 5.From this breakdown of the elements of the loss mechanisms for the datum NGV design the pro file loss and downstream mixing loss (S5+S6)are the main parts.Overall,the de fined secondary loss for this datum con figuration is 8%.
4.3.Effects of blade lean and vortex design on vane losses
NGV blade lean and vortex and their combinations in fluence the losses generation in NGV row through changing the loading distributions and secondary flows.Figs.11 and 12 illustrate the redistribution effects of different con figurations,including CPL,VrC and CPL_VrC.Compared with the datum design,the blade surface isentropic Mach number of CPL at the hub and tip is lower,on both the pressure side and the suction side,while it is higher at mid-span.The exit flow angle at mid-span is slightly increased while it is slightly decreased at the hub and tip regions.These changes in blade loadings of each section will hence change the blade surface friction and thus the losses.VrC plays a similar role as CPL whereby it reduces the suction side Mach number at the hub and tip and increases it at midspan.The main differences are the changes in pressure side Mach number which are relatively small,and the exit angle variation is comparatively large,which mean the loading change caused by VrC is much more signi ficant than that in CPL.CPL_VrC combined the effects of CPL and VrC,which enhances the Mach number changes and keeps the exit angle close to that of VrC,since CPL has a relatively small in fluence on exit flow angle.
Comparisons of axial entropy of the four different NGVs,including INI,CPL,VrC and CPL_VrC,are shown in Figs.13–15.Fig.13 shows the whole range of entropy distribution,which gives an overall view,but due to the large range presented,it is dif ficult to distinguish the difference between them.To solve this problem,two figures are given which adjust the axial and vertical range appropriately.Fig.14 mainly illustrates the entropy and entropy generation rate in the NGV passage,while Fig.15 focuses on the entropy increase downstream of the trailing edge.
Three axial positions are of particular interest,the NGV trailing edge(x/c=1),exit plane for ef ficiency calculation(x/c=1.285)as de fine in Section 2,and the outlet of the computational domain(x/c=3.6).The entropy values relative to the INI NGV at these positions of different con figurations are listed in Table 6.
In the four NGV con figurations,VrC generates the lowest entropy.In the NGV passage region,1.8%lower entropy is generated in comparison with the datum INI NGV,while at the outlet boundary a total of 3.3%lower entropy is generated.

Table 5 Summary of percentage of different entropy sources for the datum NGV design(INI NGV).

Fig.11 Comparison of blade surface isentropic Mach number distributions.
The reason is that due to the redistribution of the NGV mass flow where for the VrC con figuration,more fluid passes flow though the mid-span region.
The CPL generates 1.0%less entropy within the NGV passage relative to the INI NGV,but between the trailing edge and the mixing out region,the entropy generation rate is higher,which results in just a 0.3%reduction in entropy generated compared with the INI NGV.These aspects indicate that although CPL may reduce the NGV passage losses,the mixing process generates more losses which offset the bene fits.However,in most turbine stages,the NGV outlet flow will not fully mixed before flowing into the rotor passage.

Fig.12 Comparison of NGV exit flow angle radial distributions at exit plane.
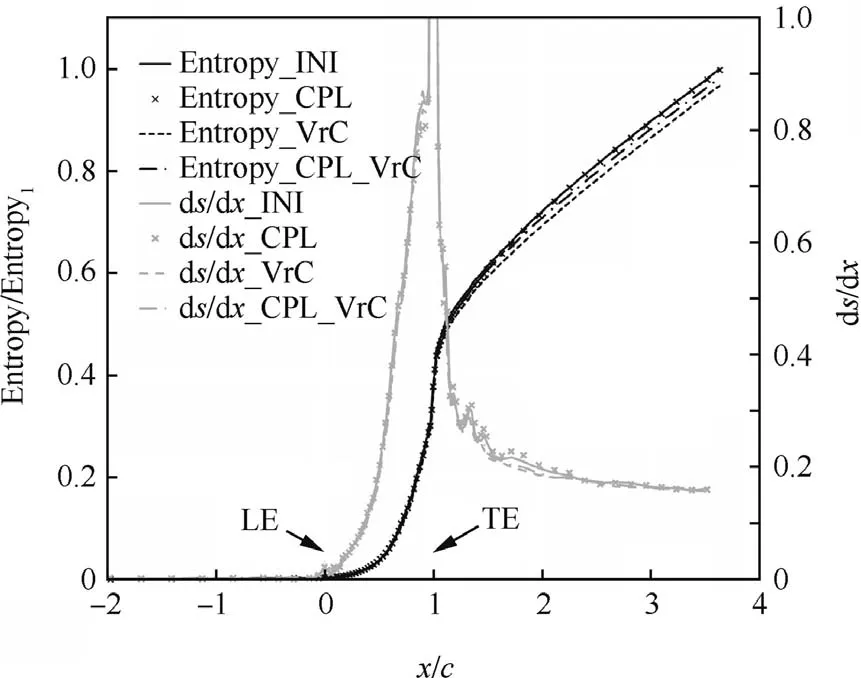
Fig.13 Comparison of axial distributions of entropy for different NGV con figurations.
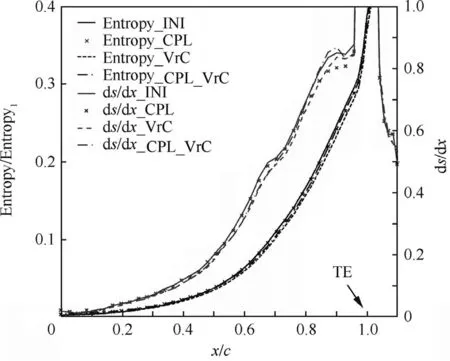
Fig.14 Comparison of axial distributions of entropy in NGV passages.

Fig.15 Comparison of axial distributions of entropy downstream of NGVs trailing edge.
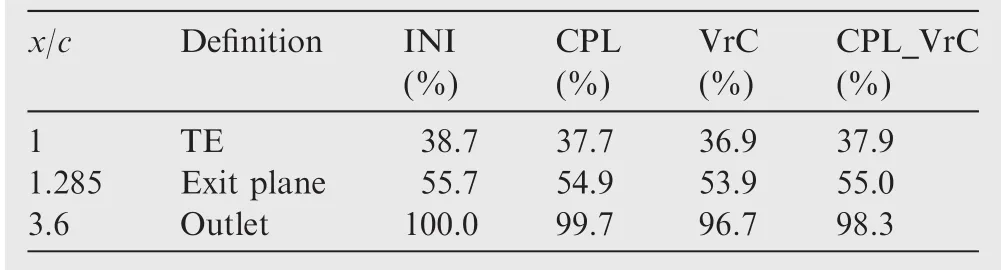
Table 6 Summary of percentage of entropy at TE,exit plane and outlet.
The con figuration CPL_VrC is an NGV which has compound positive lean and a modi fied exit vortex distribution(Table 4).These aspects in fluence the entropy generation so that within the NGV passage it broadly generates the same amount of entropy as the comparable CPL NGV con figuration.However at the outlet of the domain 1.7%less entropy is generated.These differences in entropy distributions are quite complex but indicate that the passage loss is relatively insensitive to the vortex distribution which has more in fluence on the downstream mixing loss.This is perhaps not surprising given the relatively benign passage secondary flows.
4.4.Relationship between secondary kinetic energy and row ef ficiency
Blade lean and vortex design not only in fluence the NGV ef ficiency as the secondary flows and non-uniformity of the exit flow field will be modi fied and can affect the downstream rotor blade row.To take some of these aspects into account,the NGV row ef ficiency and the secondary kinetic energy(SKE)are analyzed together.Secondary kinetic energy is the difference of fluid kinetic energy at a particular location compared with that in ideal flow without secondary flow.According to Benner et al.,19secondary kinetic energy can be de fined as that in(Eq.(6)).

where ρ is fluid density,vsecis the pitchwise secondary kinetic velocity,wsecthe radial secondary kinetic velocity,which is equal to the redial flow velocity,w.uandvis axial and circumferential velocity components,respectively. α′2′is the exit circumferential flow angle at the position where secondary velocity is calculated.To get the pitchwise secondary velocity(vsec),a reference exit flow angle,α′2′is required.In the de finition of Benner et al.,19mass flow averaged exit flow angle on the outlet plane is used.The advantage of this de finition is that it is relatively easy to apply.However,the main shortcoming is that,when the vane or blade becomes twisted,the radial distribution of exit angle varies with vortex design which is then not a sole function of the secondary flows.This additional exit angle distribution change will result in uncertainties in the secondary kinetic energy calculation.Germain et al.,20discussed three alternative secondary kinetic energy de finitions,including reference to radial,pitchwise and axial averaged exit flow angle.The difference in the result is also considered here and each averaging method shows some degree of difference compared with others.
One way to calculate the secondary kinetic energy is using the exit flow angle of an inviscid flow at the same boundary condition.In this work,the inviscid flow result is employed as the reference value for the secondary kinetic energy evaluation,because blade lean and different vane vortex design need to be studied,both of which will cause a change in the radial distribution of flow angle.Considering the characteristics of the solver,the inviscid simulation result is obtained by setting all the solid boundaries as free slip walls with the same ideal gas and other boundary conditions.This means that the boundary layer development on the solid walls is eliminated,and hence,the secondary flow which caused pitchwise and radial movement of the fluid in the boundary layer is eliminated.
The ef ficiency and SKE of all the NGV con figurations are listed in Figs.16,17 and Table 7.From these results,three configurations are of most interest:CPL,VrC and the CPL_VrC.Con figuration CPL provides minimum SKE in all the con figurations and a moderate row ef ficiency increase.In comparison,the con figuration with just a change in vortex distribution(VrC)is the one with the highest ef ficiency but has the penalty of a higher SKE compared with the initial design.The mixed con figuration with positive compound lean and the modi fied exit vortex(CPL_VrC)has medium ef ficiency and SKE among them.
Figs.16 and 17,clearly illustrate that there is not a simple relationship between the vane ef ficiency and the secondary kinetic energy,which means that the strength of the endwall secondary flow may not be a dominant factor in determining the vane ef ficiency.This of course needs to be considered with the speci fics of this con figuration of a typical HP NGV,where the secondary flows are a modest contributor to overall row ef ficiency.
It can also indicate that the conventional two explanations on blade lean effects on row losses may need to be re-examined.The way of using changes to the NGV loading distributions to explain blade lean effects should be emphasized.
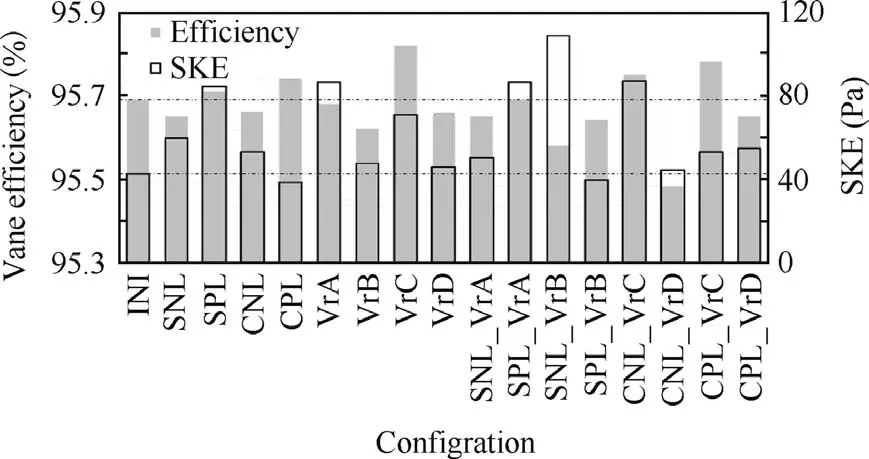
Fig.16 Vane ef ficiency and SKE of all NGV con figurations studied.

Fig.17 Relation between vane ef ficiency and SKE.
4.5.Radial mass flow redistribution effects
NGV lean and vortex choice can signi ficantly in fluence the radial distribution of blade loading and mass flow.Speci fic attention has been paid to the redistribution effects of mass flow ratio in this work.Looking into the whole research matrix of con figurations,the arrangement CPL_VrC and CNL_VrD provide a useful comparison.These con figurations provide two results with similar distributions of ef ficiency radial(around 1%difference at mid-span),but the radial mass flow changes are quite signi ficant and with opposite characteristics(Fig.20).
The effects of CPL_VrC on blade loading have been discussed in Section 4.3.CNL_VrD studied in this sections is the opposite con figuration with CPL_VrC.Fig.18 shows that the loading is increased in CNL_VrD at the hub and tip compared with the datum design,while it decreases at mid-span.The blade exit angle shown in Fig.19 illustrates that with the CNL_VrD,the mid-span exit flow angle is increased and the exit angle at the endwalls is decreased.Both loading and exit flow angle are changed oppositely by CPL_VrC and CNL-VrD,as expected.
The effects of blade loading redistribution lead to changes in radial distributions of mass- flow averaged row ef ficiency(Fig.20).However,the overall amount of loss generated in NGV row is also affected by the mass- flow distributions.For convenience the region from 20%span to 80%span is considered as the bulk flow area and the flow outside this region is considered as the endwall flow.From Figs.20 and 21,it is shown that for the CPL_VrC con figuration,the mass flow is pushed towards the central bulk flow region by 2.59%and the local ef ficiency increases by 0.1%.Conversely,by applying CNL_VrD,the mass flow is pushed towards the endwall regions by 2.58%,and the local row ef ficiency reduces by 0.21%.
Summarizing the above simulation on CPL,VrC and CPL_VrC,a comprehensive understanding on these con figurations can be considered as follows.Vortex con figuration,VrC,shows favorite characteristics,which reduces the mid-span loading,and increases the mass- flow rate at the highef ficiency mid-span region.This combination leads to the highest row ef ficiency of all the con figurations analyzed.However,VrC generates around 66.4%higher secondary kinetic energy than the initial design,which means more un-uniform condition for the downstream rotor row.CPL reduces the blade loading at the endwalls and thus reduces the endwall region losses.However,themass- flow isalso pushed to this low-ef ficiency region.A favorable change from CPL is the reduction in secondary kinetic energy by approximately 9.3%compared with the datum con figuration.The combination of the above two con figurations,CPL_VrC,also combines the effects on loading and mass- flow rate.In this con figuration,the loading changes,and thus losses,are relatively small.The dominant factor is the moving of mass- flow to the high ef ficiency mid-span region.It is recommended that these configurations need to be studied in stage environments,where the uniformity of NGV exit flow field will be evaluated by studying rotor aerodynamics and stage ef ficiencies.
These effects may help to further explain why the effects of blade lean is not that obvious.Usually,the central bulk flow region generates less loss within the passage and the endwall regions are relatively important regions of loss generation.Positive lean can reduce the mass flow-averaged loss near thehigh pressure(inner)endwall.However,accompanied with this the mass flow is also increased at the endwall regions,which will offset some of the bene fits.The overall effects depend on the relative changes between the radial distribution of mass flow ratio and mass flow-averaged radial distribution of row ef ficiency.Of course this local sectional row ef ficiency is strongly affected by the initial design as considerations such as the NGV aspect ratio,loading,loading distribution,Reynolds number,and initial vortex design.
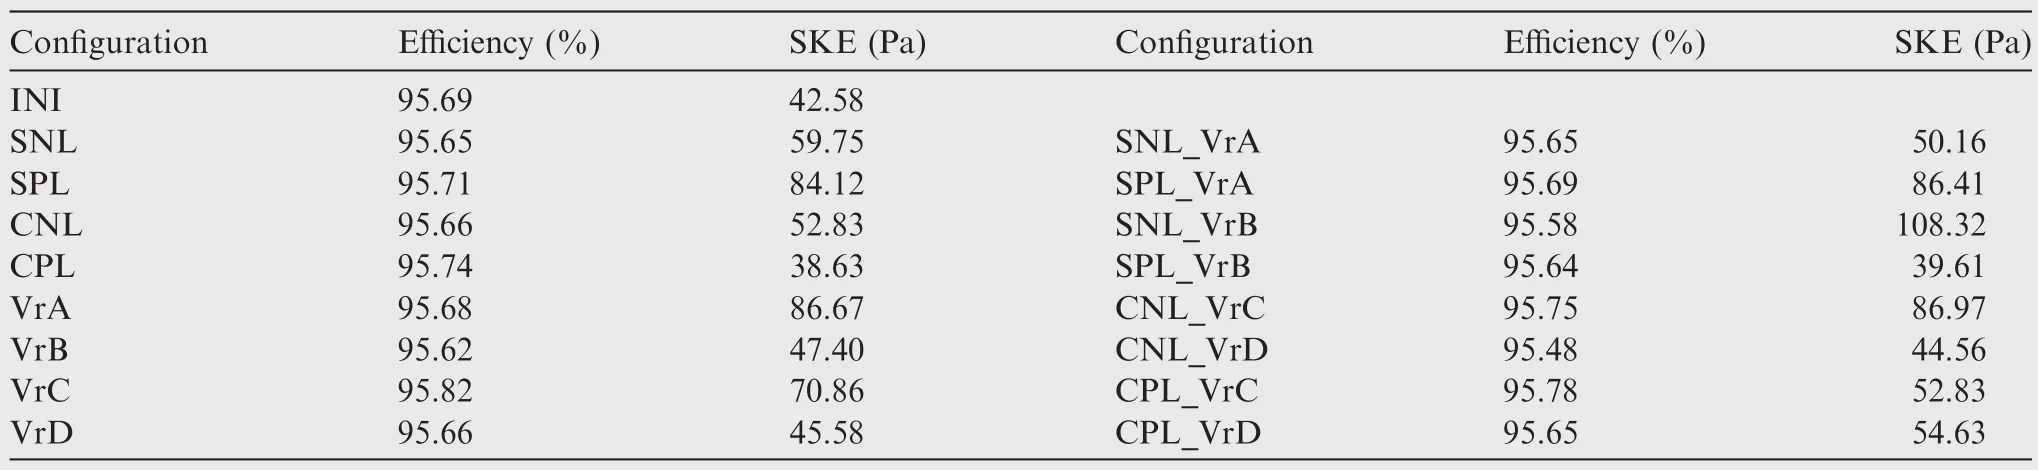
Table 7 Summary of row ef ficiency and SKE of NGVs.
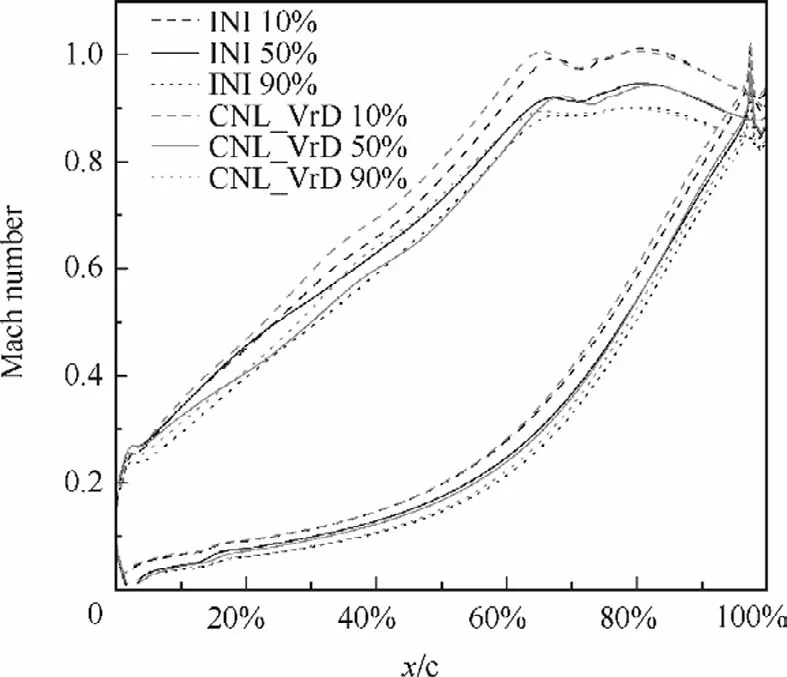
Fig.18 NGV surface isentropic Mach number distribution.

Fig.19 Radial distributions of exit flow angle at exit plane.

Fig.20 Radial distribution of vane ef ficiency and non-dimensional mass flow.
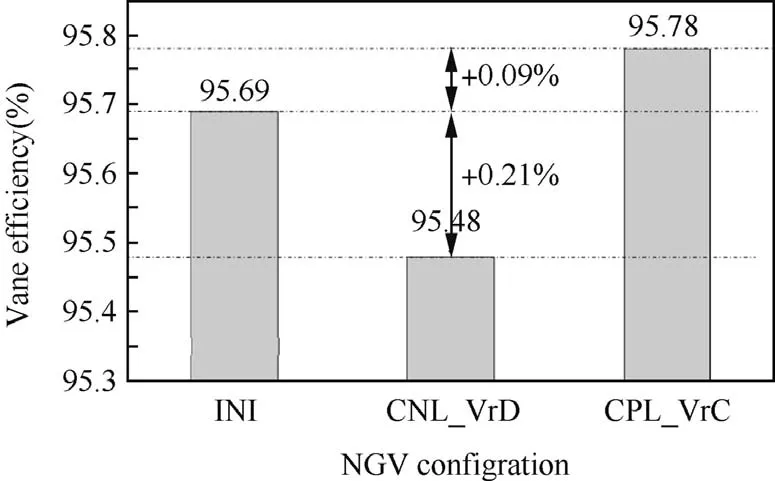
Fig.21 Ef ficiency change in different con figurations.
5.Conclusions
This work presents additional explanations to the effects of blade lean on turbine annular cascade losses.Blade lean and vortex design are employed as two measures to control the radial distribution of row ef ficiency and mass flow rate.The initial datum NGV and 16 NGV con figurations constructed by applying different lean and vortex design are analyzed.The key results are summarized as follows:
(1)Two passage vortex cores were found in the NGV endwall region,which is different from the classical secondary flow structure.The reason is that,the NGV studied in the article is for a HP NGV,with low de flection and low pitchwise pressure gradient,especially at the front sections of the NGV.Under a relatively low pressure gradient,the low momentum fluid in the endwall boundary layer after the separation line does not migrate suf ficiently in the pitchwise direction and form the second passage vortex.
(2)Losses directly generated from secondary flow take a small fraction for this style of NGV.Secondary entropy generation in passage accounts for 8%of the total entropy,which indicates that secondary flow control method may not get signi ficant loss reduction in this kind of turbine cascade.
(3)NGV row ef ficiency and secondary kinetic energy do not have a simple relationship,which means the secondary flow strength is not a dominate factor that determines the losses for this class of NGV.Hence,the loading distribution change when blade lean is applied should be regarded as the main factor in fluencing the NGV losses.
(4)Radial distribution of mass flow ratio is an additional element that in fluences row ef ficiency when blade lean is applied.Mass- flow averaged row ef ficiency was used as a main method to show blade lean effects on loss distributions in most previous studies which eliminate the mass flow redistribution effect.The overall effects depend on the relative changes between the radial distribution of mass flow ratio and mass flow-averaged ef ficiency,which can be determined by the initial design features.
This study is under the support of Cran field University and China Aviation Powerplant Research Institute of AVIC.
1.Walker P.Blade lean in axial turbines:model turbine measurements and simulation by a novel numerical method[dissertion].Cambridge:University of Cambridge;1987.
2.D’Ippolito G,Dossena V,Mora A.The in fluence of blade lean on straight and annular turbine cascade flow field.J Turbomach2011;133(1):011013.
3.Gimenez J.Three-dimensional NGV aerodynamics[dissertion].Bedfordshire:Cran field University;2011.
4.Harrison S.In fluence of blade lean on turbine losses.J Turbomach1992;114(1):184–90.
5.Han WJ,Tan CQ,Shi H,Zhou MC,Wang ZQ.Effects of leaning and curving of blades with high turning angles on the aerodynamic characteristics of turbine rectangular cascades.J Turbomach1994;116(3):417–23.
6.Tan CQ,Yamamoto A,Mizuki S,Chen HS.In fluences of blade bowing on flow fields of turbine stator cascades.AIAA J2003;41(10):1967–72.
7.Bagshaw D,Ingram G,Gregory-Smith D,Stokes M.An experimental study of reverse compound lean in a linear turbine cascade.Proc Inst Mech Eng,Part A:J Power Energy2005;219(6):443–9.
8.Rosic B,Xu LP.Blade lean and shroud leakage flows in low aspect ratio turbines.J Turbomach2008;134(3):1167–78.
9.Taylor M.HP axial flow turbine aerodynamic design.von Karman Institute for Fluid Dynamics Lecture Series;2007.p.1–22.
10.Houmouziadis J,Hubner N.3-D design of turbine airfoils.ASME 1985 International Gas Turbine Conference and Exhibit,1985 March 18–21.Houston,Texas;1985.p.1–7.
11.Wang ZC.Aerodynamic calculation of turbine stages with curvilinear blades and some experimental results.In:5th international symposium on air breathing engines.Bangalore,India;1981.
12.Timko L.Energy ef ficient engine:high pressure turbine component test performance report.Washington D.C.:NASA;1984.Contractor Report 168289.
13.Roache P.Veri fication and validation in computational science and engineering.Albuquerque,NM:Hermosa;1998.
14.Roy C.Grid convergence error analysis for mixed-order numerical schemes.AIAA J2003;41(4):595–604.
15.Schlichting H.Boundary-layer theory.Karlsruhe:Pergamon Press;1955.
16.Sieverding CH.Recent progress in the understanding of basic aspects of secondary flows in turbine blade passages.J Eng Gas Turbines Power1985;107(2),248-157.
17.Langston LS.Secondary flows in axial turbines–A review.Ann New Youk Acad Sci2001;934:11–26.
18.Wang HP,Olson SJ,Goldstein RJ,Eckert ERG.Flow visualization in a linear turbine cascade of high performance turbine blades.J Turbomach1997;119(1):1–8.
19.Benner M,Sjolander S,Moustapha S.The in fluence of leadingedge geometry on secondary losses in a turbine cascade at the design incidence.In:ASME Turbo Expo 2003,collocated with the 2003 International Joint Power Generation Conference,2003 June 16–19.Atlanta,Georgia;2003.p.147–61.
20.Germain T,Nagel M,Baier R.Visualisation and quanti fication of secondary flows:Application to turbine bladings with 3D-endwalls.In:Proceedings of the 8th international symposium on experimental and computational aerothermodynamics of internal flows;2007.p.1–10.
杂志排行

CHINESE JOURNAL OF AERONAUTICS的其它文章
- Plastic wrinkling prediction in thin-walled part forming process:A review
- Progress of continuously rotating detonation engines
- Microstructure control techniques in primary hot working of titanium alloy bars:A review
- A hybrid original approach for prediction of the aerodynamic coefficients of an ATR-42 scaled wing model
- Dynamic modeling and analysis of vortex filament motion using a novel curve- fitting method
- Boundary-layer transition prediction using a simpli fied correlation-based model