Verification and Correction of Cloud Base and Top Height Retrievals from Ka–band Cloud Radar in Boseong,Korea
2016-08-12SuBinOHYeonHeeKIMKiHoonKIMChunHoCHOandEunhaLIM
Su-Bin OH,Yeon-Hee KIM,Ki-Hoon KIM,Chun-Ho CHO,and Eunha LIM
1NumericalData Application Division,National Institute ofMeteorological Sciences,KMA,Republic ofKorea
2Applied Meteorology Research Division,National Institute ofMeteorologicalSciences,KMA,Republic ofKorea
3Observation Research Division,National Institute ofMeteorological Sciences,KMA,Republic ofKorea
4National Institute ofMeteorological Sciences,KMA,Republic ofKorea
Verification and Correction of Cloud Base and Top Height Retrievals from Ka–band Cloud Radar in Boseong,Korea
Su-Bin OH∗1,Yeon-Hee KIM2,Ki-Hoon KIM3,Chun-Ho CHO4,and Eunha LIM3
1NumericalData Application Division,National Institute ofMeteorological Sciences,KMA,Republic ofKorea
2Applied Meteorology Research Division,National Institute ofMeteorologicalSciences,KMA,Republic ofKorea
3Observation Research Division,National Institute ofMeteorological Sciences,KMA,Republic ofKorea
4National Institute ofMeteorological Sciences,KMA,Republic ofKorea
In this study,cloud base height(CBH)and cloud top height(CTH)observed by the Ka-band(33.44GHz)cloud radar at the Boseong National Center for Intensive Observation of SevereWeather during fall2013(September–November)were verified and corrected.For comparative verification,CBH and CTH were obtained using a ceilometer(CL51)and the Communication,Ocean and Meteorological Satellite(COMS).During rainfall,the CBH and CTH observed by the cloud radar were lower than observed by the ceilometer and COMS because of signal attenuation due to raindrops,and this difference increased w ith rainfall intensity.During dry periods,however,the CBH and CTH observed by the cloud radar,ceilometer, and COMSwere sim ilar.Thin and low-density cloudswere observedmore effectively by the cloud radar compared w ith the ceilometerand COMS.In casesof rainfallorm issing cloud radar data,the ceilometerand COMSdatawere proven effective in correcting or compensating the cloud radar data.These corrected cloud data were used to classify cloud types,which revealed that low cloudsoccurredmost frequently.
cloud radar,ceilometer,satellite retrieval,cloud baseheight,cloud top height,cloud type
1. Introduction
Clouds are important in influencing the energy balance, weather,and climate because they absorb and reflect radiantenergy from the Sun and Earth’s surface.By identifying the mechanisms of cloud formation and development,and obtaining information onmeteorological phenomena in advance,theability to predicthigh-impactweathereventscould be improved significantly.Understanding them icrophysical processes of cloudshas particular importance for the prediction of the development of precipitation and the estimation of its amount.For these purposes,quantitative and detailed observations of clouds are necessary,but the spatial characteristicsof clouds imposemany constraintson obtaining such data.
Many studies have observed clouds using diverse equipment.In the case of satellites and ceilometers,the upper and lower boundaries of clouds are detected,which makes it difficult to identify their internal characteristics and to collect three-dimensional cloud data(Zhong et al.,2011). The method of obtaining measurements of meteorological parameters and cloud-particle shapes by direct sampling of cloudsusing aircraftprovides reliabledataon them icrophysical processes and thermodynam ic structure of clouds,but it is costly and only provides instantaneous data(Aydin and Singh,2004;Yum et al.,2004).Therefore,the observation of cloudsusing a radar system ismoreeffective in obtaining three-dimensionaland continuous data on atmospheric particles.Generally,rainfall radars are designed specifically for observationsof precipitation particlesand thus,they are limited formeasuring cloud particles thatare relatively smaller (Sakuraietal.,2012).
To detect smaller hydrometeors,cloud radars may be used.Since these radarsuseshorterwavelengths than precipitation radars,they are referred to as short-wavelengthmillimeterwave radar.Rayleigh scattering occurswhen the particle size is significantly smaller than the wavelength and scattering strength is proportional to the biquadrate of the wave.As a result,cloud radars have high sensitivities for cloud size hydrometeors(Moran et al.,1998,Kollias et al., 2007a).They typically havehigh spatial resolution due to thenarrow beam w idth and smallsidelobes.
Previous studiesusing cloud radar data include analyses of themechanismsof cloud formation and developmentprior to the development of precipitation phenomena(Kobayashi et al.,2011;Sakurai et al.,2012),and cloud climatology based on long-term data(Kolliasetal.,2007b).Furthermore, research has been conducted to improve numerical model predictions by verifying and improving cloud radar data or through parameterization and data assimilation(Mace etal., 1998;Hogan and Illingworth,2000;Ahlgrimm and Forbes, 2014).Moreover,other studies have considered them icrophysical characteristics of clouds such as the liquid water content and size distribution of rain droplets(O’Connor et al.,2005;Zhong et al.,2012)and the classification of ice crystal forms in clouds(Aydin and Singh,2004).Such studiesusing cloud radarhavebeen conductedw idely throughout theworld and a network hasbeen formed through the Atmospheric RadiationMeasurement(ARM)program(Stokesand Schwartz,1994).In the ARMprogram,non-precipitationand weakly precipitating clouds have been observed since 1996 using a vertically pointing Ka-band millimeter-wave cloud radar(Moran etal.,1998)and aW-band ARMcloud radar (W idener and Mead,2004).Xietal.(2010)obtained cloud fraction data using m illimeter-wave cloud radar(MMCR), lightdetection and ranging(LiDAR)and ceilometerdataobserved at the North Slope of Alaska ARMsite for 10 years from 1998 to 2008 and observed their influence on radiative forcing.In Europe,the Cloudnetprogram hasutilized observations by ground-based remote sensing instruments(cloud radar,ceilometer,andmicrowave radiometer)to study clouds forabout15 years(Illingworth etal.,2007).
The National Institute ofMeteorological Sciencesof Korea installed a Ka-band cloud radar system at the National Center for Intensive Observation of SevereWeather(NCIO) at Boseong in April 2013.It is expected thatanalysis of the m icrophysical characteristics of clouds based on the cloud radardataw illpromoteunderstanding of cloud processesand improvenumericalmodelpredictions.However,before such research can be performed,verification and quality controlof the cloud radar datamustbe completed.
The resultsof comparative analysesof reflectivity,liquid water content,and cloud height,obtained in previousstudies from cloud radar and other instruments(e.g.,satellites,Li-DAR,andm icro rain radar),have shown thathighly diverse and good quality datacanbeobtained by linkingand combiningmultiple sources(Syrettetal.,1995;Hollarsetal.,2004; O’Connoretal.,2005;Kneifeletal.,2011).
In particular,cloud base height(CBH)and cloud top height(CTH)are importantparameters in the formation and development processes of clouds,and it is therefore necessary to compare these data to check whether cloud radars are effective in detecting cloud boundaries.Clothiaux et al. (2000)objectively determined thehydrometeorheightdistribution using active remote sensing at the Cloud and Radiation Testbed ARMsite in Oklahomaand at the TropicalWest Pacific site in Darw in,Australia.Cloud boundaries were determined from the returned radar signal using the cloud mask algorithm by Clothiaux et al.(1995).A LiDAR and ceilometerwereutilized to detectoptically thin cloudsand to aid w ith clutter removal.To evaluate the accuracy of ARMMMCR and GMS-5 satellite data over Manus Island,Hollars etal.(2004)compared the cloud top heights calculated from each piece of equipmentaccording to the typeof cloud and precipitation.Oh etal.(2014)performed a comparative analysis of CTHs observed by cloud radar and sensors onboard theCommunication,Ocean,and MeteorologicalSatellite(COMS).They established thatcloud radarwasuseful in detecting the CTH in the absence of precipitation.However, during periods of rainfall,the CTHs obtained by the cloud radar tended to be lower than reality and thus,the expectationwasthatthe radar-derived CTHscould becorrected using COMS data.However,because thatstudy focused solely on the upper boundary of the cloud and analyzed only one case, itwasdetermined thatadditionalanalyseswere required.
Thisstudywasconducted to verify and correctCBHsand CTHs obtained by the cloud radar at Boseong NCIO in the fall(September–November)of 2013.For comparative verification,CBHsand CTHsobserved by aceilometerand COMS were used,and the effectivenessof the cloud radar datawas exam ined by consideration of theoccurrenceofprecipitation, rainfall rate,and cloud thicknessand density.Based on these results,amethod for thecorrectionof radar-derived CBH and CTH is proposed and,additionally,the characteristicsof the occurrence of cloud typesexam ined.
2. Data andmethod
2.1. Ka-band cloud radar
The Ka-band cloud radar used in this study is installed at the Boseong NCIO and operated by the National Institute of Meteorological Sciences of Korea.Boseong NCIO is located on the southern coast of Korea(34.76°N,127.21°E), and equipped w ith a variety ofmeteorological observational instruments(ceilometers,optical raingauge,micro rain radar, particle size velocity disdrometer,global navigation satellite system,and w ind profi ler)in addition to the cloud radar. The cloud radar transm its33.44GHz pulses in the Ka-band, and it is used for observations of precipitable clouds,nonprecipitable clouds,and low precipitation.By transm itting horizontalwaves and receiving both horizontal and vertical waves,the cloud radar produces reflectivity,radial velocity, spectrum w idth,linear depolarization ratio,and signal-tonoise ratio data.It isdesigned to observe cloudsof up to 15-km in heightw ith a resolution of 15m.Additionaldetailsof its characteristicsare provided in Table 1.
Cloudswere defined using the co-polar vertical reflectivity obtained by the cloud radar from September to November 2013(Fig.1a).Overall,6.27%of the cloud radar datawere m issing(12.64%in September,2.96%in October,and 3.33% in November)because of a variety of reasons including the suspension of observations(from 7 to 8 October 2013)because of strong w inds.To elim inate ground clutter,noise, and non-cloud echoes,clouds were defined as echoes w ithreflectivity values of greater than−30 dB Z and thicknesses of greater than 1.5 km.The reflectivity threshold of−30 dB Z has been reported previously as them inimum value of radar reflectivity for cirrus clouds(Brown et al.,1995),and the thickness threshold of 1.5 km was determ ined based on the average thickness of cirrus clouds observed by LiDAR (Fuller etal.,1988;Kentand Schaffner,1988).In addition, to removenon-meteorologicalecho,like thatgenerated by insects,which appearsw ith reflectivity values lower than−30 dB Z and atheightsof lessthan2 km,thehydrometeorboundaries were determ ined using the threshold of reflectivity of−30 dB Z and a signal to noise ratio(SNR)of5 dB.A lthough not shown in this paper,when these thresholdswere set to a reflectivity lower than−30 dB Z and an SNR lower than 5 dB,itwashard to detect theboundariesaccurately due to the influence of the noise generated on the ground:and when it was set to values greater than the thresholds,the top height wasestimated lower and the base heightgreater.The CBHs and CTHs were defined as the lowest and highest altitudes of the clouds,respectively(Fig.1b).Multi-layer cloudswere considered as single entities and cloud thicknesseswere defined as the differencebetween the CBH and CTH.
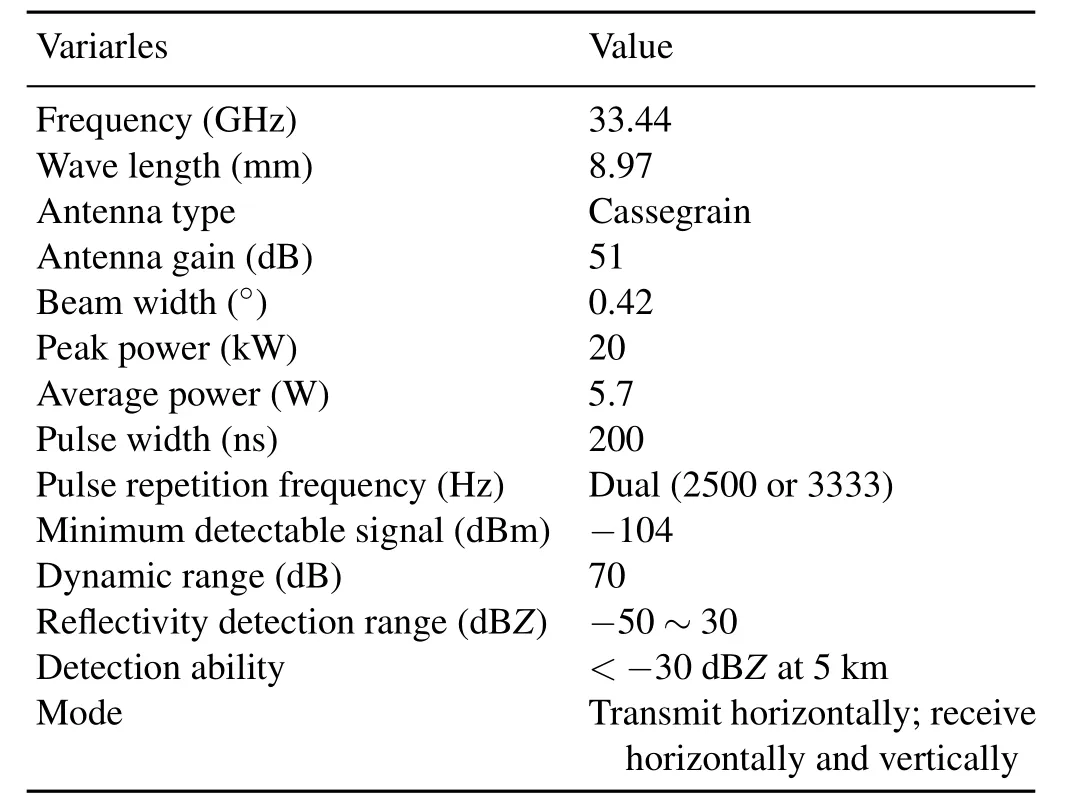
Table 1.Characteristicsof the Ka-band cloud radar at the Boseong NCIO.________________________________________________
2.2. Ceilometerand COMS
For comparative analysis,clouds were defined using a ceilometer and COMS from September to November 2013. The CBHswere observed using a Vaisala CL51 ceilometer, which uses LiDAR technology to transm itpulsed waves vertically and receive backscattered signals reflected by cloud drops.Thisceilometerhasa rangeof13 km witha10-m resolution for cloud detection.TheCTHswereobtained using the COMSmeteorologicaldata processing system,which simultaneously employs single-channel and radiation-ratiomethods(METRI/KMA,2009).The single-channelmethod calculates the cloud top temperature by converting the brightness temperature of COMS to cloud top pressure.When thismethod is employed,the cloud top pressures of semitransparent clouds are calculated to be higher than their actual values.Therefore,this is corrected using the radiationratiomethod.The radiation-ratiomethod involves applying thebrightness temperaturesof thewatervapor(6.75µm)and infrared-1 channels toobtain thecloud top pressure.The temporal resolution of the CTHs observed by COMS is 15m in and the spatial resolution is4 km.In thisstudy,the dataat00 m inwereextracted and usedandwereanalyzed using thegrid data(34.76°N,127.21°E)nearest to Boseong Center.The results of these twomethodswere compared to select the optimum cloud top pressure,from which CTHswere calculated using thehypsometric equation.
In thisstudy,targets forwhich CBHsand CTHswereobserved by both the ceilometer and COMS were defined as clouds.Furthermore,cases for which the cloud radar data contained missing values were excluded from further analysis.The CBHs and CTHs obtained using the ceilometer–COMSdatawere compared w ith the cloud radar data.
3. Com parative verification of cloud radar data
3.1. Comparison ofcloud base and top heightformations
3.1.1. Average cloud base and top heights
Table 2 shows the CBHs,CTHs,and cloud thicknesses observed by the cloud radarand ceilometer–COMS.The differencebetween theaverage CBH and CTH based on theobservations from the cloud radar(363 cases)and ceilometer–COMS(510 cases),showed that the cloud-radar-derived CBH and CTH were higher by 0.75 and 0.36 km,respectively,and that the radar-derived averagecloud thicknesswas 0.39 km smaller.However,for the 285 cases in which the cloudswere observed simultaneously by the cloud radar and ceilometer–COMS,itwas found that the radar-derived CBH and CTH was 0.11 km higher and 0.73 km lower,respectively,and thatthe radar-derived cloud thicknesswas0.84 km smaller.These cases showed only slightdifferencesbetweenthe data obtained by the cloud radar and ceilometer–COMS. Conversely,when theCBH and CTHwereobserved by either the cloud radar or ceilometer–COMS,the differences in the datawere relativelymore significant.For instance,observationsby thecloud radar(78 cases)showed averageCBHsand CTHs of 5.04 and 7.54 km,respectively,indicatingmainly high cloudsw ith thicknessesof about2.5 km.However,observationsby ceilometer–COMS(225 cases)showed average CBHsand CTHs of 2.13 and 5.38 km,respectively,indicatingmainly low cloudsw ith thicknessesof3.25 km.Although the average CBHs and CTHs were sim ilar when cloud observations were made concurrently by the cloud radar and ceilometer–COMS,there were differences between the frequenciesofoccurrencedetermined forvarying altitudes.The frequency of occurrence of CBH decreased gradually from thesurface to thealtitudeof10 km in the ceilometerobservations,whereas the frequency of occurrencewas concentrated below the altitude of 1 km in the cloud radar observations (Fig.2a).Excluding the fact that the frequency of occurrence of cloudsw ith top heightsof 2–3 km washigher in the cloud radarobservations,sim ilar distributionswere observed atmostaltitudes(Fig.2b).

Table 2.Mean valuesof CBH,CTH,and cloud thicknessobserved by cloud radar(CR)and ceilometer–COMS(CC)of total,simultaneous, and sole(CR or CC)cases.
3.1.2. Precipitation events

Fig.1.(a)Time-height cross section of reflectivity(units:dB Z)observed by cloud radar from September to November2013 and(b)cloud base(crosses)and top(circles)heights(units:km) observed by cloud radar(CR;blue)and ceilometer-COMS(Ceil;red).Thegray and green shading indicatesmissing valuesand rainfall cases,respectively.MDSmeansminimum detectable signal.

Fig.1.(Continued.)
In order to analyze the reason for thedifferencesbetween the cloud radar and ceilometer–COMS data,the CBHs and CTHs were compared based on whether precipitation had been present(Fig.3).The cases in which rainfallwas detected by themicro rain radar at the Boseong NCIO were defined as precipitation cases(125 cases),and the remainder defined asnon-precipitation cases(160 cases).TheCBHsobtained by thecloud radarwereeithersimilar to orhigher than the values obtained by the ceilometer in non-precipitation cases(Fig.3a).However,in precipitation cases,the CBHs observed by the cloud radarwere sim ilar to ground level,and for this reason,the frequency of low CBH was shown to be high in the cloud radar data,as shown in Fig.2a.For the precipitation cases,the CTHs derived by cloud radar were sim ilar to or lower than observed by COMS(Fig.3b).
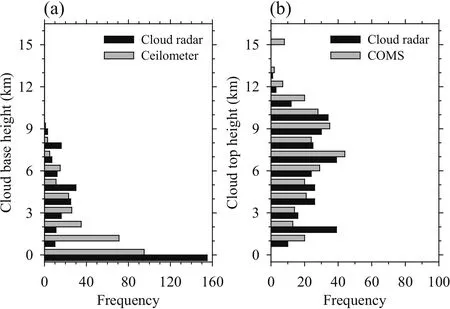
Fig.2.Frequency of occurrence of cloud(a)base and(b)top heightsobserved by cloud radar(black)and ceilometer–COMS(gray).
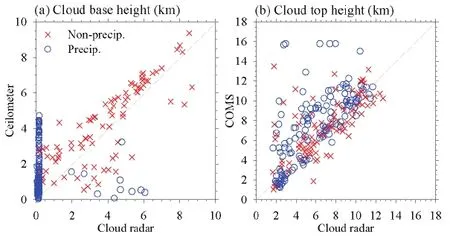
Fig.3.Scatter plotsof cloud(a)baseand(b)top heights(km)observed by cloud radarand ceilometer–COMS. The crossesand circles indicate non-precipitation and precipitation cases,respectively.
The impact of precipitation could change depending on rainfall intensity.The differences between the CBHs and CTHsobtained by thecloud radarand ceilometer–COMSand them icro rain radar at 200 m at varying rainfall rateswere examined(Fig.5).The results showed that at higher rainfall rates,CTHsobserved by the cloud radarwere lower than COMS(Fig.5b).Generally,the CBHsobserved by the cloud radarwere lower than the ceilometer,but the difference decreased as the rainfall rate increased(Fig.5a).This can be attributed to the ceilometeralso being aground-based instrument.In cases of heavy precipitation(>30 mm h−1),the CBHs observed by the ceilometerwere close to the ground, aswas the case for the cloud radar.
3.1.3. Cloud thicknessand density
Even in the non-precipitation cases,there were differences between the CBHs and CTHs observed by the cloud radar and ceilometer–COMS(Fig.3).In order to determine the cause,the differences between the CBHs and CTHs observed by the cloud radarand ceilometer–COMSwereexam-ined according to cloud thickness(Fig.6).Cloud thickness was calculated using the cloud radar data.When the cloud was thick,the CBH and CTH values were relatively sim ilarbetween the cloud radarand ceilometer–COMS,but there weresignificantdifferences for thin cloud.

Fig.4.Time-seriesofhourly rainfall rate(R;units:mm h−1)observed by MRR(upperpanels)and time–height cross sections of reflectivity(units:dB Z)and cloud base(triangles)and top(circles)height(lower panels) observed by cloud radar(CR)and ceilometer–COMS(Ceil)pn(a)5–6 September 2013 and(b)24 November 2013.
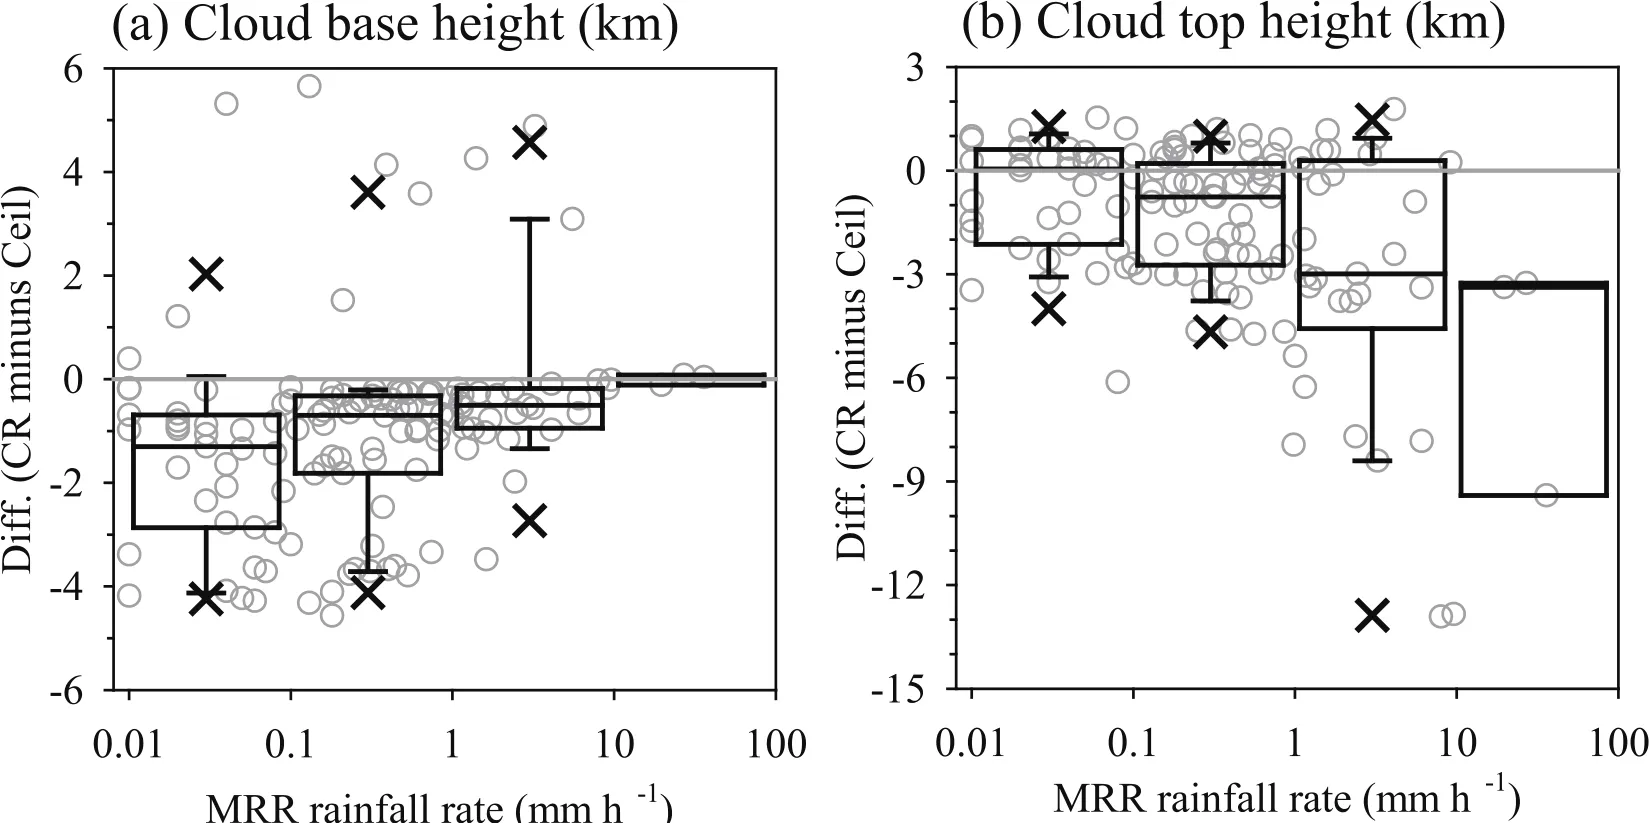
Fig.5.Scatterplotsand box plotsof rainfall rate(units:mm h−1)observed by MRR versusdifferencesof cloud (a)baseand(b)top heights(units:km)between cloud radar(CR)and ceilometer–COMS(Ceil).Boxes denote the 25th and 75th percentile positions,and the lines inside the box show themedian;thewhiskers denote the 10th and 90th percentile;outliersare indicated by the 5th and 95th percentile positions.
The cloud radar observations of thin and high clouds showed higher sensitivity(Fig.7a).The reason for this can be conjectured based on the observational characteristics of COMS:in the casesof thin and high clouds,theenergy em itted from below the cloud is observed by the satellite,which can lead to a higher brightness temperature in the infrared channel than theactualcloud top temperature.However,even w ith thin clouds,similar CBHsand CTHswere observed by the cloud radarand ceilometer–COMS in some cases(Fig.6).
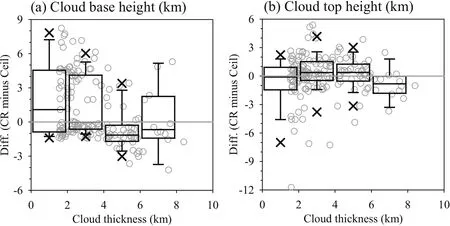
Fig.6.Scatter plotsand box plotsof cloud thickness(units:km)versusdifferencesof(a)CBHsand(b)CTHs (units:km)between cloud radar(CR)and ceilometer–COMS(Ceil).Boxesdenote the25th and 75th percentile positions,and the lines inside the box show themedian;the whiskers denote the 10th and 90th percentile; outliersare indicated by the 5th and 95th percentile positions.

Fig.7.Time-heightcrosssectionsof reflectivity(units:dB Z)and cloud base(triangles)and top(circles)height observed by cloud radar(CR)and ceilometer–COMS(Ceil)on(a)5(~1500 UTC)October 2013 and(b)6 (1600UTC)to 7(0300UTC)October2013.
A lthough the cloudswere thin in such cases,the cloud radar reflectivity was greater than 0 dB Z(Fig.7b).The reflectivity of the radar is a log of the ratio of the number of water dropletsw ith diameter of 1mm to the unit volume(1m3); therefore,it can be said that it provides information on the density of the cloud particles.Even in the caseof thin clouds, if the cloud density ishigh,they w illbe observed effectively by ceilometer–COMS.
3.2. Comparison ofcloud types
CBH and CTH data from thecloud radarand ceilometer–COMS were used to classify the cloud types observed at Boseong NCIO in the fallof2013,based on the classification method of Kolliasetal.(2007b)(Table3).Using thismethod, cloudswere classified ashigh,middle,and low depending on their CBHs and CTHs.Additionally,low cloudswere subdivided into non-precipitable and precipitable clouds,and then the precipitable clouds subdivided further into shallow and deep precipitable clouds according to their CTHs.The frequency of occurrence during the entire analysis period of clouds observed by the cloud radar was the highest for low clouds(49.59%),followed by m iddle clouds(31.68%),and high clouds(18.73%),as shown in Fig.8a.With respect to themonthly data,the aforementioned frequency patternwasalso observed in September and November,whereas the frequency of occurrence of low clouds was lower than the other two types in October.Similar to the cloud radar data, theceilometer–COMSdata revealed that the frequency ofoccurrence was highest for low clouds(61.37%),followed by m iddle clouds(31.18%),and high clouds(7.45%),as shown in Fig.8b.However,significant differenceswere found regarding the sub-classifications of low clouds.For instance, deep precipitable cloudswere observedmainly by the cloud radar(Fig.8a),whereas non-precipitable clouds were observedmainly by ceilometer–COMS(Fig.8b).
张清元觉得,唐小芹是孤儿院里最漂亮的女孩。她比那帮小家伙要大一些,但比张清元要小。黎院长就叫她小芹子。小芹子是一个从下江逃难来的女人留在河口的。张清元第一次见到小芹子是在河口。他之所以能记住小芹子,是因为她的嘴唇上长有一颗鲜亮突起的黑痣,圆圆的。他听大人们说过,那颗痣就叫美人痣,乍一看有些刺眼,但看过之后就觉得这女孩漂亮,过目难忘。

Table 2.Theclassificationof cloud typesusing CBH and CTH(Kolliasetal.,2007b).
Cases of precipitable and non-precipitable cloud types were also exam ined(not shown).In the case of precipitable clouds,low cloudswere observedmostly by the cloud radar (92.8%)and ceilometer–COMS(76.8%).However,different frequencies of cloud type were observed in the cases of non-precipitable clouds between the cloud radar(middle 46.25%>low 30.63%>high 23.13%)and ceilometer–COMS(low 43.75%>m iddle 41.25%>high 15.00%). The resultsof sub-classifying the low clouds showed that,in theeventof precipitation,deep precipitable clouds(97.41%) were observed mainly by the cloud radar,whereas the frequency of non-precipitable clouds(94.79%)was highest in the ceilometer–COMS observations.In the event of nonprecipitation,the cloud radar did not observe any one particular cloud type more frequently,while non-precipitable clouds(100%)were still observed w ith high frequency by the ceilometer–COMS.
This could be explained by the fact that,in the eventof precipitation,theCBH isobserved to beclose to ground level by the cloud radar,whereas theCBH observed by ceilometer–COMSisgreater than 200m.However,theCBH observed by the cloud radar is lower than theactualheightbecauseof the influence of the precipitation and thus,there is a need for a new setof cloud classification criteria for cases in which the CBH values require correction based on ceilometer–COMS data.
4. Cloud radar data correction and characteristic analysis
A lthough the cloud radarmade high-sensitivity observations in the absence of precipitation,dataobtained during the occurrenceof precipitationwereunreliable.Thus,in casesofprecipitation ormissing cloud radar data,the CBH and CTH values obtained from the cloud radar were corrected using ceilometer–COMSdata(Fig.9).

Fig.8.Occurrence countsof cloud typesobserved by(a)cloud radarand(b)ceilometer–COMS.

Fig.9.Time–height cross section of reflectivity(units:dB Z)and cloud base and top heightusing corrected cloud radardata.The gray and green shading indicatesm issing valuesand rainfallcases,respectively.
Using the corrected CBH and CTH data,the cloud types were re-classified.Similar to the pre-correction cloud classification results,the cloud types in decreasing order of frequency of occurrencewere:low clouds(54.55%)>m iddle clouds(32.59%)>high clouds(12.86%)(Fig.10).Data obtained in October showed that the frequency of occurrence of low clouds increased follow ing the correction,whichwas attributed to the occurrence of low cloudsmainly under con -ditions of strong w inds that resulted inm issing data values. The resultof sub-classifying the low clouds(notshown)was sim ilar to the result obtained from ceilometer–COMS(Fig. 8b).This was thought to be because low clouds occurred most frequently during precipitation events,whichmeantthat cloud radardatawere substituted by ceilometer–COMSdata. In such cases,the reference value for theCBH(200m)in the sub-classification of low clouds was changed appropriately to the corrected data.Based on the corrected data,the average CBH of 1.27 km was used during precipitation events for the sub-classification of low clouds,and the results are shown in Fig.10.The cloud typew ith the highest frequency ofoccurrencewasdeep precipitable clouds,followed by nonprecipitable clouds,and shallow precipitable clouds.
5. Summary and conclusions

Fig.10.As in Fig.8,butusing corrected cloud radar data.
In this study,the CBHs and CTHs observed by the Kaband cloud radar at the Boseong NCIO in the fall of 2013 (September–November)were verified and corrected.For the purposesof thisstudy,a cloudwasdefined as cases inwhich the cloud radar observed reflectivity values of greater than−30 dB Z and w ith a thickness of 1.5 km.For comparison, cases in which the CBH observed by the ceilometer and the CTH observed by COMSoccurred concurrentlyweredefined asa cloud.
First,theCBH and CTH dataobtained by the cloud radar and ceilometer–COMSwere compared.In casesofprecipitation,the CBHsand CTHsobserved by the cloud radar tended to be lower than theactualheights.The reason for this could beexplained by theobservational characteristicsof the cloud radar.Cloud radar is a ground-based observation system, which isaffected bymeteorological phenomena occurring in the lower levelsof the atmosphere.Of particularnote,as the cloud radarusesam illimeter-wavelength signal to detect the small cloud particles,signal attenuation occurs in the presence of raindrops.For this reason,the radar-derived CBHs were observed to be closer to the ground,while the CTHs wereobserved to be lower than theactualheights.In theabsence of precipitation,the CBHs and CTHs observed by the cloud radarand ceilometer–COMSweresim ilar.Thin or lowdensity cloudswere observedmore effectively by the cloud radar comparedw ith ceilometer–COMS.
The resultof classifying the cloud types observed by the cloud radarand ceilometer–COMSshowed thatthe frequency ofoccurrencewashighest for low clouds,followed bymiddle clouds,and high clouds.Sub-classification of low cloudsoccurring in precipitation cases showed that deep precipitable clouds were observed mainly by the cloud radar,whereas non-precipitablecloudswereobservedmainly by ceilometer–COMS.The cloud radardataobtained during theoccurrence of precipitation could notbe considered reliable.Thus,itwas deemed necessary to correct the cloud radar data using the ceilometer–COMS data and to establish new criteria for the sub-classification of cloud in such cases.
Based on these results,for casesof precipitation orm issing data,the cloud radar data were corrected using the ceilometer–COMS data and re-classified using the new reference value.The reference value for the CBH(200m)was changed to 1.27 km for the sub-classification in casesof precipitation.
The results of this study show that cloud radar could effectively provideadescription of cloud boundaries in theabsenceof precipitation.However,cloud radardataaredeemed unreliable in the presence of precipitation.In such cases,it is proposed that the radar data be corrected using data obtained from otherobservationalsystems such asa ceilometer or satellite.It isexpected that future research involving analysesof the liquidwatercontentand rain-rateestimation,w ith a focus on themicrophysical characteristics of clouds,w ill contribute to the understanding of themechanismsand characteristicsof cloud formation.
Acknow ledgements.This study was supported by the principal project,“Development and application of technology for weather forecasting(NIMR-2012-B-1)”of the National Institute of Meteorological Sciences of the Korea Meteorological Adm inistration.
REFERENCES
Ahlgrimm,M.,and R.Forbes,2014:Improving the representation of low clouds and drizzle in the ECMWFmodel based on ARMobservations from the Azores.Mon.Wea.Rev.,142, 668–685.
Aydin,K.,and J.Singh,2004:Cloud ice crystal classification using a95–GHz polarimetric radar.J.Atmos.Oceanic Technol., 21,1679–1688.
Brown,P.R.A.,A.J.Illingworth,A.J.Heymsfield,G.M.Mc-Farquhar,K.A.Browning,and M.Gosset,1995:The role of spacebornemillimeter-wave radar in theglobalmonitoring of ice cloud.J.Appl.Meteor.,34,2346–2366.
Clothiaux,E.E.,M.A.Miller,B.A.A lbrecht,T.P.Ackerman,J. Verlinde,D.M.Babb,R.M.Peters,and W.J.Syrett,1995: An evaluation of a 94-GHz radar for remote sensing of cloud properties.J.Atmos.Oceanic Technol.,12,201–229.
Clothiaux,E.E.,T.P.Ackerman,G.G.Mace,K.P.Moran,R.T. Marchand,M.A.Miller,and B.E.Martner,2000:Objective determination of cloud heights and radar reflectivities using a combination of active remote Sensors at the ARMCART Sites.J.Appl.Meteor.,39,645–665.
Fuller,W.H.,M.T.Osborn,andW.M.Hunt,1988:48–inch lidar aerosolmeasurements taken at the Langley research center–May 1974 to December 1987.NASAReference Publication, 1209.
Hogan,R.J.,and A.J.Illingworth,2000:Deriving cloud overlap statistics from radar.Quart.J.Roy.Meteor.Soc.,126,2903–2009.
Hollars,S.,Q.Fu,J.Comstock,and T.Ackerman,2004:Com-parison of cloud–top height retrievals from ground–based 35 GHzMMCR and GMS–5 satelliteobservationsatARMTWP Manus site.Atmospheric Research,72,169–186.
Illingworth,A.J.,and Coauthors,2007:Cloudnet.Bull.Amer.Meteor.Soc.,88,883–898.
Kent,G.S.,and S.K.Schaffner,1988:Analysis of atmospheric dynam ics and radiative properties for understanding weather and climate,task 1,10µm backscattermodeling.STC Tech. Rep.2175,prepared for NASA under contractNAS1–18252.
Kneifel,S.,M.Maahn,G.Peters,and C.Simmer,2011:Observation of snow fallw ith a low–power FM–CW K–band radar (Micro Rain Radar).Meteor.Atmos.Phys.,113,75–87.
Kobayashi,F.,T.Takano,and T.Takamura,2011:Isolated cumulonimbus initiation observed by 95–GHz FM–CW radar,X–band radar,and photogrammetry in the Kanto region,Japan. SOLA,7,125–128.
Kollias,P.,E.E.Clothiaux,M.A.Miller,B.A.A lbrecht,G.L. Stephens,and T.P.Ackerman,2007a:Millimeter-wavelength radars:New frontier in atmospheric cloud and precipitation research.Bull.Amer.Meteor.Soc.,88,1608–1624.
Kollias,P.,G.Tselioudis,and B.A.A lbrecht,2007b:Cloud climatology at the Southern GreatPlainsand the layerstructure, drizzle,and atmosphericmodesof continentalstratus.J.Geophys.Res.,112,D09116,doi:10.1029/2006JD007307.
Mace,G.G.,C.Jakob,and K.P.Moran,1998:Validation of hydrometeoroccurrence predicted by the ECMWFmodelusing millimeter wave radar data.Geophys.Res.Lett.,25,1645–1648.
METRI/KMA,2009:Development of meteorological data processing system of communication,ocean andmeteorological satellite.846 pp.
Moran,K.P.,B.E.Martner,M.J.Post,R.A.Kropfl i,D.C.Welsh, and K.B.Widener,1998:An unattended cloud-profi ling radar for use in climate research.Bull.Amer.Meteor.Soc., 79,443–455.
O’Connor,E.J.,R.J.Hogan,and A.J.Illingworth,2005:Retrieving stratocumulusdrizzleparametersusing Doppler radarand lidar.J.Appl.Meteor.,44,14–27.
Oh,S.B.,H.Y.Won,J.C.Ha,and K.Y.Chung,2014:Comparison of cloud top heightobserved by a Ka–band cloud radar and COMS.Atmosphere,24,39–48.(in Korean)
Sakurai,N.,K.Iwanam i,T.Maesaka,S.I.Suzuki,S.Shim izu,R. Misumi,D.S.Kim,and M.Maki,2012:Case study ofmisoscale convective echo behaviorassociated w ith cumulonimbus developmentobserved by Ka–band Doppler radar in the Kanto region,Japan.SOLA,8,107–110.
Stokes,G.M.,and S.E.Schwartz,1994:The Atmospheric Radiation Measurement(ARM)Program:Programmatic Background and Design of theCloud and Radiation TestBed.Bull. Amer.Meteor.Soc.,75,1201–1221.
Syrett,W.J.,B.A.A lbrecht,and E.E.Clothiaux,1995:Vertical cloud structure in am idlatitude cyclone from a94–GHz radar. Mon.Wea.Rev.,123,3393–3407.
Widener,K.B.,and J.B.Mead,2004:W-band ARMcloud radar–Specifications and design.Proc.14th ARMScience Team Meeting,A lbuquerque,NM,Department of Energy/Office of Science.[Available online athttp://www.arm.gov/publications/proceedings/conf14/.]
Xi,B.K.,X.Q.Dong,P.Minnis,and M.M.Khaiyer,2010:A 10 year climatology of cloud fraction and vertical distribution derived from both surface and GOES observations over the DOEARMSGPsite.J.Geophys.Res.,115,D12124,doi: 10.1029/2009JD012800.
Yum,S.S.,S.N.Oh,J.Y.Kim,C.K.Kim,and J.C.Nam,2004: Measurements of cloud droplet size spectra using a forward scattering spectrometer probe(FSSP)in the Korean peninsula,Journalofthe Korean Meteorological Society,40,623–631(in Korean).
Zhong,L.Z.,L.P.Liu,S.Feng,R.Ge,and Z.Zhang,2011:A 35–GHz polarimetric Doppler radar and its application for observing clouds associated w ith typhoon Nuri.Adv.Atmos. Sci.,28,945–956,doi:10.1007/s00376-010-0073-5.
Zhong,L.Z.,L.P.Liu,M.Deng,and X.Zhou,2012:Retrievingm icrophysical properties and airmotion of cirrus clouds based on the Doppler momentsmethod using cloud radar. Adv.Atmos.Sci.,29,611–622,doi:10.1007/s00376-011-0112-x.
17 February 2015;revised 12 June2015;accepted 17 July 2015)
:Oh,S.-B.,Y.-H.Kim,K.-H.Kim,C.-H.Cho,and E.Lim,2016:Verification and correction of cloud base and top height retrievals from Ka-band cloud radar in Boseong,Korea.Adv.Atmos.Sci.,33(1),73–84,
10.1007/s00376-015-5058-y.
∗Corresponding author:Su-Bin OH
Email:ohsubin@korea.kr
杂志排行
Advances in Atmospheric Sciences的其它文章
- Variation in Summer Surface Air Tem perature over Northeast Asia and Its Associated Circulation Anomalies
- Ensemble Transform Sensitivity Method for AdaptiveObservations
- Dynam ic and Thermodynam ic Featuresof Low and Midd le Clouds Derived from Atmospheric Radiation Measurement Program Mobile Facility Radiosonde Data at Shouxian,China
- Observational FactsRegarding the Joint Activitiesof the Southwest Vortex and Plateau Vortex after ItsDeparture from the Tibetan Plateau
- Teleconnected Influenceof the BorealW inter Antarctic Oscillation on the Somali Jet:Bridging Role of Sea Surface Tem perature in Southern High and Midd le Latitudes
- Effectsof Surface Flux Parameterization on the Numerically Simulated Intensity and Structureof Typhoon Morakot(2009)
