利用区域地震波形振幅包络约束朝鲜地下核试验的埋深和当量
2016-07-28林鑫姚振兴
林鑫, 姚振兴
1 华中科技大学地球物理研究所,华中科技大学物理学院, 武汉 430074 2 中国科学院地质与地球物理研究所, 地球与行星物理重点实验室, 北京 100029
利用区域地震波形振幅包络约束朝鲜地下核试验的埋深和当量
林鑫1, 2, 姚振兴2
1 华中科技大学地球物理研究所,华中科技大学物理学院, 武汉4300742 中国科学院地质与地球物理研究所, 地球与行星物理重点实验室, 北京100029
摘要核爆当量和埋藏深度是地下核试验的两个重要参数.根据中国东北地区区域范围内地震台站观测记录,利用Pn,Pg,Sn和Lg波波形,计算水平分量的尾波振幅包络,调查2006年10月9日,2009年5月25日,2013年2月13日和2016年1月6日四次朝鲜地下核试验的爆炸当量和埋藏深度.以牡丹江(MDJ)台站记录为例,对两个水平分量波形进行带通滤波,计算平均波形的振幅包络.最终得到区域地震台站水平分量振幅包络,振幅稳定,包络振幅的变化清晰地显示区域震相的位置.区域震相的时间域振幅包络由震源谱函数、传播效应、台基响应和传递函数及尾波形状函数构成.通过网格搜索的方法,拟合水平分量记录的波形包络,可以获得核爆当量和埋藏深度的估计.结果表明,朝鲜四次地下核试验爆炸当量以时间为序从0.6±0.2 kt到3.0±1.5 kt,增加至10.0±2.0 kt,再降到8.0±2.0 kt.2006年核爆的埋藏深度较浅,为150±100 m,2009年朝鲜核试验的埋藏深度为350±100 m,2013年和2016年朝鲜核试验的深度非常一致,均为500±200 m.这些结果与前人的调查结果一致性较高,说明使用单一地震台站时间域水平分量尾波振幅包络是可能同时约束地下核试验爆炸当量和埋藏深度的.
关键词区域震相; 振幅包络; 朝鲜核试验; 爆炸当量; 埋藏深度
1引言
从2006年10月9日朝鲜第一次地下核试验以来,分别于2009年5月25日,2013年2月13日和2016年1月6日相继进行了三次规模较大的核爆试验(以下简称 NKT1, 2,3和4).四次朝鲜核爆的试验地点非常接近,在中国东北的地震记录中能够清楚地识别出区域震相中的Pn,Pg,Lg和Rayleigh波(例如, Zhao et al., 2008,2012,2014).由于NKT2和NKT3的震级较大,地震记录的信噪比相对较高,甚至在跨过日本海的日本F-NET台网的台站也记录到清楚的P波震相.朝鲜核试验所产生的地震数据,因为震源简单,记录质量高,能够为估算爆炸当量、分析朝鲜半岛核爆事件与地震事件之间的震源差异提供重要的信息,还可以用于研究核爆记录覆盖区域的地壳和上地幔的地震速度和衰减结构.因此,在全世界范围内激发了许多研究者的极大兴趣(Kim and Richards,2007;Kvrna et al.,2007;Salzberg and Marshall,2007;Bonner et al.,2008;Koper et al.,2008;Hong et al.,2008;Patton and Taylor,2008;Salzberg,2008;Tibuleac et al.,2008;Zhao et al.,2008;Hong and Rhie,2009;Kim et al.,2009;Chi et al.,2010;Murphy et al.,2010, 2011;Ni et al.,2010;Schlittenhardt et al.,2010;Shin et al.,2010;Rougier等,2011;Zhang and Wen,2013).
朝鲜核爆发生以后,很多研究者给出了地震学当量的估计.但是,因为使用资料和方法不同,当量估计结果差异较大.例如,对于2006年10月9日朝鲜地下核试验,Salzberg和Marshall(2007)利用同一台站不同事件地震记录的能量包络比值法,参照中国东北地区用于地震测深的已知当量的化爆事件,获得NKT1的当量估计为0.45 kt.基于最小埋藏深度假定,Zhao等(2008)利用中国东北及邻近地区的地震Lg波资料得到的当量估计是0.48 kt.但是,Chun等(2011)使用中朝边界附近的流动台网记录的区域Lg波资料得到的结果是1.22 kt.Murphy等(2013)利用远震P波振幅谱得到的核爆当量与埋深分别为0.9 kt和200 m.
早期核试验的核爆当量较高,通常是计算远震P波震级,利用震级与当量之间的经验关系获得爆炸当量的估计(例如, Ringdal et al.,1992; Douglas and Marshall,1996; Murphy and Barker, 2001).也可以通过远震P波波形反演求解核爆等效震源参数,利用相对静力学强度给出核试验的当量估计(赵连锋等,2005).随着核武器小型化,地下核试验的当量逐渐减小,区域地震记录成为研究核爆当量的首选资料.例如,Vergino和 Mensing(1990)发展了使用区域震相Pn波计算体波震级的方法;Nuttli (1973,1986a,1986b)以Lg波列中第三峰值振幅为基础发展了一种区域地震级系统,并建立了Lg波震级与爆炸当量之间的关系.Patton(1988)将Nuttli的方法推广应用到Nevada测试点(NTS)的更大的数据体.Hansen等(1990)和Ringdal等(1992)发现基于Lg波均方根(rms)振幅的震级估计更加稳定,即使台站很少,也能给出令人满意的当量估计.
最近,一些研究者尝试使用区域地震波形的高频波列,建立了计算震级和估计爆炸当量的尾波法(Mayeda and Walter,1996;Mayeda et al.,2003;Mayeda,1993;Murphy et al.,2009).尾波是地方震记录图中体波或面波之后的某些震荡,通常被认为是由于分布于地壳和上地幔的横向不均匀性引起的散射波,尾波的激发依赖于台站的地质情况(Aki,1969;Aki and Chouet,1975).在地方性地震范围内,体波震相Pn,Pg,Sn和短周期面波Lg较容易识别,但波形较为复杂且容易受到源和路径不均匀性的影响,但其尾波对辐射花样、传播路径等不敏感,波形特征稳定.因此,地方性地震范围内单个地震台站体波震相的尾波有可能用于测量地下核试验的当量和埋深.Pasyanos等(2012)将这种使用单一震相尾波方法扩展到多个震相,以等效震源函数、传播效应、台基响应和传递函数的物理模型为基础,建立了一种通过单一地震台站拟合区域波形全波列的包络,同时获得地下核试验当量和埋藏深度的方法.
2数据
选取中国东北地区距离朝鲜核试验场(表1)震中距范围在200 km到500 km之间的11个地震台站以及2002年到2013年间该区域发生的27个天然地震记录(ML≥2.5)来进行数据分析(表2).
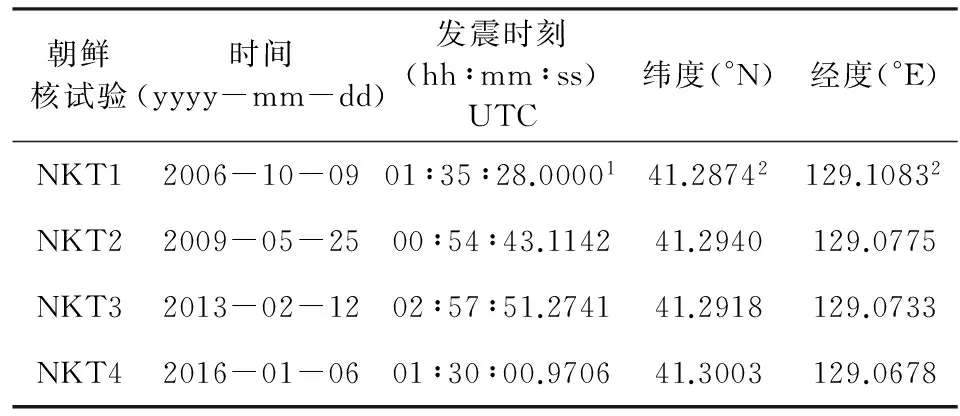
表1 朝鲜地下核试验事件目录
注:数据源1. USGS (Wen and Long, 2010; Zhao et al., 2014).
2. 卫星图像(Wen and Long, 2010; Zhao et al., 2014).
3方法
基于尾波单一散射模型(Aki,1969; Aki and Chouet,1975),Mayeda等(2003)给出在中心频率f和震中距r的单个区域震相尾波包络(图2)计算公式:Ac(t,f,r)=S(f)·G(r)·B(f,r)·P(f)

图1 研究区域背景图. 朝鲜地下核试验点(五角星),天然地震记录(黑色十字形),区域台站(黑色三角形)Fig.1 Map showing the background of study area and North Korean underground nuclear tests (star), earthquakes (black cross), and stations (black triangles)
·T(f)·E(t,f,r),
(1)
其中S(f)为震源谱,G(r)为几何扩展项,B(f,r)为衰减项,P(f)为台基响应,T(f)为传递函数,E(t,f,r)为描述尾波形状的函数,
E(t,f,r)=H(t-ta)·(t-ta)-γ(f,r)
·exp[b(f,r)·(t-ta)],
(2)
H为单位阶跃函数;ta为到时;γ(f,r)和b(f,r)为尾波形状参数.
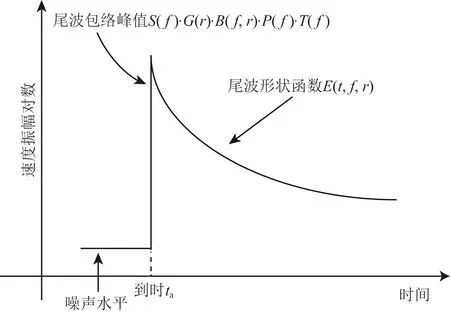
图2 单个震相理论包络形状Fig.2 The shape of single phase theory envelope
地方性或区域地震范围地震全记录的包络(图3a)为该区域噪声水平Anoise与所有区域震相包络之和(Pasyanos et al.,2012):
鬼子军官又说一声有戏。然后做了个让他们不要怕的手势,说了一大通生硬的中国话。大意是,你们几个都是支那的精英,我们十分欢迎各位和大日本皇军合作,如果同意,金票大大的有,花姑娘大大的有。
(3)
应用于实际观测资料,首先将两个水平分量记录经过反褶积去掉仪器响应,获得地面速度记录,然后,利用八阶零相(四个极点,双通)巴特沃兹滤波器得到窄频带波形,应用窄带包络公式(f为中心频率,v(t)为一个改正后的带通滤波地震图地面速度,h(t)为v(t)对应的希尔伯特变换):
(4)
求出两水平分量的窄带包络,再求取两个水平包络的平均值,经过平滑处理,最后获得该频带的尾波包络(图3b).这个过程也能用单分量(如垂直分量)来完成,但比起单分量,两个水平分量能提供一个更平稳光滑的包络.对于天然地震事件和地下核试验事件,其尾波包络(1)式中的各参数项只有震源项不同,其他参数项都可以由天然地震记录资料获得.应用于地下核试验事件中,通过天然地震记录构建地下核爆的理论包络,与实际结果比较,可以给出地下核试验的爆炸当量和埋藏深度(Pasyanos et al.,2012).
我们用事件前噪声水平来经验地估计Anoise,取Pn到达之前的噪声窗,进行统计处理,得到均值.对于壳幔模型,地壳用单层均匀介质层表示,壳幔边界水平,忽略坡度变化,地幔水平方向分块,每个方块内速度均匀,射线在地幔顶部走直线,忽略速度横向变化引起的实际射线弯曲,忽略地球曲率和地幔顶部垂向速度梯度的影响(裴顺平,2002).由于所用数据中天然地震和四次核试验事件的震源非常浅,震中距离较近,我们将Pg和Lg波的传播路径近似为震源到台站的直线(图4).Pn和Sn波的走时方程可描述为:

图3 区域事件理想包络形状(a)和实际波形包络形状(b).(b)为MDJ台站记录的2002年4月16日天然地震的不同频带的包络,横轴为时间(取发震时刻后250 s的记录),纵轴为速度振幅的对数.Fig.3 (a) Expected envelope shapes for regional events; (b) Shapes of real waveforms envelopes in different frequency bands of the earthquake event on 16 April 2002 recorded at MDJ station. X-axes are times (250 s after the origin time). Y-axes are the log amplitude of velocity.
(5)

(6)
其中Hs为震源处地壳厚度,hs为震源深度,Hr为台站处地壳厚度,hr为台站高程,r为震中距.

图4 区域震相射线路径图及壳幔模型Fig.4 Ray paths of regional phases and the crust-mantle model
中国东北地区Pn波平均波速度约为8.0~8.05 km·s-1,单层水平地壳P波平均速度约为6.3 km·s-1(贾军等,2011;裴顺平等,2004a;张国民等,2012),Sn波平均速度约为4.55 km·s-1,地壳S波速度约为3.6 km·s-1(裴顺平等,2004b), Pg波平均速度约为6.0 km·s-1,Lg波群速度为3.5 km·s-1(赵连锋,2008).

(7)
(8)
(9)

采用Mueller-Murphy模型(Mueller and Murphy,1971)来描述爆炸震源的震源谱,爆炸源P波部分震源谱的表达式为:

(10)
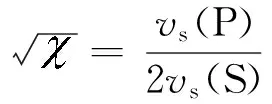
尾波形状参数b(f,r)和γ(f,r)代表尾波振幅的衰减,分别依赖于介质内在吸收引起的尾波几何扩展和衰减速率,b(f,r)控制尾波包络后半部分的斜率,γ(f,r)控制着紧跟直达波之后的尾波初期的衰减,γ(f,r)值越大表明尾波初期更陡峭或是有更大的直达峰值.根据Mayeda等(2003)给出的在地方性及区域地震范围内b(f,r)和γ(f,r)的函数关系:
(11)
(12)
其中γ0,γ1,γ2和b0,b1,b2为常量,可用网格搜索法确定.我们利用区域内27个天然地震的地震记录资料,在选定的频带内为每个地震事件-台站对用网格搜索找出γ的最佳参数值,γ的变化范围从0到1.6每次增加0.1.当γ固定之后用最小二乘法来反演求解b(Yoo et al.,2011).通过匹配E(t,f,r)与实际波形的衰减速率,由S波尾波和Lg波尾波校准得到我们所用区域台站的尾波衰减参数b(f,r)和γ(f,r)的数值(图5).
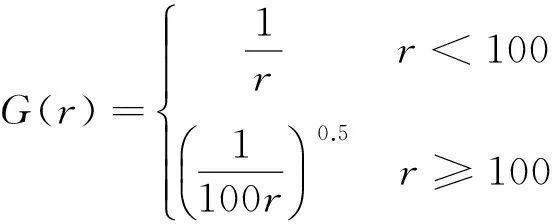

表3 MDJ台站各震相的Q0值和η值
尾波包络(1)式中几何扩展、衰减和尾波形状函数项确定后,将S(f)归一化,两边取对数log10,应用L1范数改正并通过网格搜索比较MDJ台站记录的2002年4月16日和2004年12月16日两次天然地震事件来得到MDJ台站台基响应和传递函数,即对理论包络做出改正,再应用于地下核试验事件中(图6).
4结果
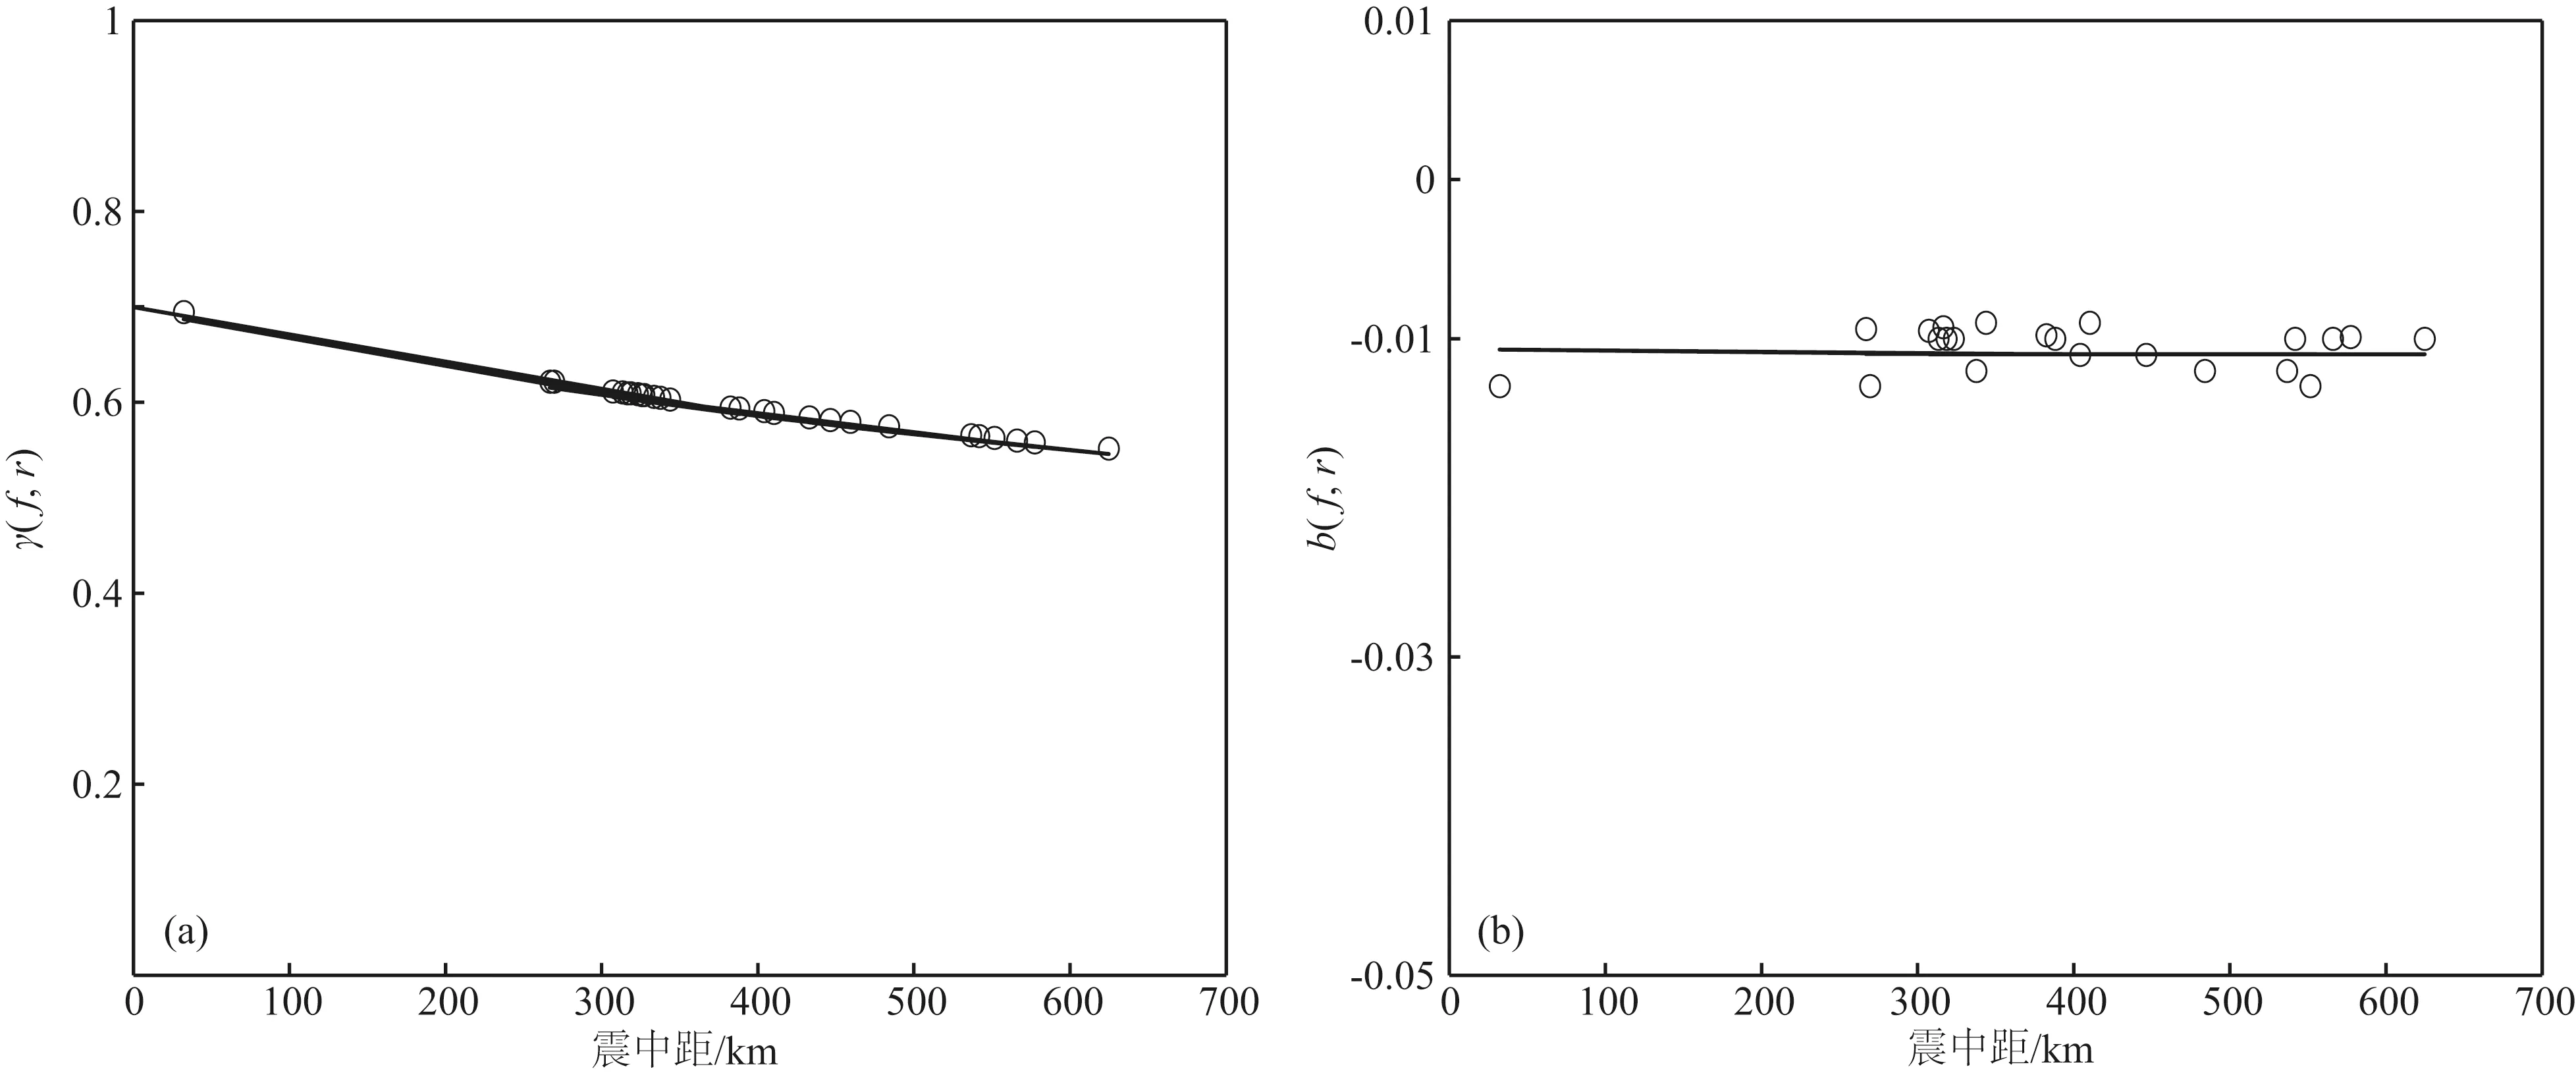
图5 MDJ台站尾波衰减参数γ(f,r)和b(f,r)在频带2~4 Hz内所得结果Fig.5 Coda-decay parameters γ(f,r) and b(f,r) in the 2~4 Hz frequency band at MDJ station

图6 MDJ台站理论包络改正2002年(a)和2004年(b)地震事件MDJ台站的拟合结果(2~4 Hz频带内),实际波形包络(黑色波形),未改正的地震理论包络(蓝色虚线),改正后的地震理论包络(绿色实线).横轴为时间(取发震时刻后250s的记录),纵轴为速度振幅的对数.Fig.6 Corrected theoretical envelopes at MDJ station(a) Seismic event of 2002 (2~4 Hz); (b) Seismic event of 2004 (2~4 Hz) with envelopes of real data (black waveforms), uncorrected theoretical seismic envelopes (blue dash lines), corrected theoretical envelopes (green lines). X-axes are times (250 s after the origin time). Y-axes are log amplitudes of velocity.

图7 MDJ台站四次朝鲜地下核试验事件垂直分量速度记录波形上标出了视群速度值.Fig.7 Vertical velocities of four North Korean underground nuclear tests recorded at MDJ station Apparent group velocity values are marked on waveforms.
MDJ台站记录到朝鲜四次地下核试验的垂直分量速度记录如图7所示.对于朝鲜的四次地下核试验事件,根据中国东北地区地震台网的区域地震台站全波列尾波的理论包络,采用爆炸源模型,介质类型为花岗岩,通过网格搜索比较不同当量、不同埋深事件的理论包络与实际结果,确定四次地下核试验事件的最佳拟合理论包络(图8,9).从图8中可以看出,尾波包络的振幅对于当量和埋深的变化是比较敏感的.当量1 kt、埋深100 m的理论包络(蓝色实线)比2006年核试验事件实际包络的当量和埋深要大,但比2009年核试验事件实际包络的当量和埋深要小得多.对于2013年和2016年两次核试验事件,当量15 kt、埋深500 m的理论包络(蓝色实线)大于实际包络的当量和埋深,而当量5 kt、埋深500 m的理论包络(黑色虚线)小于实际包络的当量和埋深,对比两次核试验事件实际波形包络可以看出两次核试验事件的实际当量和埋深差别较小.我们将当量和深度分别从0.01 kt到100 kt、10 m到1000 m的范围内进行搜索,找出最佳拟合范围(图9)获得2006年核试验事件的当量为0.6 kt(0.4~0.8 kt),埋藏深度为150 m(50~250 m),2009年核试验事件的当量为3 kt(1.5~4.5 kt),埋藏深度为350 m(250~450 m),2013年核试验事件的当量为10 kt(8~12 kt),埋藏深度为500 m(300~700 m),而2016年核试验事件的当量为8 kt(6~10 kt),埋藏深度为500 m(300~700 m).
我们选用除MDJ台站外其他10个区域地震台站采用爆炸源模型来研究2013年地下核试验事件,结果如图10所示.从图10中可以看出,当量10 kt、埋藏深度500 m时,10个区域台站尾波的理论包络与实际资料都拟合较好,表明整个区域地震台网内的台站结果具有高度的相似性,说明地方性及区域地震范围内单个地震台站体波震相的尾波有可能用于测量地下核试验的当量和埋深.
Chi等(2010),Murphy等(2010),Salzberg(2008),Zhang和Wen(2013),Pasyanos 等(2012)及Zhao等(2008,2012,2014,2015)都曾给出朝鲜地下核试验核爆当量和深度的研究结果.表4给出了本文与前人调查结果的比较,可以看出本文结果与表中几位国内外专家的研究一致性较高,说明地方性及区域地震范围内单个地震台站体波震相的尾波是可能同时约束地下核试验的爆炸当量和埋藏深度的.
5结论
尾波对辐射花样、传播路径等不敏感,且波形特征稳定,本文通过构建一个理论的区域震相尾波振幅包络,来拟合地方性及区域地震范围内单一地震台站实际波形记录,调查朝鲜四次地下核试验的爆炸当量和埋藏深度.所有区域震相的时间域振幅包络由其震源谱函数、传播特征、台基响应、传递函数及尾波形状函数组成,我们通过研究区域内天然地震记录资料对各参数项进行实际分析,得到计算尾波理论包络所需各参数值,例如27个天然地震记录资料来获得MDJ台站所选用频带内的尾波形状参数b(f,r)和γ(f,r)值.我们对当量和埋藏深度进行网格搜索来拟合台站水平分量记录的尾波包络,得到2006年核试验事件的当量为0.6 kt±0.2 kt,埋藏深度为150 m±100 m,2009年核试验事件的当量为3 kt±1.5 kt,埋藏深度为350 m±100 m,2013年核试验事件的当量为10 kt±2 kt,埋藏深度范围为500 m±200 m,而2016年核试验事件的当量为8 kt±2 kt,埋藏深度范围为500 m±200 m.

图8 MDJ台站四次朝鲜地下核试验事件拟合结果(2~4 Hz频带内)实际波形包络(黑色波形),最佳拟合理论包络(红色实线). 2006年(a)和2009年(b)图中蓝色实线为当量1 kt、埋深100 m的理论包络,2013年(c)和2016年(d)图中蓝色实线和黑色虚线分别为当量15 kt、埋深500 m及当量5 kt、埋深500 m的理论包络.横轴为时间(取发震时刻后250 s的记录),纵轴为速度振幅的对数.Fig.8 Results of four North Korean underground nuclear tests in 2006 (a), 2009 (b), 2013 (c) and 2016 (d) at MDJ station (2~4 Hz)The envelopes of real data (black waveforms), best fitting theoretical envelopes (red lines) are plotted. Blue lines in 2006 (a) and 2009 (b) represent the theoretical envelopes of 1 kt with 100 m depth, while for 2013 (c) and 2016 (d) the blue lines and black dash lines represent the theory envelopes of 15 kt with 500 m and 5 kt with 500 m depths, respectively. X-axes show times (250 s after the origin time). Y-axes show the log amplitudes of velocity.

2006-05-252009-10-092013-02-122016-01-06当量(kt)深度(m)当量(kt)深度(m)当量(kt)深度(m)当量(kt)深度(m)Chi0.4(0.2~0.8)-3.2(1.6~6.4)-----Murphy0.92004.6550----Salzberg0.85±0.1-------Zhang--7.0±1.961012.2±3.843011.13±4.0*-Pasyanos0.5±0.3100(20~300)2(1~5)200(70~600)----Zhao0.48-2.35-7.47-3.58**-本文0.6±0.2150±1003.0±1.5350±10010.0±2.0500±2008.0±2.0500±200
注:*中国科学院大学精确测定朝鲜核爆(http:∥news.cri.cn/201617/14d96c7a-fe28-4307-fcee-d4b4e2ed8a5a.html).**研究快报:2016年1月6日朝鲜核试验定位、识别和当量估计的初步调查结果 ( http:∥www.igg.cas.cn/xwzx/kyjz/201601/t20160107_4515052.html).

图9 2006年(a)、2009年(b)、2013年(c)和2016(d)年四次朝鲜地下核试验事件的MDJ台站网格搜索结果黑色五角星为最佳拟合,色标范围表示不拟合度由最佳拟合处向四周延伸越来越大.Fig.9 Results of grid search for 2006 (a), 2009 (b), 2013 (c) and 2016 (d) North Korean underground nuclear tests at MDJ stationThe best fit is indicated by the star. The color scale from the best fit extending all around means misfit getting greater.
由于核爆当量与埋藏深度依赖于爆炸源模型和传递函数,而传递函数如前所述是由该区域内天然地震记录资料中经验地推导出的,需要在未来能更加透彻地理解爆炸源模型和传递函数,并希望能给出更好、更合理的解释.另外,区域范围内四个区域震相Pn,Pg,Sn,Lg在实际波形中能较清楚地观测到,而在地方震距离内(Δ<100 km)的地震台站上只有Pg和Lg两个震相,所以我们下一步的工作是研究从近场到区域地震范围内,该方法在更多更密集的台站上的具体表现.
致谢感谢美国地震学研究机构联合会(IRIS)提供的四次朝鲜地下核试验的数据资料,感谢赵连锋副研究员、郝金来副研究员和赵旭副研究员提供的宝贵建议和帮助.
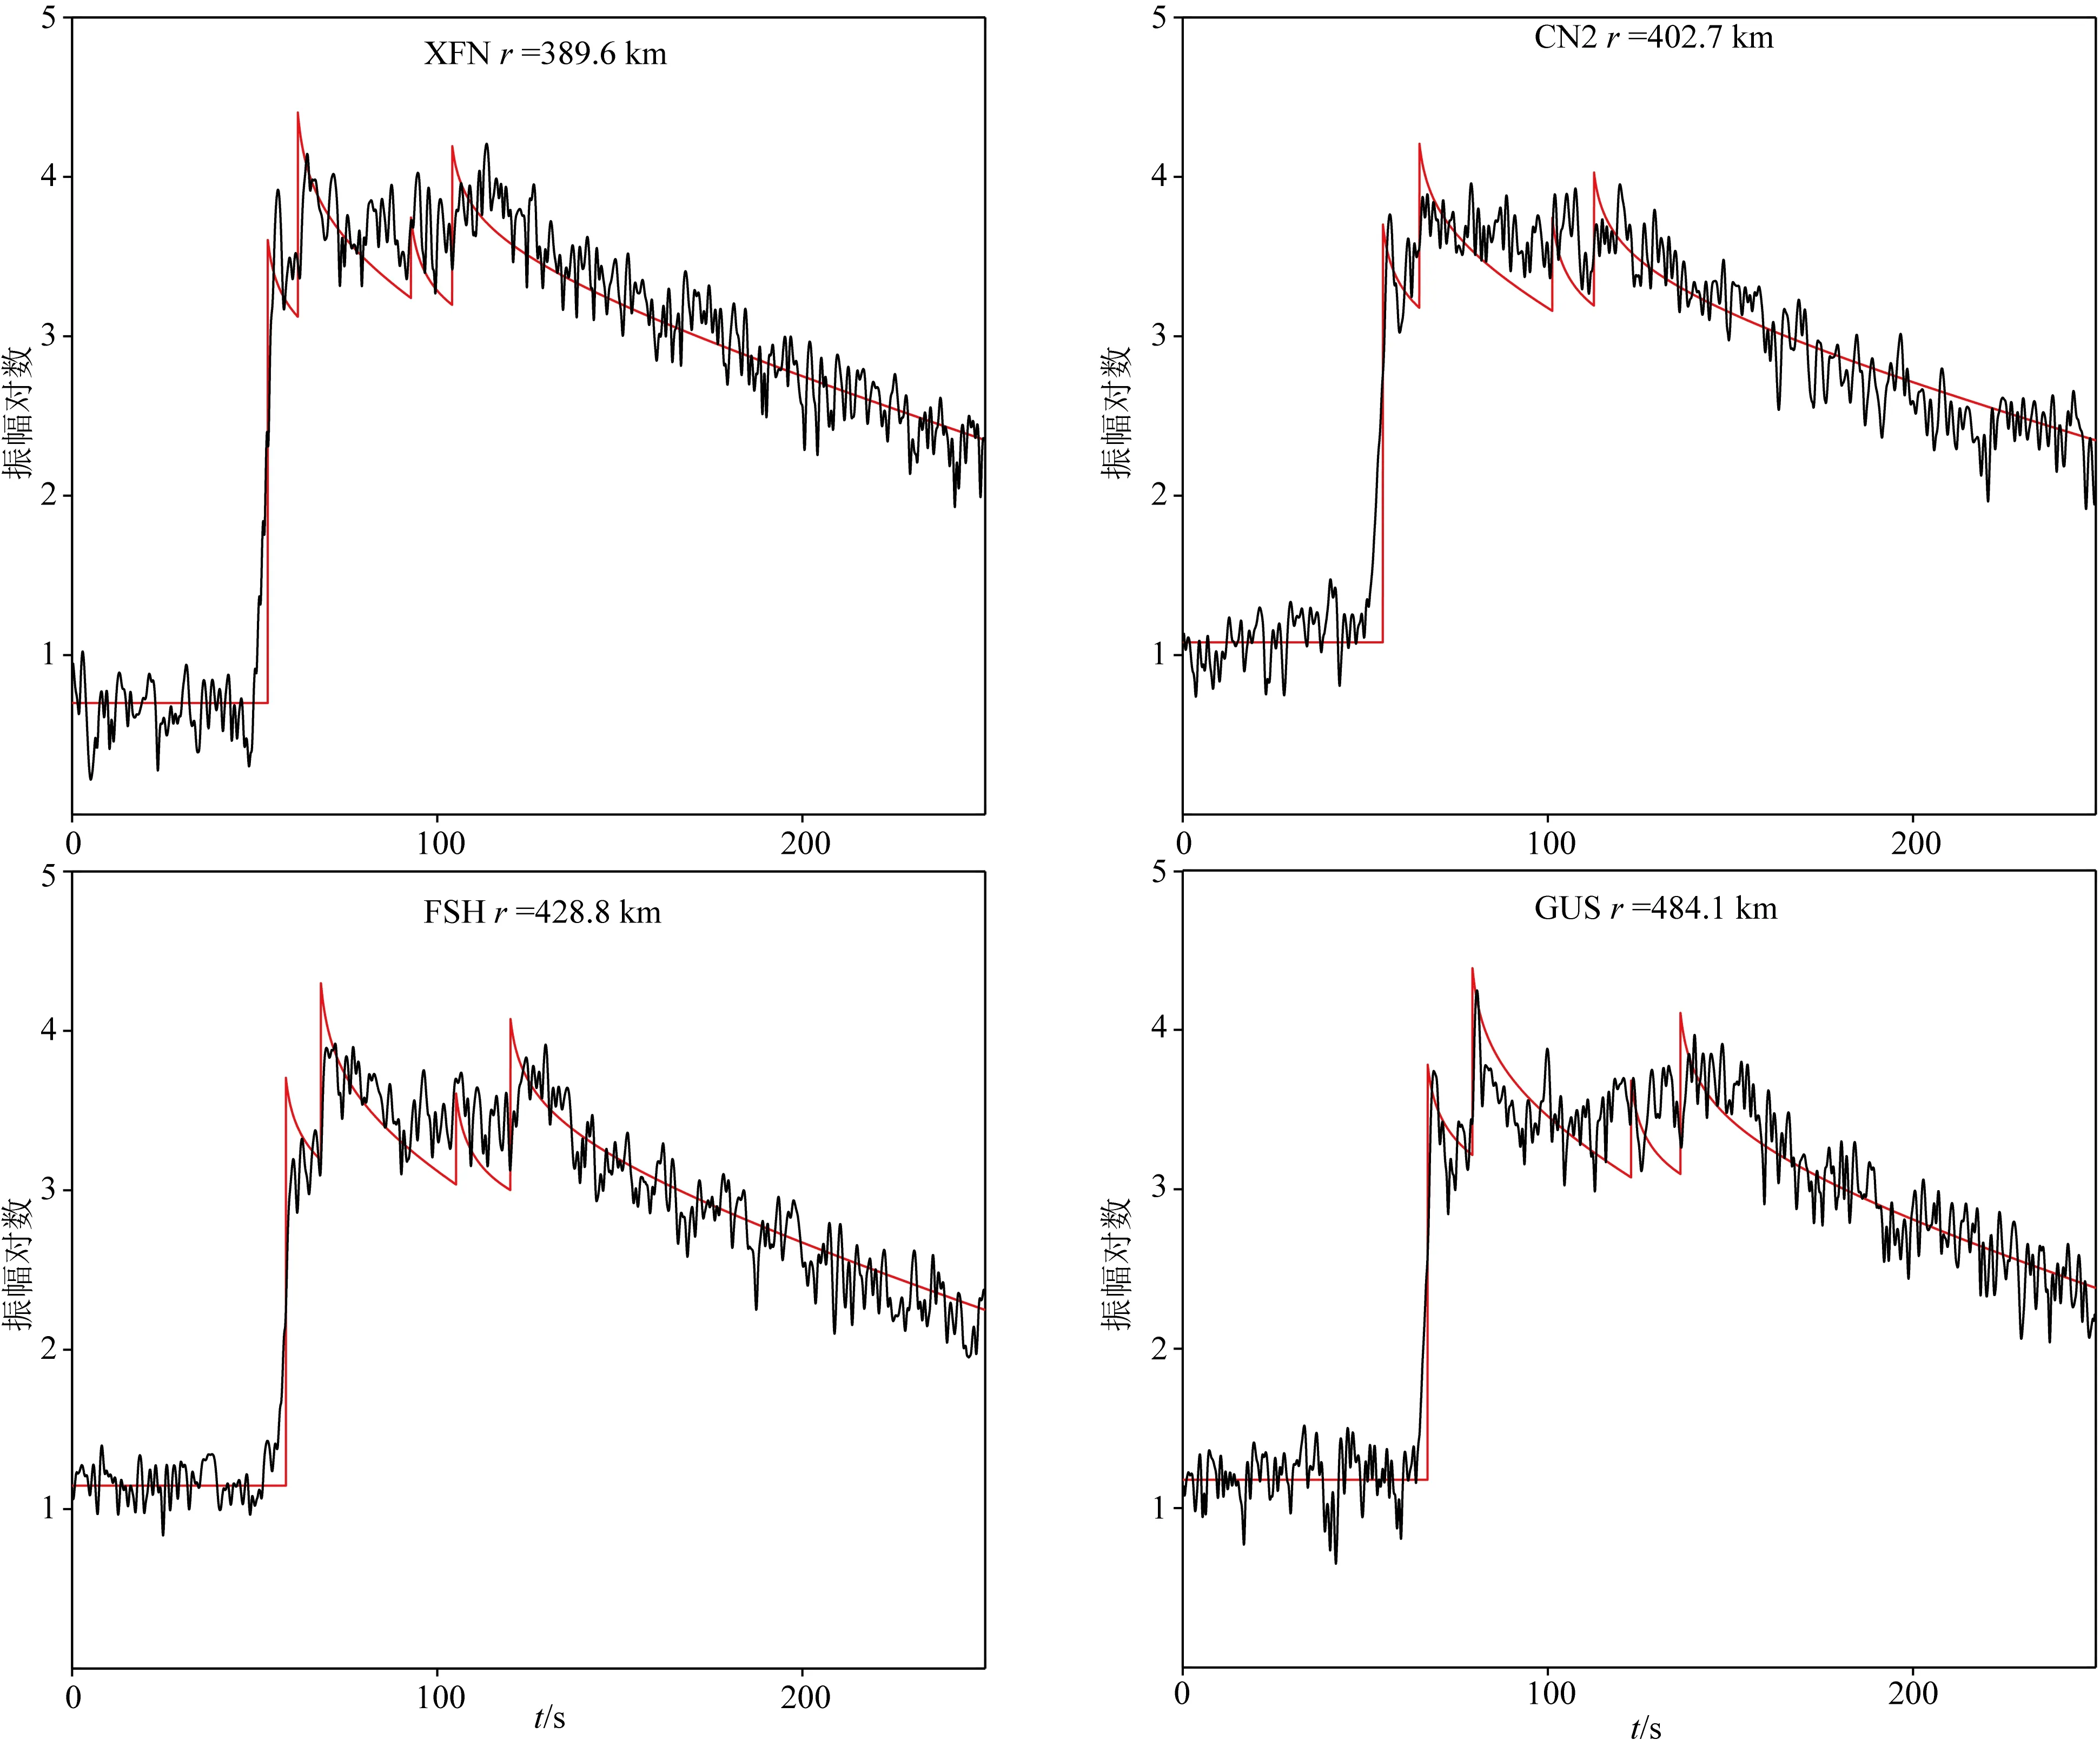
图10 2013年朝鲜地下核试验事件10个区域台站拟合结果(2~4 Hz频带内)实际波形包络(黑色波形),最佳拟合理论包络(红色实线).横轴为时间(取发震时刻后250 s的记录),纵轴为速度振幅的对数.Fig.10 Fitting results of North Korean underground nuclear test in 2013 at 10 regional stations (2~4 Hz)Envelopes of real data (black waveforms), best fitting theoretical envelopes (red lines) are displayed. X-axes show the time (250 s after the origin time). Y-axes show log amplitudes of velocity.
References
Aki K. 1969. Analysis of the seismic coda of local earthquakes as scattered waves.J.Geophys.Res., 74(2): 615-631.
Aki K, Chouet B. 1975. Origin of coda waves: source, attenuation, and scattering effects.J.Geophys.Res., 80(23): 3322-3342.
Bonner J, Herrmann R B, Harkrider D, et al. 2008. The surface wave magnitude for the 9 October 2006 North Korean nuclear explosion.Bull.Seismol.Soc.Am., 98(5): 2498-2506.
Brune J N. 1970. Tectonic stress and the spectra of seismic shear waves from earthquakes.J.Geophys.Res., 75(26): 4997-5009.Chi H C, Park J H, Kim G Y, et al. 2010. Monitoring North Korea nuclear tests: Comparison of 1st and 2nd tests.GeophysicsandGeophysicalExploration, 13(3): 243-248.
Chun K Y, Wu Y, Henderson G A. 2011. Magnitude estimation and source discrimination: A close look at the 2006 and 2009 North Korean underground nuclear explosions.Bull.Seismol.Soc.Am., 101(3): 1315-1329.
Douglas A, Marshall P D. 1996. Seismic source size and yield for nuclear explosions. ∥ Monitoring a Comprehensive Test Ban Treaty. Netherlands: Springer, 309-353. Fisk M D. 2006. Source spectral modeling of regional P/S discriminants at nuclear test sites in China and the former Soviet Union.Bull.Seismol.Soc.Am., 96(6): 2348-2367.Hansen R A, Ringdal F, Richards P G. 1990. The stability of RMS Lg measurements and their potential for accurate estimation of the yields of Soviet underground nuclear explosions.Bull.Seismol.Soc.Am., 80(6B): 2106-2126.
Hong T K, Baag C E, Choi H, et al. 2008. Regional seismic observations of the 9 October 2006 underground nuclear explosion in North Korea and the influence of crustal structure on regional phases.J.Geophys.Res.:SolidEarth(1978—2012), 113(B3),doi: 10.1029/2007JB004950.Hong T K, Rhie J. 2009. Regional source scaling of the 9 October 2006 underground nuclear explosion in North Korea.Bull.Seismol.Soc.Am., 99(4): 2523-2540.
Jia J, Zhou S Y, Meng X S, et al. 2011. Study on Pn-wave velocity structure in the northeast China.JournalofDisasterPreventionandReduction(in Chinese), 27(2): 53-59.Kim T S, Kang I B, Kim G Y. 2009. Yield ratio estimates using regional Pnand Pgfrom North Korea′s underground nuclear explosions.Geophys.Res.Lett., 36(22), doi:10.1029/2009GL040495.Kim W Y, Richards P G. 2007. North Korean nuclear test: Seismic discrimination low yield.Eos, 88(14): 158-161.
Koper K D, Herrmann R B, Benz H M. 2008. Overview of open seismic data from the North Korean event of 9 October 2006.SeismologicalResearchLetters, 79(2): 178-185.
Mayeda K. 1993. mb(LgCoda): A stable single station estimator of magnitude.Bull.Seismol.Soc.Am., 83(3): 851-861.
Mayeda K, Walter W R. 1996. Moment, energy, stress drop, and source spectra of western United States earthquakes from regional coda envelopes.J.Geophys.Res.:SolidEarth(1978—2012), 101(B5): 11195-11208.
Mayeda K, Hofstetter A, O′Boyle J L, et al. 2003. Stable and transportable regional magnitudes based on coda-derived moment rate spectra.Bull.Seismol.Soc.Am., 93(1): 224-239. Mueller R A, Murphy J R. 1971. Seismic characteristics of underground nuclear detonations, Part I: Seismic-spectrum scaling.Bull.Seismol.Soc.Am., 61(6): 1675-1692.
Murphy J R, Barker B W. 2001. Application of network-averaged teleseismic P-wave spectra to seismic yield estimation of underground nuclear explosions.PureandAppliedGeophysics, 158(11): 2123-2171. Murphy J R, Kohl B C, Stevens J L, et al. 2010. Exploitation of the IMS and other data for a comprehensive, advanced analysis of the North Korean nuclear tests. ∥ Proceedings of the 2010 Monitoring Research Review: Ground-Based Nuclear Explosion Monitoring Technologies 1. 456-465.
Murphy J R, Kohl B C, Stevens J L, et al. 2011. Supplemental analysis of the seismic characteristics of the 2006 and 2009 North Korean nuclear tests. ∥ Proceedings of the 2010 Monitoring Research Review: Ground-Based Nuclear Explosion Monitoring Technologies 3. 513-523. Murphy K R, Mayeda K, Walter W R. 2009. Lg-coda methods applied to Nevada Test Site events: Spectral peaking and yield estimation.Bull.Seismol.Soc.Am., 99(1): 441-448.
Murphy J R, Stevens J L, Kohl B C, et al. 2013. Advanced seismic analyses of the source characteristics of the 2006 and 2009 North Korean nuclear tests.Bull.Seismol.Soc.Am., 103(3): 1640-1661.
Ni S D, Helmberger D, Pitarka A. 2010. Rapid source estimation from global calibrated paths.SeismologicalResearchLetters, 81(3): 498-504.
Nuttli O W. 1973. Seismic wave attenuation and magnitude relations for eastern North America.J.Geophys.Res., 78(5): 876-885. Nuttli O W. 1986a. Yield estimates of Nevada test site explosions obtained from seismic Lg waves.J.Geophys.Res.:SolidEarth(1978—2012), 91(B2): 2137-2151.Nuttli O W. 1986b. Lg magnitudes of selected East Kazakhstan underground explosions.Bull.Seismol.Soc.Am., 76(5): 1241-1251.Pasyanos M E, Walter W R, Mayeda K M. 2012. Exploiting regional amplitude envelopes: a case study for earthquakes and explosions in the Korean Peninsula.Bull.Seismol.Soc.Am., 102(5): 1938-1948.
Patton H J. 1988. Application of Nuttli′s method to estimate yield of Nevada Test Site explosions recorded on Lawrence Livermore National Laboratory′s digital seismic system.Bull.Seismol.Soc.Am., 78(5): 1759-1772.
Patton H J, Taylor S R. 2008. Effects of shock-induced tensile failure on mb-Ms discrimination: Contrasts between historic nuclear explosions and the North Korean test of 9 October 2006.Geophys.Res.Lett., 35(14),doi: 10.1029/2008GL034211.Pei S P. 2002. Pn & Sn tomography of uppermost mantle in China [Ph. D. thesis] (in Chinese). Beijing: Institute of Geophysics, China Earthquake Administration.
Pei S P, Xu Z H, Wang S Y. 2004a. Discussion on origin of Pn velocity variation in China and adjacent region.ActaSeismologicaSinica(in Chinese), 6(1): 1-10.Pei S P, Xu Z H, Wang S Y. 2004b. Sn wave tomography in the uppermost mantle beneath the China continent and adjacent regions.ChineseJ.Geophys. (in Chinese), 47(2): 250-256.
Ringdal F, Marshall P D, Alewine R W. 1992. Seismic yield determination of Soviet underground nuclear explosions at the Shagan River test site.Geophys.J.Int., 109(1): 65-77.
Rougier E, Patton H J, Knight E E, et al. 2011. Constraints on burial depth and yield of the 25 May 2009 North Korean test from hydrodynamic simulations in a granite medium.Geophys.Res.Lett., 38(16),doi: 10.1029/2011GL048269.
Salzberg D H. 2008. Semi-empirical yield estimates for the 2006 North Korean Explosion. Science Applications International Corp San Diego CA.
Salzberg D H, Marshall M E. 2007. Seismic source locations and parameters for sparse networks by matching observed seismograms to semi-empirical synthetic seismograms. Science Applications International Corp Mclean VA. Schlittenhardt J, Canty M, Grünberg I. 2010. Satellite Earth observations support CTBT monitoring: A case study of the nuclear test in North Korea of Oct. 9, 2006 and comparison with seismic results.PureandAppliedGeophysics, 167(4-5): 601-618.
Shin J S, Sheen D H, Kim G. 2010. Regional observations of the second North Korean nuclear test on 2009 May 25.Geophys.J.Int., 180(1): 243-250.
Tibuleac I M, von Seggern D H, Anderson J G, et al. 2008. Location and magnitude estimation of the 9 October 2006 Korean nuclear explosion using the southern Great Basin digital seismic network as a large-aperture array.Bull.Seismol.Soc.Am., 98(2): 756-767.
Vergino E S, Mensing R W. 1990. Yield estimation using regional mb(Pn).Bull.Seismol.Soc.Am., 80(3): 656-674.
Walter W R, Taylor S R. 2001. A revised magnitude and distance amplitude correction (MDAC2) procedure for regional seismic discriminants: Theory and testing at NTS. Lawrence Livermore National Laboratory (LLNL), Livermore, CA.
Wen L X, Long H. 2010. High-precision location of North Korea′s 2009 nuclear test.SeismologicalResearchLetters, 81(1): 26-29. Xie J, Wu Z, Liu R, et al. 2006. Tomographic regionalization of crustal LgQin eastern Eurasia.Geophys.Res.Lett., 33(3),doi: 10.1029/2005GL024410.
Yoo S H, Rhie J, Choi H, et al. 2011. Coda-derived source parameters of earthquakes and their scaling relationships in the Korean Peninsula.Bull.Seismol.Soc.Am., 101(5): 2388-2398.Zhang G M, Wang S Y, Wang H. 2012. Tectonic implication of crust and uppermost mantle Pnvelocity structure of eastern Asia.SeismologyandGeology(in Chinese), 34(4): 586-596.
Zhang M, Wen L X. 2013. High-precision location and yield of North Korea′s 2013 nuclear test.Geophys.Res.Lett., 40(12): 2941-2946. Zhao L F, Wang W M, Li J, et al. 2005. Yield estimation of the 11 May 1998 Indian nuclear test using relative static source strength.ChineseJ.Geophys. (in Chinese), 48(5): 1092-1097. Zhao L F. 2008. Regional seismic characteristics of the North Korean nuclear explosion and LgQtomography [Postdoctoral research report] (in Chinese). Beijing: Institute of Geology and Geophysics, Chinese Academy of Sciences.
Zhao L F, Xie X B, Wang W M, et al. 2008. Regional seismic characteristics of the 9 October 2006 North Korean nuclear test.Bull.Seismol.Soc.Am., 98(6): 2571-2589.
Zhao L F, Xie X B, Wang W M, et al. 2012. Yield estimation of the 25 May 2009 North Korean nuclear explosion.Bull.Seismol.Soc.Am., 102(2): 467-478.
Zhao L F, Xie X B, Wang W M, et al. 2014. The 12 February 2013 North Korean underground nuclear test.SeismologicalResearchLetters, 85(1): 130-134.
Zhao L F, Xie X B, Tian B F, et al. 2015. Pn wave geometrical spreading and attenuation in Northeast China and the Korean Peninsula constrained by observations from North Korean nuclear explosions.J.Geophys.Res.:SolidEarth, 120(11): 7558-7571.
Zhu T F, Chun K Y, West G F. 1991. Geometrical spreading andQof Pn waves: An investigative study in eastern Canada.Bull.Seismol.Soc.Am., 81(3): 882-896.
附中文参考文献
贾军, 周仕勇, 孟宪森等. 2011. 东北地区Pn波速度结构研究. 防灾减灾学报, 27(2): 53-59.
裴顺平. 2002. 中国大陆上地幔顶部体波速度层析成像[博士论文]. 北京: 中国地震局地球物理研究所.
裴顺平, 许忠淮, 汪素云. 2004a. 中国及邻区Pn波速度结构成因探讨. 地震学报, 6(1): 1-10.
裴顺平, 许忠淮, 汪素云. 2004b. 中国大陆及邻近地区上地幔顶部Sn波速度层析成像. 地球物理学报, 47(2): 250-256.
张国民, 汪素云, 王辉. 2012. 东亚地区上地幔顶部Pn速度结构的构造动力学意义. 地震地质, 34(4): 586-596.
赵连锋, 王卫民, 李娟等. 2005. 利用相对静力学强度测定1998年5月11日印度核爆的当量. 地球物理学报, 48(5): 1092-1097.
赵连锋. 2008. 北朝鲜核爆的区域地震特征与Lg波Q值成像[博士后出站报告]. 北京: 中国科学院地质与地球物理研究所.
(本文编辑何燕)
基金项目国家自然科学基金重点项目(41390455)资助.
作者简介林鑫,男,1988年生,博士,主要从事朝鲜地下核试验的监测和估计等相关研究. E-mail:alyssalinxin@163.com
doi:10.6038/cjg20160613 中图分类号P315
收稿日期2016-02-01,2016-04-27收修定稿
Yield and burial depth of the North Korean underground nuclear tests constrained by amplitude envelopes of regional seismic waveforms
LIN Xin1, 2, YAO Zhen-Xing2
1InstituteofGeophysics,HuazhongUniversityofScienceandTechnology,SchoolofPhysics,HuazhongUniversityofScienceandTechnology,Wuhan430074,China2KeyLaboratoryofEarthandPlanetaryPhysics,InstituteofGeologyandGeophysics,ChineseAcademyofSciences,Beijing100029,China
AbstractBoth the yield and burial depth of a nuclear explosion are important parameters of an underground nuclear explosion test. According to the regional seismic stations in northeast China, we investigate these two parameters of the North Korean nuclear tests on 9 October 2006, 25 May 2009, 13 February 2013 and 6 January 2016 by calculating the horizontal component waveforms of coda amplitude envelopes using Pn,Pg,Sn and Lg waves. As an example, we use the seismograms recorded at the Mudanjiang (MDJ) station to show the procedure of calculating amplitude envelopes by applying a bandpass filter to horizontal component waveforms. Thus, we obtain stable estimations of amplitude envelopes at regional seismic stations, from which the regional phases are apparently displayed. The time-domain amplitude envelopes of regional phases can be modeled by using source spectral function, geometric spreading, site response, transfer function and coda shape function. Based on the grid searching method, we simultaneously estimate the yields and burial depths of the North Korean nuclear tests. The results show that the yields increase from 0.6±0.2 kt to 3.0±1.5 kt and then 10.0±2.0 kt, decrease to 8.0±2.0 kt according to their origin time. The first test has a shallow burial depth of 150±100 m, for the second one, the depth is estimated to be 350±100 m, while both the 2013 and 2016 North Korean nuclear tests have very similar depths of 500±200 m. Our results are consistent with the previous findings, which suggest that the yield and burial depth of the underground nuclear explosion tests can be simultaneously constrained by using the time-domain horizontal component of amplitude envelopes at a single station or a few stations.
KeywordsRegional phase; Amplitude envelope; North Korean nuclear test; Yield of explosion; Burial depth
林鑫, 姚振兴. 2016. 利用区域地震波形振幅包络约束朝鲜地下核试验的埋深和当量.地球物理学报,59(6):2066-2079,doi:10.6038/cjg20160613.
Lin X, Yao Z X. 2016. Yield and burial depth of the North Korean underground nuclear tests constrained by amplitude envelopes of regional seismic waveforms.ChineseJ.Geophys. (in Chinese),59(6):2066-2079,doi:10.6038/cjg20160613.
