Subsurface sandstone mapping by combination of GPR and ERT method
2016-07-16FANGYuantaoFENGXuanLUQiEnhedelihaiCAOSongandYOUZhixin
FANG Yuantao, FENG Xuan, LU Qi, Enhedelihai, CAO Song and YOU Zhixin
CollegeofGeo-ExplorationScienceandTechnology,JilinUniversity,Changchun130026,China
Subsurface sandstone mapping by combination of GPR and ERT method
FANG Yuantao, FENG Xuan, LU Qi, Enhedelihai, CAO Song and YOU Zhixin
CollegeofGeo-ExplorationScienceandTechnology,JilinUniversity,Changchun130026,China
Abstract:It is important to know the shape and distribution of sandstone bodies in the subsurface when formation and migration of a dune model are determined. The information plays a significant role in identification of the continental oil and gas accumulation. In this study, the combination of ground penetrating radar (GPR) and electrical resistivity tomography method (ERT) is used in mapping the distribution of sandstone bodies in Yanchang Formation. Six GPR profiles and seven ERT profiles are used to analysis. GPR data show clear reflections from the top interface of sandstones. ERT data show a continuous high resistivity anomaly correspon-ding to the sandstone body. Combined the reconstructed 3D images by GPR and ERT, the spatial distribution of sandstone bodies is described.
Key words:sandstone distribution; Yanchang Formation; outcrops; Ground Penetrating Radar; electrical resistivity tomography
Introduction
In the past two decades, many scholars have done much work to find ways to describe sandstones. With the deepening of the oil and gas exploration, many composite oil and gas accumulation zones based on the lithological trap of sandstone bodies have been found in many basins in China. In different sedimentary systems, the features of the spatial distribution of sandstone and the changes of reservoir are different in both horizontal and vertical directions. It is a difficult issue to accurately describe the sandstone in sedimentary systems and the spatial distribution of reservoirs in the oil-gas exploration (Zhuetal., 2013).
Leclerc @ Hickin (1997) prospected the internal structure of scrolled floodplain deposits based on GPR. In 1998, Bridgeetal. carried out a study about the changing process of the geometry of sedimentary sandstones and rive channels in the area of the River Calamus, Nebraska, USA (Bridgeetal., 1998). Zhou & Lin (2002) studied the linear features of GPR in the process of exploring the fault zones in pelitic siltstone. Joletal. (2003) gave a quantitative detection and imaging about Navajo sandstone based on GPR. In addition, GPR is also used in prospecting and imaging of near-surface layers with sandbodies near the large outcrop (Stephens, 1994; Mcmechanetal., 1997; Szerbiaketal., 2001; Corbeanuetal., 2001; Corbeanuetal. 2004). Qietal. (2007) conducted GPR imaging explanation of sandbody and its slope deposit structure. Zhang (1994) experimented the sandstone reservoirs stereotype by using wire electrode powered DC resistivity method. Suoetal. (2007) use borehole-to-electrical method studied on the Xia 79th borehole in the northwestern margin of the Junggar Basin.
GPR is a geophysical method to make sure the distributional disciplines of substances in medium using high-frequency electromagnetic wave. Featured with high resolution and high efficiency, GPR is widely used in some areas of physical detection of shallow earth, such as projects, environment and sources and so on. The design of GPR system is based on electromagnetic pulse reflection principle. It sends high-frequency electromagnetic wave, in the form of wide-band and short pulse, into underground through transmitting antenna coupled with ground. When electromagnetic wave meets strata and target whose permittivity is different, part of electromagnetic wave will return to the surface of ground and be received by receiving antenna coupled with ground. The reflecting character of GPR is usually caused by the change of permittivity (seldom by the changes of permeability). However, the changes of permittivity are related to the number and type of holes and gaps in sediment, the texture structure and composition of sediment (Kowalskyetal., 2001, 2004; Luntetal., 2004a, 2004b). High-density resistivity method has effects of profiling method and electrical sounding method with short dot pitch and data acquisition of high density which can directly reflex the boundary and structure of bedrock. Both of the two methods above can describe the structure of distribution of sandstones.
We choose a river valley in Yanchang Formation, Ordos Basin as the object of study. The Yanchang Formation of Upper Triassic of Mesozoic in Ordos Basin is sediment of terrigenous clastic rock, which is mostly detritus sediments derived from rivers and lakes sedimentary environment on setting of inland basin. The Yanchang Formation is in heyday of lake basin development (Xiaetal., 2003). This paper detects local sandstone by the combined search of GPR method and high-density resistivity method and describes the distribution of sandstone in this area.
1Geological background
The research area is located in eastern area of North Shaanxi Slope in Ordos Basin which is monoclinal structure tilted slightly westward. The structure in the basin is relatively simple, mainly of which is nosing structure. The strata are very flat and dip angle is usually less than 1°(Zhaoetal., 2012a). The Yanchang Formation is detritus sediments derived from rivers and lakes sedimentary environment that deposited in the process of continuous depression of Ordos Basin and steady sedimentation. The Yanchang Formation can be divided into 5 lithologic units and 10 oil layer groups. While the first unit deposited, fluvial facies develop extensively. After that, the crust began to drop slowly which led to the gradual expansion of lacustrine facies sediment and deeper lake water, when the second unit deposited. At this stage, the range of the lake basin reaches largest degree while the climate is warm and wet and there are various creatures. All of these create favorable conditions for sedimentation of oil shale. During the sedimentation of the third, the fourth and the fifth units, crust gra-dually rised and lake basin became smaller and smaller till collapse. The development and evolution of the Yanchang Formation objectively record the history of this large fresh water basin from its formation and development to decline (Bian & Zhang, 2001; Zhaoetal., 2012b).
2Line Layout
This study chooses Swedish MALA ExPro GPR system, equipped with 25 MHz unshielded antenna. High-density resistivity method uses multifunctional electrical prospecting apparatus E60D, and measures with Wenner device.
The authors did the combined search by GPR method and high-density resistivity method within the researched area. Fig.1 shows the network of GPR and electrical method. As it shown, A-B is a survey line of GPR, NW1, whose direction is northeast and its included angle is 30°. C-D, E-F, G-H, I-J and K-L are survey lines of GPR, NW2-NW6. The spacing between two survey lines is 2 m, among which NW4 is 126 m in long and other five lines are all 87 m in long. In line with NW1, A’-B’ forms a survey line of high-density resistivity method, NW1’, towards southeast successively and the included angle is 30°. C’-D’, E’-F’, G’-H’, I’-J’, K’-L’ and M’-N’ are survey lines of high-density resistivity method, NW2’-NW7’. The spacing between two survey lines is 2 m and the length of lines is all 500 m in long.
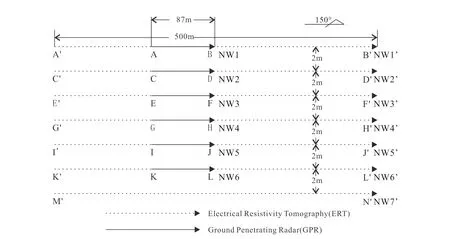
Fig.1 Location of survey lines
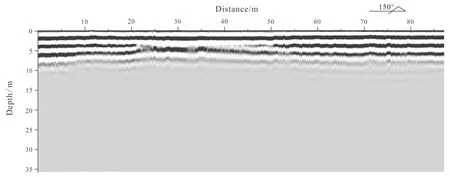
Fig.2 Original GPR data along survey line NW1
3GPR Data Processing
Among signals of GPR, the energy of direct wave is very strong. With the increase of penetration depth, the signal gradually damps while energy becomes weaker and weaker. Fig.2 is original data of survey line of GPR, NW1, which reflects a little information of shallow subsurface. The amplitude of direct wave signal is very strong, but signal of echo from deep is extremely weak and difficult to recognize. The paper deals with original data by Automatic Gain Control (AGC),background subtraction treatment, Fourier Transform, band-pass filter and time-depth conversion. As is shown in Fig.3, it is a flow chart of data processing. After data processing, the authors get data of six survey lines. Fig.4 is the result of NW1 after processing.
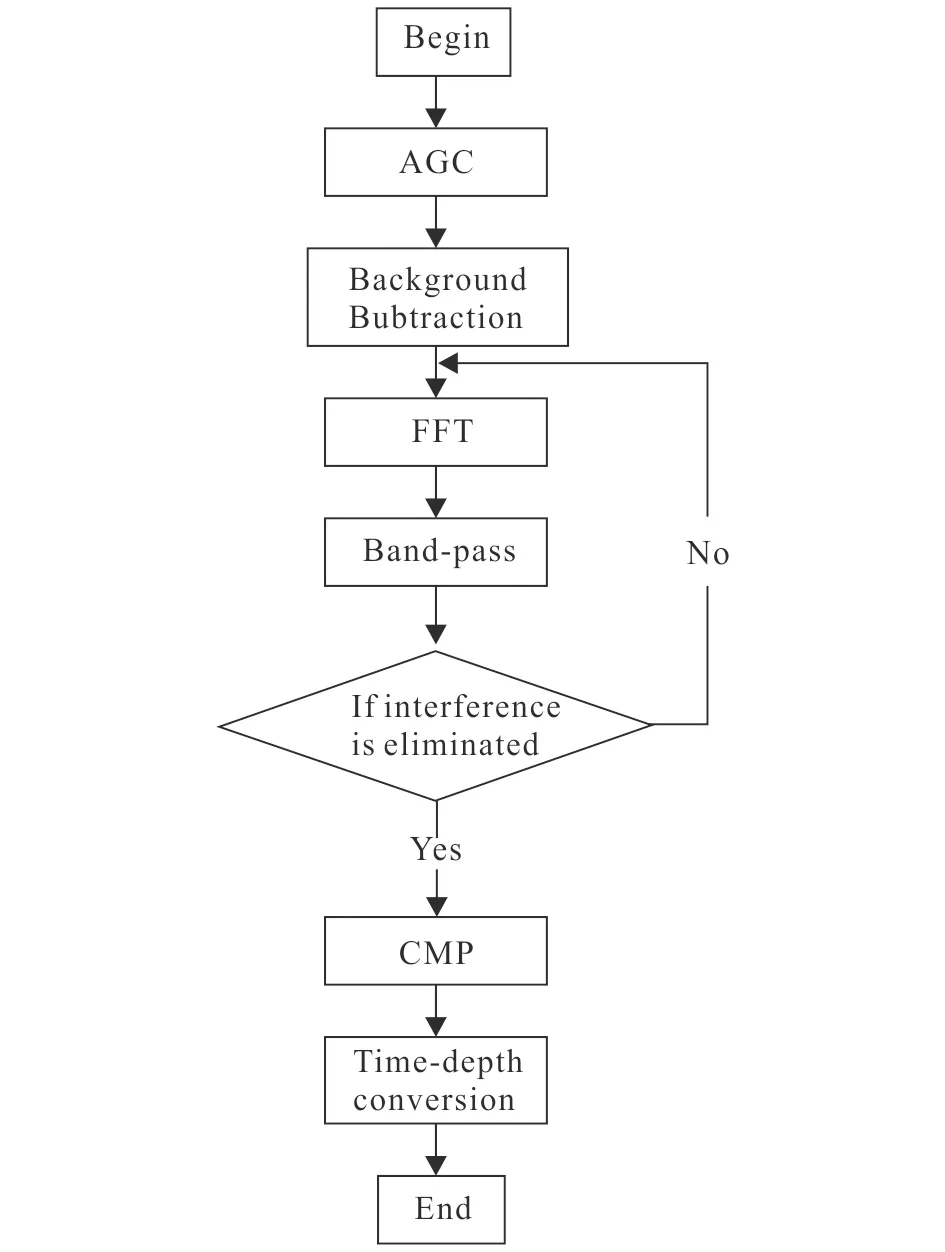
Fig.3 Flow chart of data processing
Relatively stronger reflected signal appears at depth of 5--20 m that is stratiform and the middle part is relatively thick. There are rare fault fracture zones, fissure concentrated zones, water-enriched zones or karst caves (Davisetal., 1989), so the distribution of energy punch of reflected waves from GPR is relatively balanced. This feature can be seen from the processing result in this paper.
4Data processing of high-density resistivity method
In the data inversion of high-density of high-density resistivity method, the authors use least squares constrained by roundness (deGroot-Hedlin & Constable, 1990). The advantage of this method is that damping factor and filter of roundness can adapt to data of different types after adjustment. High-density resistivity method is mainly used to make sure the boun-dary between sandstone and shale, occurrence and shape characters to accurately describe sandstone and shale with GPR. Through the pretreatment, data connection and topographical correction, the data of highdensity resistivity method is inversed by RES2DINV software. Then the result of inversion is transformed into standard figure by Surfer software.

Fig.4 Processed GPR profile along survey line NW1
Fig.5 is NW1’. It shows that the continuity of bottom layer is very good and it is a continuous sandstone layer. The thickness of low damping layer on the earth’s surface is 1 m to 3 m and resistivity of the layer 5 m to 20 m below ground is about 250 Ω·m. It is estimated that there is shale below 20 m but its resistivity is about 100 Ω·m. The layering of bottom la-yer of this area is good, which is well shown by continuously horizontal distribution of stratiform mudstone and shale. Occasionally existing thin stratiform sandstone. In the figure of resistivity, sandstone is long axis shape whose thickness is 5 m to 15 m and relative length is 20 m to 120 m.

Fig.5 2D ERT profile along survey line NW1’
5Combined Explanation of GPR and High-density resistivity method
For the distinction of mudstone, shale and sandy shale, among which, resistivity has no clear boundary and continuous high resistivity body means that the sandy shale in this area may contain much sandy composition. Three-dimensional high-density resistivity method emphasizes the trend of sandstone, and it may correspond with sandstone sediment in braided stream and meandering stream by comparison. The relationship among sandstone, mudstone and shale can be seen through two-dimensional or three-dimensional high-density resistivity method. Sandstone is wrapped by shale or mudstone and the form of stratum above sandstone is not influenced by the existence of sandstone.
The imaging of GPR is based on the differences of relative permittivity. Electromagnetic waves can be obviously reflected where there is electrical property contrast. On the images of GPR, it is expressed by black and white stripes with very high contrast. The differences of medium in electrical property caused by the differences of structure and digenetic minerals in the space between sandstone strata interfaces lead to larger reflect coefficient at the interfaces. The contrast becomes greater when there are more differences. For dividing the structure of underground sandstone layer, researchers must make sure the geological significance of reflected waves group through synthetic axis trac-king according to features of wave form and amplitude.
After processing, we get Fig.6, which is a three-dimensional sketch map from GPR and Fig.7, which is a three-dimensional sketch map from high-density resistivity method. People can see the stratiform strong reflection area that is 5 m to 20 m deep on radar profile. In comparison with Fig.7, anomalous body of sandstone above 5--20 m in Fig.6 corresponds to the high resistivity body which is 10 m deep between survey lines of 100--200 m on resistivity profile. In the background of shale, sandstone is always shown as high-resistivity body corresponding to strong reflection area in GPR data. Although the length of anomalous areas in two figures is different, the form is same. So, we can speculate that the anomalous body is underground sandstone. According to GPR data and high-density resistivity method, sandstone body is 150 m in wide and 15 m in tall. The type of aspect shows that the sandstone in the valley of the village is banding sandstone.
6Conclusions
Great progress in oil and gas exploration has been made in the Yanchang Formation of Ordos Basin and hundreds of millions of tons of geological oil reserves have been confirmed in recent years. It is important to understand the shape and distribution of sandstone bodies to identify the oil and gas accumulations in the subsurface.

Fig.6 3D image of GPR data
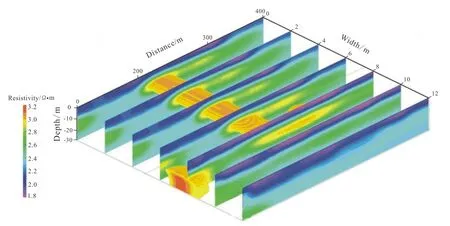
Fig.7 3D ERT image
The GPR combined with ERT method is used to map the spatial distribution of sandstone bodies in the Yanchang Formation. The GPR profiles show clear reflections from the interfaces between the sandstones and surrounding rocks and good continuity of the reflection events. The ERT data distinguish the sandstone bodies from surrounding sandy shale layers and show a continuous high resistivity anomaly correspon-ding to a large sandstone body. Combining the reconstructed 3D GPR and ERT images, the spatial distribution of sandstone bodies in Yanchang Formation can be described. The results also give the clue that it is possible to classify the mudstone, shale, and sandstone by the combination of GPR and ERT constrained with the geological information.
References
Bian R X, Zhang L P. 2001. Low-middle porous reservoir properties of Yanchang Formation in Jing’an oilfield.JournaloftheUniversityofPetroleum:EditionofNaturalScience, 25: 32-34.
Bridge J, Collier R, Alexander J. 1998. Large-scale structure of Calamus River deposits (Nebraska, USA) revealed using ground-penetrating radar.Sedimentology, 45(6): 977-986.
Corbeanu R M, Soegaard K, Szerbiak R B,etal. 2001. Detailed internal architecture of a fluvial channel sandstone determined from outcrop, cores, and 3-D ground-penetra-ting radar: example from Mid-Cretaceous ferron sandstone, east-central Utah.AmericanAssociationofPetro-leumGeologistsBulletin, 85: 1583-1608.
Corbeanu R M, Wizevich M C, Bhattacharya J P,etal. 2004. Three-dimensional architecture of ancient lower delta-plain point bars using ground-penetrating radar, Cretaceous Ferron Sandstone, Utah.AAPGStudiesinGeology, 50: 427-449.
Davis J L, Annan A P. 1989. Ground-penetrating radar for high-resolution mapping of soil and rock stratigraphy.GeophysicalProspecting, 37(5): 531-551.
deGroot-Hedlin C, Constable S. 1990. Occam’s inversion to generate smooth,two-dimensional models from magnetotelluric data.Geophysics, 55(55): 1613-1624.
Jol H M, Bristow C S, Smith D J,etal. 2003. Stratigraphic imaging of the Navajo sandstone using ground-penetrating radar.LeadingEdge, 22(9): 882-887.
Kowalsky M B, Dietrich P, Teutsch G,etal. 2001. Forward modeling of ground-penetrating radar data using digitized outcrop images and multiple scenarios of water saturation.NatureMedicine, 37(6): 1615-1625.
Kowalsky M B, Rubin Y, Dietrich P. 2004. The use of ground-penetrating radar for characterizing sediments under transient conditions.SEPMSpecialPublication, 80:107-127.
Leclerc R F, Hickin E J. 1997. The internal structure of scrolled floodplain deposits based on ground-penetrating radar, North Thompson River, British Columbia.Geomorphology, 21(1): 17-25.
Lunt I A, Bridge J S, Tye R S. 2004a. Development of a 3-D depositional model of braided river gravels and sands to improve aquifer characterization.SEPMSpecialPublication, 80: 139-169.
Lunt I A, Bridge J S, Tye R S. 2004b. A quantitative, three-dimensional depositional model of gravelly braided rivers.Sedimentology, 51: 377-414.
Mcmechan G A, Gaynor G C, Szerbiak R B. 1997. Use of ground-penetrating radar for 3-D sedimentological characterization of clastic reservoir analogs.Geophysics, 62(3): 786-796.
Qi Y L, Chen N S, Qin Q R,etal. 2007. Using ground penetrating radar image to inpterpret the structural interface in a sandstone and slope wash area: taking to use the rough terrain 50 MHz antenna of GPR antenna for surveying for example.JournalofChengduUniversityofTechnologyScience&Technology, 34(1): 97-102.
Stephens M. 1994, Architectural element analysis within the Kayenta formation (Lower Jurassic) using ground-probing radar and sedimentological profiling, southwestern Colorado.SedimentaryGeology, 90: 179-211.
Suo X D, Dong W B, Liu Z Y,etal. 2007.Using borehole-to-electrical method studied on the Xia 79th borehole in the northwestern margin,Junggar Basin.ChinaPetroleumExploration, (5): 46-50.
Szeribiak R B, Mcmechan G A, Corbeanu R,etal. 2001.3-D characterization of a clastic reservoir analog: from 3-D GPR data to a 3-D fluid permeability model.Geophysica, 66(4): 1026-1037.
Xia Q S, Tian J C, Chang J Q,etal. 2003. Reservoir character and prospecting advantageous regions in Chang-6 to Chang-8 oil-bearing layers of Triassic period at Longdong Region.Oil&GasRecoveryTechnology, 10(4): 11-15.
Zhang T L, 1994. The experiment of the sandstone reservoirs stereotype by using wire electrode powered DC resistivity method.OilGeophysicalProspecting, 29(3): 337-347.
Zhao J Z, Bai Y B, Cao Q,etal. 2012a. Quasi-continuous accumulation model of large tight sandstone gas field in Ordos Basin.ActaPetroleiScience, 33(6): 811-827.
Zhao J Z, Fu J H, Yao J L,etal. 2012b. Quasi-continuous hydrocarbon accumulation:anew pattern for large tight sand oilfields in the Ordos Basin.Oil&Geology, 33(1): 37-52.
Zhou L H, Lin G Q. 2002. The curve character of geologic radar and shallow seismicity on the fracture zone of argillacous siltstone.JournalofGeologicalHazardsandEnvironmentPreservation, 13(3): 36-39.
Zhu R K, Bai B, Yuan X J, Yuan X J,etal. 2013. A new approach for outcrop characterization and geostatistical analysis of meandering channels sandbodies within a delta plain setting using digital outcrop models Upper Triassic Yanchang tight sandstone Formation,Yanhe outcrop,Ordos Basin.ActaSedimentologica, 31(5): 867-877.
doi:10.3969/j.issn.1673-9736.2016.02.08
Article ID: 1673-9736(2016)02-0117-08
Received 25 October 2015, accepted 27 December 2015
杂志排行
Global Geology的其它文章
- Geochronology and geochemistry of Dongxigao diorite porphyries: implications for Late Neoarchean tectonic evolution of eastern North China Craton
- Genesis of lower strain S-L-type tectonites in Daqingshan area, Inner Mongolia
- Petrogenesis of Paleoproterozoic diorite porphyries in Luojiazhuang, western Shandong: constraints from LA-ICP-MS zircon U-Pb geochronology and geochemistry
- Comparison of finite difference and pseudo-spectral methods in forward modelling based on metal ore model of random media
- Study of formation boundary and dip attribute extraction based on edge detection technology
- Rock physics and seismic modeling of shale reservoirs with horizontal fractures
