Rock physics and seismic modeling of shale reservoirs with horizontal fractures
2016-07-16LIUXiwuDONGNingandGUOZhiqi
LIU Xiwu, DONG Ningand GUO Zhiqi
1.SinoPECExploration&ProductionResearchInstitute,Beijing100083,China;2.SinoPECKeyLaboratoryofShaleOil/GasExplorationandProductionTechnology,Beijing100083,China;3.NationalKeyLaboratoryofCorporationofShaleOil/GasEnrichmentMechanismandEffectiveDevelopment,SinoPEC,Beijing100083,China;4.CollegeofGeo-ExplorationScienceandTechnology,JilinUniversity,Changchun130026,China
Rock physics and seismic modeling of shale reservoirs with horizontal fractures
LIU Xiwu1,2,3, DONG Ning1,2,3and GUO Zhiqi4*
1.SinoPECExploration&ProductionResearchInstitute,Beijing100083,China;2.SinoPECKeyLaboratoryofShaleOil/GasExplorationandProductionTechnology,Beijing100083,China;3.NationalKeyLaboratoryofCorporationofShaleOil/GasEnrichmentMechanismandEffectiveDevelopment,SinoPEC,Beijing100083,China;4.CollegeofGeo-ExplorationScienceandTechnology,JilinUniversity,Changchun130026,China
Abstract:The presence of horizontal fractures enhances seismic anisotropy of shales. Calculation based on the effective medium theory indicates that horizontal fractures have little effects on velocities along the direction pa-rallel to fractures, but can significantly reduce velocities along the direction normal to fractures. Seismic responses of shales with horizontal fractures are calculated based on the reflector model and the anisotropic propagator matrix method, in which the reflections are a combination of the contrast in impedance due to the variations in fracture density, anisotropic propagation of waves within the shales, and the tuning and interferences associated with layer thickness. Calculated results indicate that seismic reflections are sensitive to reservoir layer thickness and fracture density. Anisotropic propagation alters amplitudes and phases of reflections. It corresponds to higher reflection amplitudes for the case of surrounding sandstone with higher velocity because the increase in fracture density increases the contrast in impedance between the shale and sandstone. In contrast, the surrounding sandstone with lower velocity corresponds to lower reflection amplitudes for the increase in fracture density.
Key words:shale; horizontal fractures; reflector model; propagator matrix method; AVO
0Introduction
Exploration and exploitation of shale gas and oil need better understanding on geophysical responses from shale reservoirs (Liuetal., 2011). Laboratorial studies on cores reveal that the shale represents anisotropy (Dengetal., 2004; Wangetal., 2012; Chenetal., 2013a; Xiongetal., 2014). Meanwhile, natural fracture systems existing in shale reservoirs behave as important spaces for accumulation and pathways for fluids flowing, and therefore are critical parameters for reservoir characterization and hydro-fracturing. The degree that a shale reservoir is fractured and the distribution of the fractures are important criteria for locating sweet spot in a shale reservoir (Lietal., 2007; Wuetal., 2011; Chenetal., 2013b). Recently, core studies in laboratory indicate that the horizontal fracture parallel to bedding is one of the dominant patterns of natural fracture systems. The presence of ho-rizontal fractures enhances shale anisotropy, and correspondingly, the following issues need to be consi-dered for seismic description and characterization of horizontal fractures: first, rock physics modeling that relates micro fractures to macro anisotropy parameters; second, seismic modeling and analyzing in the presence of horizontal fractures in a shale reservoir.
Previous studies on shale rock physics modeling methods include Backus averaging theory (Vernik & Nur, 1992; Vernik & Liu, 1997), anisotropic self-consistent approach (SCA) and differential effective medium (DEM) theory (Hornbyetal., 1994), and the theories developed by Hudson and Schoenberg (Hudson, 1981; Hudson, 1986; Hudson, 1991; Schoenberg & Douma, 1988; Schoenberg & Helbig, 1997). Recent studies include further development and applications of the above methods (Carcione, 2000; Sayers, 2005; Bayukelal., 2007; Ortegaetal., 2009; Vernik & Milovac, 2011; Carcioneetal., 2011; Huetal., 2014). As to the aspect of modeling of seismic responses from shales, current researches include simulation of seismic waves that propagate in shales base on wave equations (Sunetal., 2013; Zhouetal., 2014), or amplitude variations versus offset (AVO) modeling for the top and bottom of shales based on the interface refection theory (Wensaasetal., 2012; Gradingetal., 2012; Sayers, 2013), and corresponding inversion method based on these methods (Wang, 2007; Houetal., 2014; Zhangetal., 2014).
The transversely isotropy with a vertical symmetry axis (VTI) is different from the transversely isotropy with a horizontal symmetry axis (HTI). The VTI medium does not represent azimuthal anisotropy as shown by the HTI medium. Seismic responses from a shale reservoir is a combination of reflections from the top and bottom, and anisotropic propagation within the shale, which need to be incorporated for the study of seismic signatures from shales with horizontal fractures. In this paper, we research on seismic responses associated with horizontal fractures of shale reservoirs. First, we implement rock physics modeling based on the effective medium theory to calculate elastic anisotropy for varied fracture density of horizontal fractures. Then, we compute frequency-dependent reflection coefficients and AVO waveforms based on the reflector model and the propagation matrix method, and analyze the effects of layer thickness and horizontal fracture density on seismic features.
1Effective medium model for horizontal fracture
In Fig.1, core images indicate that horizontal fractures parallel to bedding are dominant types of fractures.
In this study, we use the effective medium proposed by Schoenberg to calculate the stiffness matrix for horizontal fractures (Schoenberg & Douma, 1988; Schoenberg & Helbig, 1997):
(1)
The results produce the HTI anisotropy. Because a shale rock represents VTI anisotropy at the macro-scale due to the presence of horizontal fractures, the resulted HTI can be further transferred to the VTI anisotropy by rotating the system 90° by thex2axis according to the Bond matrix method.
The theory assumes that the scale of fractures is much less than that of seismic wavelength, giving coefficients in the stiffness matrix shown as:
(2)
c22=c33

(3)
(4)
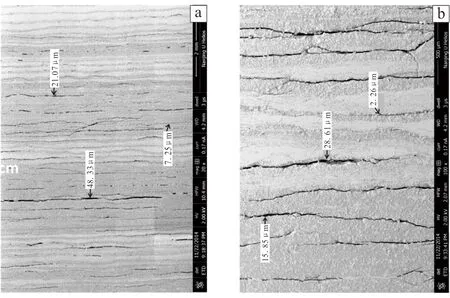
Fig.1 Core images of shales
Whereλandμare Lamé paremeters,εis fracture density, andU11andU33depend on the saturated fluid. For dry fractures, we have
and for fluid-saturated fractures,
where
WhereK′ andμ′ are bulk and shear modulus of fluids saturated in the fractures, andαis the aspect ratio of the fractures.
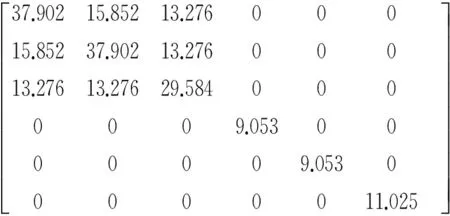
As shown in Table1, we assume that unfractured background matrix hasVp=4 000 m·s-1,Vs=2 100 m·s-1, andρ=2 500 kg·m-3. We also assume that gas mainly existed in the clay and kerogen and fluids saturated in the fractures are brine. According to the effective medium theory, we obtain the stiffness matrix forε= 0.1:
(14)

Table 1 Elastic properties of rocks
Fig.2 illustrates P-wave velocity and Thomsen anisotropy parameters varying with fracture density. In Fig.2a, P-wave velocityV33that is normal to the horizontal fractures decreases dramatically with increasing fracture densityε, while P-wave velocityV11that is parallel to the horizontal fractures is less affected by the fractures. In Fig.2b, anisotropy parameters represent nearly linearized increases with fracture density. Hence, the variations in anisotropic velocities due to the presence of horizontal fracture density will lead to the variations in seismic responses.
2Seismic responses of horizontal fractures in shales
2.1Reflection coefficients of anisotropic layered medium
Anisotropic propagation matrix method can be employed to calculate AVO responses of a shale reservoir that represents layered structure (Carione, 2001; Ursin & Stovas, 2002; Guo, 2008; Guoetal., 2015). The method obtains reflection coefficients in the frequency domain on the basis of the continuation of stress and displacement across interfaces. For P-wave incidence, the vector of reflection and transmission coefficients r=[RPP,RPS,TPP,TPS]Tis given by:

(a) Anisotropic P-wave velocity; (b) thomsen anisotropy parameters.Fig.2 Velocities and anisotropy parameters
(15)
Where, the matrices A1and A2are associated with the elastic modulus of the upper and lower media. Bα=T(0)T-1(hα) (α=1,…,N) is the propagation matrix of the interbedded layer that has a N-layer structure. Andhαis the thickness for an individual layer, withN=1 for a single layer. iPis the P-wave incidence vector that is related to elastic properties of the incidence medium. These parameters are all the function of the frequency of the incidence wave and the wave slowness (or incidence angle). Therefore, reflection coefficients are associated with incidence angle, elastic properties, and the frequency of the incidence wave, layer thickness, as well as interbedded structures.
In the equation (15), the propagation matrices A1and A2for the upper and lower media are
(16)
(17)

In the propagation matrixes (16) and (17), the vertical slownessszis calculated from the horizontal slownesssx, with the simplified form by omitting subscripts given by
(18)
where
The symbol ± in equation (18) is defined by:
(+,-):downward qP wave
(+,+):downward qS wave
(-,-):upward qP wave
(-,+):upward qS wave
The horizontal slownesssxis given by
(19)
E={[(c33-c55)cos2θ-(c11-c55)sin2θ]2+(c13+c55)2sin22θ}1/2
Whereθis the incidence angle,ρis density, andc11,c33,c55andc13are anisotropic stiffnesses for corresponding layer.
In the propagation matrixes (16) and (17),β,γ,WandZhave the simplified forms by omitting subscripts
Wherep.v. indicates principle values of a complex number. Forγ, the symbol “+” corresponds to the quasi P--wave and “-” corresponds to the quasi S--wave.
In the equation (15), the matrix T in the propagation matrix Bα=T(0)T-1(hα) for the interbedded layer has the form of
(24)
Finally, the P-wave incidence vector is
(25)
2.2Numerical modeling and analysis
Then we calculate and analyze seismic responses for the reflector model shown in Fig.3. In the model, a shale reservoir is imbedded within a sandstone background. As show in Fig.3, the shale reflector is a layer with a finite thickness and represents VTI anisotropy within it. For the shale with a layer thickness much larger than seismic wavelength (model A in Fig.3), reflections from the top and bottom can be discriminated, and therefore the model can be regarded as a single interface. While for shale with a layer thickness that can be comparable to seismic wavelength (model B in Fig.3), reflections are the combination of the dynamic factors including the contrast in wave impedance across the interface, internal anisotropic propagation of waves, as well as tuning and interferences of top and bottom reflections. In this case, seismic responses contain structural and lithological information such as layer thickness and fracture density, and consequently, a single interface can no longer be a proper model. Moreover, lateral variations in layer thickness and horizontal fracture density (model C in Fig.3) will lead to the variations in seismic reflections.
First, the model considers the low velocity sandstone 1 given in Table 1, and assumes that the shale layer is thick and has a horizontal fracture densityε=0.1. Fig.2 illustrates the variations of anisotropy parameters for varied horizontal fracture density. Based on the anisotropic propagation matrix method, we calculate reflection coefficients at each individual frequency within the range of 1--100 H, with the calculated results given by Fig.4a. As can be seen, reflection coefficients show no variations with frequency for the single interface model of the thick shale. Fig.5 shows a Ricker wavelet with a dominant frequency of 35 Hz. Reflection spectrum in Fig.4b can be obtained by multiplying the spectrum of wavelet with that of reflection coefficients in the frequency domain. Finally, AVO waveforms in Fig.4c can be obtained by inverse Fourier transform.

(a) Anisotropic P-wave velocity; (b) thomsen anisotropy parameters.Fig.3 Models of shale with horizontal fractures, comparing between single interface and reflector model
For the cases in Fig.6, shale reservoirs have va-ried layer thicknesshand horizontal fracture densityε. In Fig.6, the parameters are set to beh=20 m andε=0.1. Due to tuning effect resulting from layered structures, reflection coefficients in Fig.6a represent frequency-dependency and reflection spectrum shows increasing amplitudes in Fig.6b. In Fig.6c, reflected waveforms are much different from the incidence Ricker wavelet due to the effect of tuning associated with top and bottom reflections and internal anisotropic propagation of waves. In Fig.7, the parameters are set to beh=50 m andε=0.2. Compared to the case in Fig.6, layer thickness increases and horizontal fracture becomes predominant, which alter seismic reflection signatures. In Fig.7a, reflection coefficients of PP waves tend to show more obvious frequency-dependency. Correspondingly, reflection spectra in Fig.7b and reflected waveforms in Fig.7c become more complicated. In this case, AVO curves or attributes at a single frequency can not properly describe seismic responses of a shale reservoir, because the reflected waves contain structural and lithological information such as layer thickness and fractures.

(a) PP reflection coefficients; (b) PP wave spectrum; (c) PP wave waveforms.Fig.4 Single interface model of a low velocity sandstone with fracture density ε=0.1
Fig.7 show the variations of the stacked waveforms with layer thickness and horizontal fracture density of shales. In Fig.7a, the horizontal fracture density is kept asε=0.1, with layer thicknesshincrease from 10 m to 70 m. We can see that the reflected waveforms and corresponding amplitudes tend to become more complicated due to interferences of the top and the bottom reflections, and internal anisotropic propagation. In Fig.7b, layer thickness is kept ash= 40 m, with fracture densityεincreases from 0 to 0.3. In this case, reflection amplitudes decrease dramatically. This is because that the increase in horizontal fracture density reduces vertical velocity of the shale (Fig.2a), and therefore decreases the contrast in wave impedance between the shale and sandstone layer, and consequently decreases the strength of the reflection amplitudes. At the same time, the increase in fracture density enhances anisotropy (Fig.2b), which can further alter anisotropic propagations and change phases of reflection waves. According to the results in Fig.7, it can be predicted that the variations in both layer thickness and horizontal fracture density will change reflected waveforms, and the variations in such reflection signatures can be used for the development of anisotropy prediction for shales.

(a) Ricker wavelet in time domain; (b) ricker wavelet spectrum.Fig.5 Ricker wavelet
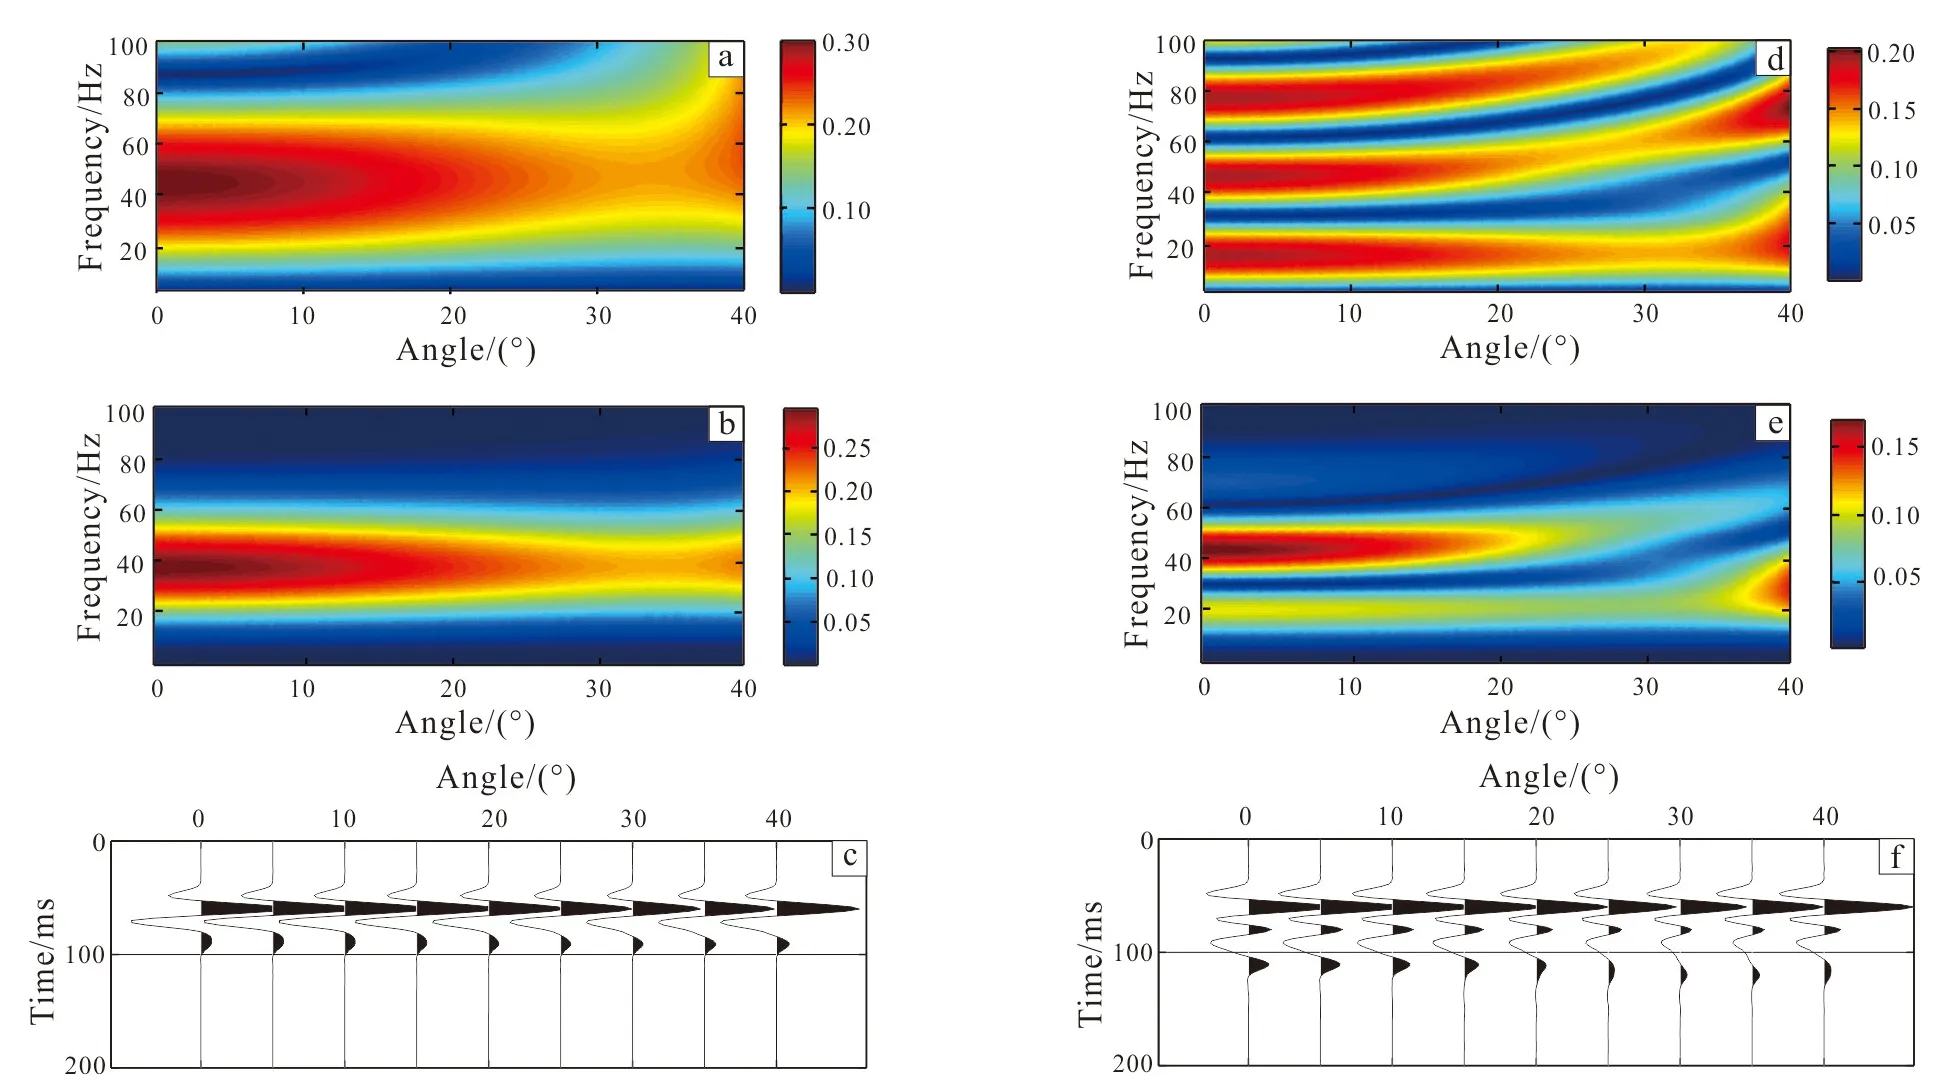
(a), (d): PP reflection coefficients; (b), (e): spectrum; (c), (f): PP waveforms. (a)-(c): thickness h=20 m and fracture density ε=0.1; (d)-(e): thickness h=50 m and fracture density ε=0.2.Fig.6 Results for a low velocity sandstone in different thickness and fracture density

Fig.7 Stacked PP waves for the low velocity sandstone
Figs. 7--9 correspond to mode 2 of the high velocity sandstone in Table 1. The upper interface represents negative impedance contrast which leads to reversal phases of reflected waves, while lower interface represents positive impedance contrast which makes the reflected waves have the same phase as the
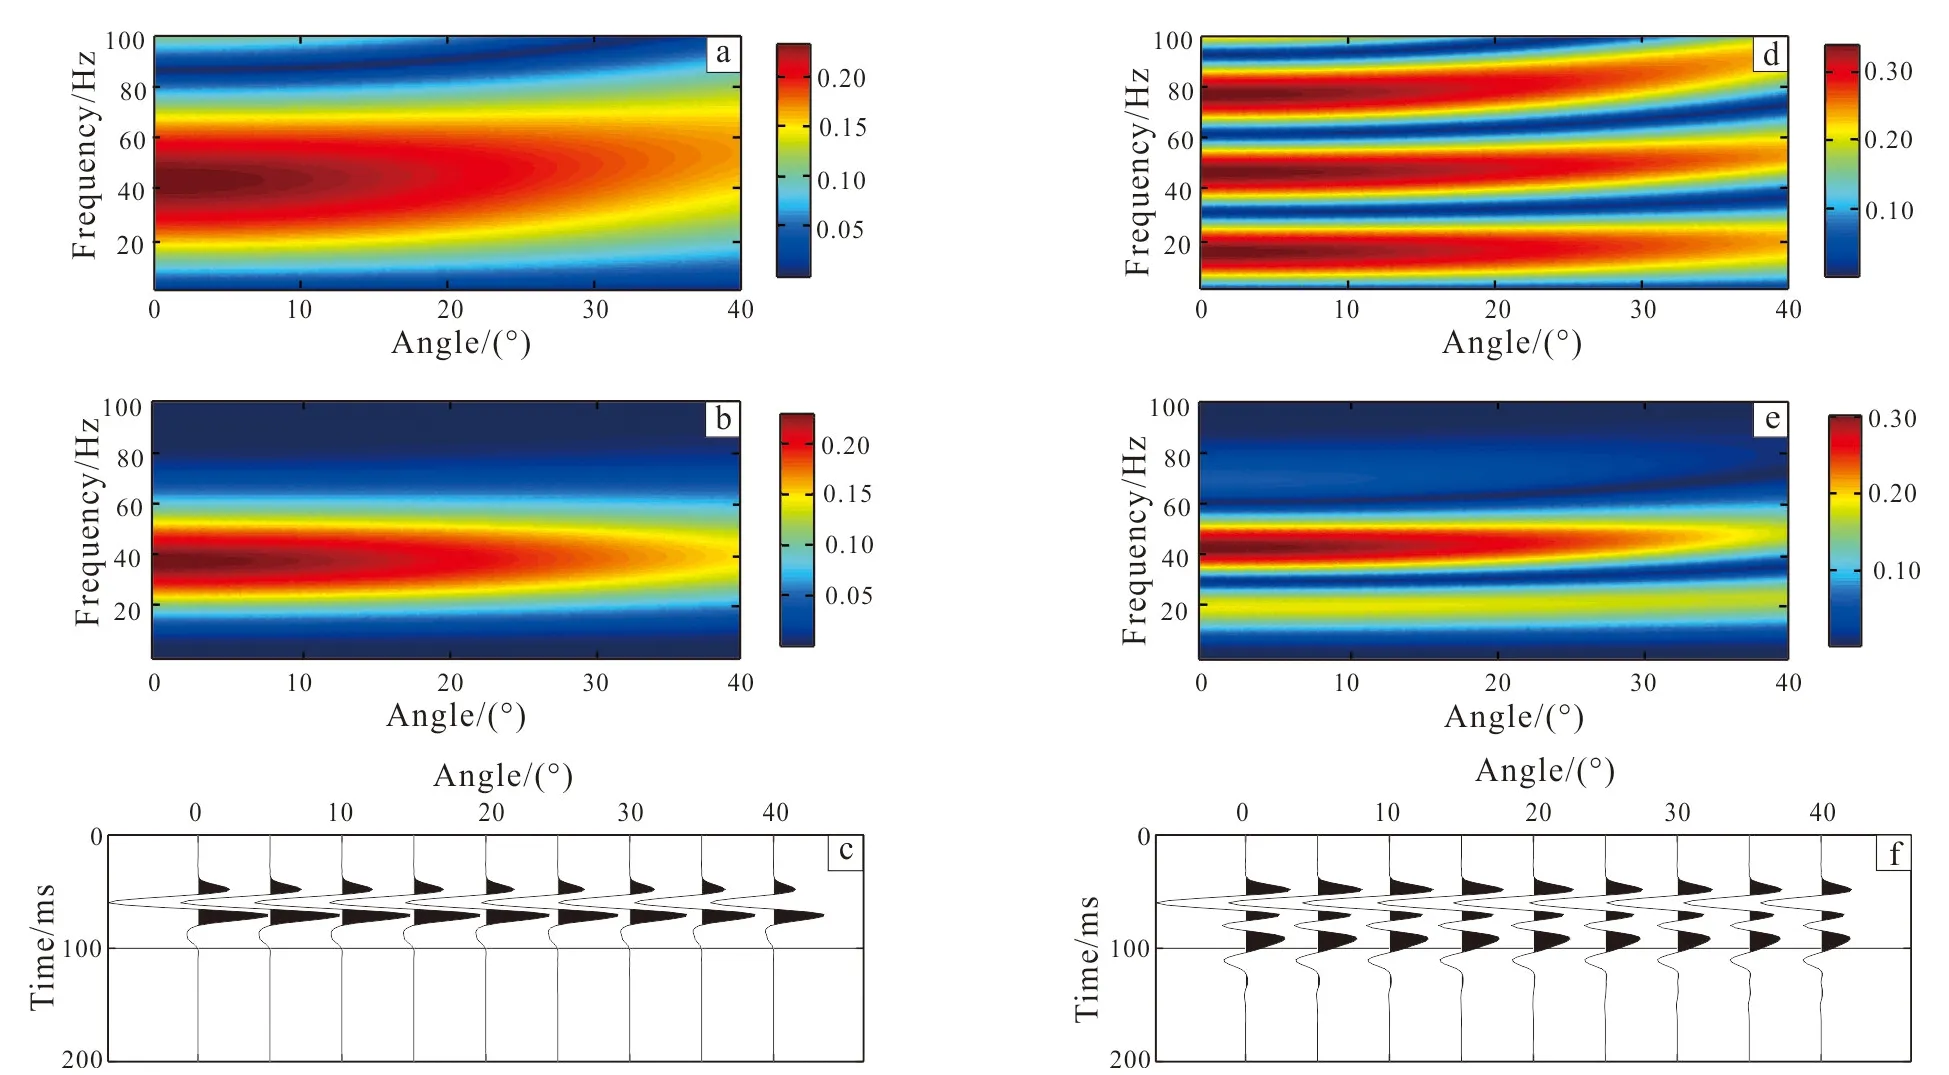
(a),(d): PP reflection coefficients; (b),(e): spectrum; (c),(f): PP waveforms. (a)-(c): thickness h=20 m and fracture density ε=0.1; (d)-(f): thickness h=50 m and fracture density ε=0.2.Fig.8 Results for a high velocity sandstone with different thickness and fracture density

Fig.9 Stacked PP waves for high velocity sandstone
incidence wave. Therefore, the study on the contrast in the impedance across the boundaries, anisotropic propagation, and tuning and interference associated with top and bottom reflections needs to consider the integrated reflected wavetrains rather than in terms of conventional AVO types. Fig.9a illustrates the variations in the stacked waveforms with layer thickness. Fig.9b shows that reflection amplitudes crease with horizontal fracture density.
3Discussions and conclusions
In this study, we have calculated seismic responses of shales with horizontal fractures based on reflector model and anisotropic propagation matrix theory. The method computes reflection coefficients at each seismic frequency, and then reflected AVO waveforms, and incorporates dynamic information of seismic responses from the reflector model, which include impedance contrast across interfaces, internal anisotropic propagation of waves due to the variations in horizontal fracture density, as well as tuning and interference associated with layered structures.
Results indicate that the variations in layer thickness and horizontal fracture density can significantly alter signatures of seismic reflection. Internal anisotropic propagation in a shale reservoir changes amplitudes and phases of reflections, and such effect becomes more obvious for thick shale layer. On the other hand, according to the effective medium theory developed by Schoenberg(1988), the increase in horizontal fracture density has less impact on seismic velocity at the direction parallel to the fractures, while dramatically reduces velocity normal to the fractures, and therefore decreases impedance of shales. In this study, for the model where the surrounding is high velocity sandstone, the increase of horizontal fracture density increases the contrast in impedance between shale and the surrounding, and results in higher reflection amplitudes. On the contrary, for the model where the surrounding is low velocity sandstone, the increase in horizontal fracture density corresponds to smaller reflection amplitudes.
Seismic modeling method for shales with horizontal fractures and corresponding analysis form the basis for further development of inversion method, and the next researches should include seismic prediction of horizontal fractures using amplitudes and phases of the integrated wavetrains reflected from the target reservoirs.
References
-Bayuk I O, Ammerman M, Chesnokov E M. 2007. Elastic moduli of anisotropic clay.Geophysics, 72(5): D107-D117.
Carcione J M. 2000. A model for seismic velocity and attenuation in petroleum source rocks.Geophysics, 65(4): 1080-1092.
Carcione J M. 2001. AVO effects of a hydrocarbon source-rock layer. Geophysics, 66(2): 419-427.
Carcione J M, Helle H B, Avseth P. 2011, Source-rock seismic-velocity models: Gassmann versus Backus.Geophy-sics, 76(5): N37-N45.
Chen Q, Liu X J, Liu H,etal. 2013a. An experimental study of ultrasonic penetration through bedding shale reservoirs.NatureIndustry, 33( 8): 140-144.
Chen Q, Tan Y H, Wang L S,etal. 2013b. Reservoir physical characteristics of shale gas in Longmaxi formation in southeastern Chongqing.Science&TechnologyReview, 31(36): 15-19.
Deng J X, Shi G, Liu R X,etal. 2004. Analysis of the velo-city anisotropy and its affection factors in shale and mudstone.ChineseJournalofGeophysics, 47(5): 862-868.
Gading M, Wensaas L, Løseth H. 2012. Source Rocks from Seismic (SRfS) Part II-Applications//74th EAGE Confe-rence & Exhibition, Extended Abstracts: 1974-1951.
Guo Z Q. 2008. Wave field modeling in viscoelastic anisotropic media and reservoir information study: PhD thesis. Changchun: Jilin University. (in Chinese with English abstract)
Guo Z Q, Liu C, Li X Y. 2015. An improved method for the modeling of frequency dependent amplitude versus offset variations.IEEEGeoscienceandremotesensingletters, 12(1): 63-67.
Hornby B E, Schwartz L M, Hudson J A. 1994. Anisotropic effective-medium modeling of the elastic properties of shales.Geophysics, 59(10): 1570-1583.
Hou D J, Liu Y, Ren Z M,etal. 2014. Multi-wave prestack joint inversion in VTI media based on Bayesian theory.GeophysicalProspectingforPetroleum, 53(3):294-303.
Hu Q, Chen X H, Li J Y. 2014. Shear wave velocity prediction for shale gas reservoirs based on anisotropic rock physics model.GeophysicalProspectingforPetroleum, 53(3): 254-261.
Hudson J A. 1981. Wave speeds and attenuation of elastic waves in material containing cracks.GeophysicalJournaloftheRoyalAstronomicalSociety, 64(1): 133-150.
Hudson J A. 1986. A higher order approximation to the wave propagation constants for a cracked solid.GeophysicalJournaloftheRoyalAstronomicalSociety, 87(1): 265-274.
Hudson J A. 1991. Crack distributions which account for a given seismic anisotrioy.GeophysicalJournalInternatio-nal, 104(3): 517-521.
Li J X, Hu S Y, Cheng K M. 2007. Suggestions from the development of fractured shale gas in North America.PetroleumExplorationandDevelopment, 34(4): 392-400.
Liu Z W, Sa L M, Yang X,etal. 2011. Needs of geophysical technologies for shale gas exploration.OilGeophysicalProspecting, 46(5): 810-818.
Ortega J A, Ulm F J, Abousleiman Y. 2009. The nanogranular acoustic signature of shale.Geophysics, 74(3): D65-D84.
Sayers C M. 2005. Seismic anisotropy of shales.GeophysicalProspecting, 53: 667-676
Sayers C M. 2013. The effect of kerogen on the AVO responses of organic-rich shales.TheLeadingEdge, 32(12): 1514-1519.
Schoenberg M, Douma J. 1988. Elastic wave propagation in media with parallel fractures and aligned cracks.Geophy-sicalProspecting, 36(6): 571-590.
Schoenberg M, Helbig K. 1997. Orthorhombic media: modeling elastic wave behavior in a vertically fractured earth.Geophysics, 62(6): 1954-1974.
Sun W J, Fu L G, Guan X Z,etal. 2013. A study on anisotropy of shale using seismic forward modeling in shale gas exploratio.ChineseJournalofGeophysics, 56(3): 961-970.
Vernik L, Liu X. 1997. Velocity anisotropy in shales: A petrophysical study.Geophysics, 62(2): 521-532.
Vernik L, Milovac J. 2011. Rock physics of organic shales.TheLeadingEdge, 30(3): 318-323.
Vernik L, Nur A. 1992. Ultrasonic velocity and anisotropy of hydrocarbon source rocks.Geophysics, 57(5): 727-735.
Ursin B, Stovas A. 2002. Reflection and transmission responses of a layered isotropic viscoelastic medium.Geophysics, 67(1): 307-323.
Wang M C. 2007. Method and application of multiwave prestack joint inversion lithologic parameters in VTI media: PhD thesis. Chengdu: Chengdu University of Technology. (in Chinese with English abstract)
Wang Q, Wang P, Xiang D G,etal. 2012. Anisotropic property of mechanical parameters of shales.NaturalGasIndustry, 32(12): 62-65.
Wensaas L, Gading M, Løseth H. 2012. Source Rocks from Seismic (SRfS) Part I-Fundamentals// 74th EAGE Conference & Exhibition, Extended Abstracts,: 1942-1946
Wu L M, Ding W L, Zhang J C,etal. 2011. Fracture prediction of organic-enriched shale reservoir in lower Silurian Longmaxi Formation of southeastern Chongqing area.JournalofOilandGasTechnology, 33(9): 43-46.
Xiong J, Liang L X, Liu X J,etal. 2014. Experimental study on acoustic penetration through the Longmaxi formation shale rock in south region of Sichuan basin.ChineseJournalofUndergroundSpaceandEngineering, 10(5): 1072-1077.
Zhang G Z, Du B Y, Li H S,etal. 2014. The method of joint pre-stack inversion of PP and P-SV waves in shale gas reservoirs.ChineseJournalofGeophysics, 57(12): 4141-4149.
Zhou J J, Wang D L, Jin S,etal. 2014. Research on seismic wavefield propagation characteristics in shale medium containing tilt fracture.GeophysicalProspectingforPetroleum, 53(5): 501-508.
doi:10.3969/j.issn.1673-9736.2016.02.04
*Corresponding author(Email: guozhiqi@jlu.edu.cn)
Article ID: 1673-9736(2016)02-0085-10
Received 20 November 2015, accepted 7 March 2016
Supported by the National Natural Science Foundation of China (Nos. 41404090 and U1262208), the foundation of 973 Program (No. 2012CB214806) and the SinoPEC Key Laboratory of Shale Oil/Gas Exploration and Production Technology (No. G5800-15-ZS-WX039).
杂志排行
Global Geology的其它文章
- Geochronology and geochemistry of Dongxigao diorite porphyries: implications for Late Neoarchean tectonic evolution of eastern North China Craton
- Genesis of lower strain S-L-type tectonites in Daqingshan area, Inner Mongolia
- Petrogenesis of Paleoproterozoic diorite porphyries in Luojiazhuang, western Shandong: constraints from LA-ICP-MS zircon U-Pb geochronology and geochemistry
- Comparison of finite difference and pseudo-spectral methods in forward modelling based on metal ore model of random media
- Study of formation boundary and dip attribute extraction based on edge detection technology
- Subsurface sandstone mapping by combination of GPR and ERT method
