TC-1在近磁尾观测到地向流的偏转
2016-06-30马玉端杨建庞学霞
马玉端, 杨建, 庞学霞,2
1 北京航空航天大学空间与环境学院, 北京 100191 2 河北大学物理科学与技术学院, 河北省光电信息材料重点实验室, 河北保定 071002
TC-1在近磁尾观测到地向流的偏转
马玉端1, 杨建1, 庞学霞1,2
1 北京航空航天大学空间与环境学院, 北京100191 2 河北大学物理科学与技术学院, 河北省光电信息材料重点实验室, 河北保定071002
摘要使用TC-1卫星在2004年到2007年磁尾探测数据,将以往高速流的研究拓宽到较低的速度,统计分析其从-13.4RE到-5RE地心距离内的空间演化. 研究发现: (1) 在向着地球运动的过程中,地向流发生率在日地连线附近减小,但在晨昏两翼的发生率增加,且在黄昏侧的发生率最高;这表明地向流在运动到近地时向着晨昏两翼偏转. (2) 越靠近地球,流速V和Vx越小,Vy和Vz的变化幅度较小并且具有明显的晨昏不对称性;所以地向流在近地运动过程中,不仅在晨昏方向上偏转,而且在南北方向上偏转. (3) 地向流期间,等离子体密度整体偏小;但是随地心距离的减小,密度整体上逐步增加. (4) 平行和垂直于磁场的流速具有明显的晨昏不对称性.在黎明侧的平行流速比黄昏侧大,在黄昏侧的垂直流速比黎明侧大. 鉴于较大的垂直流速易触发与电流中断关系密切的不稳定性,我们推测电流中断更容易出现在黄昏侧. (5) 除个别位置处的热压和磁压相当外, 磁压在总压中一直占据主导地位.日地连线附近的总压较大,晨昏两翼处的总压相对较小; 从而在晨昏向上产生较大的压力梯度,导致地向流在晨昏两翼偏转和发生率增大. 在晨昏两翼,距离地球较近的位置处观测到了较小的压力;而在日地连线附近,距离地球较远的位置才可以观测到较小的压力;压力分布的这个统计特征说明过去事例研究中电流中断出现在不同的位置可能是由近地磁尾的压力分布造成的.
关键词地向流; 偏转; 不稳定性; 电流中断; 压力梯度
1引言
地向高速流是磁尾等离子体片质量、能量和磁通量最重要的输运形式(Baumjohann et al., 1989,1990; Angelopoulos et al., 1994; Cao et al., 2006, 2013; Ma et al., 2009; Fu et al.,2011b; Miyashita et al., 2012).磁层亚暴的多种物理现象,诸如磁场偶极化锋面(Fu et al., 2011a, 2012a, 2012b; 2013)、磁通量堆积(Zhang et al., 2007)、电流中断(Kepko et al., 2001; Sigsbee et al., 2002; Lui, 2009)、极光增亮(Zesta et al., 2000; Nakamura et al., 2001)、磁层-电离层耦合的场向电流(Shiokawa et al., 1998; Cao et al., 2010)、能量粒子向内磁层注入(Duan et al., 2014);Harange间断(Lyons et al., 1999)和ULF(Ultra Low Frequency,超低频)波动(Lui et al., 2008;Cao et al., 2008; 王志强和曹晋滨,2010;马玉端等, 2014)等,都与等离子体片地向高速流有时空上的密切联系.
从20世纪90年代开始,一些科学家提出了“等离子体泡”理论(Pontius and Wolf, 1990; Chen and Wolf, 1999;Birn et al., 2009),来描述等离子体流从-40RE运动到近地磁尾的大尺度演化过程,及其与电离层极光活动的联系.“等离子体泡”理论和模拟描述的部分磁尾现象,逐步得到了不同卫星观测的证实.
Shiokawa等(1997)和Ohtani等(2004)利用单颗卫星,分别统计了-9RE~-19RE和-5RE~-30RE磁尾高速流的分布情况. Ma等(2010)利用多颗卫星,研究了-14RE~-19RE磁尾高速流的分布.单颗卫星研究结果表明等离子体片高速流单向减速,其地向刹车区域位于离地球10RE~12RE处(Shiokawa et al.,1997).但近年来多颗卫星的观测结果显示地向高速流在磁尾不同位置处的运动并非单向减速.受多种因素如等离子流速、等离子体通量管熵(Wolf et al., 2012)、麦克斯韦张力(Karlsson et al., 2015)和压力梯度(Li et al.,2011)等的影响,地向高速流有多种运动状态(Ma et al., 2012): 地向高速流既可能在其近地平衡位置附近震荡减速(Panov et al., 2013),也可能被加速(Karlsson et al., 2015),还有可能沿着方位角方向偏转(Kauristie et al., 2003; Pitkänen et al., 2011).关于地向高速流开始减速的位置,不同的卫星数据和研究方法给出了不同的结果. Hamrin等(2014)认为在-20RE~-15RE处,Fu等(2012a)认为在-15RE~-10RE处,Shang等(2014)认为在-17RE~-13RE处. 地向高速流可以穿透到距离地球最近的位置也有差别:Palin等(2012)认为可以到-7RE处,Panov等(2013)认为可以到-10RE±2RE处,Sergeev等(2000)认为可以到-6.6RE处,Ohtani等(2004)认为可以到-5RE处.
Dubyagin等(2011)从电离层的观测反推高速流减速和偶极化区域在-6RE处,并与电流中断和亚暴电流楔密切相关.有观测(Lyons et al., 1999; Sergeev et al., 2000; Nakamura et al., 2001)表明,地向高速流在磁尾等离子体片昏侧内边界的上行电流对应着电离层的极向边界增强(Poleward Boundary Intensifications, PBIs) .雷达在电离层内观测到多个南北向的PBIs向着赤道方向延伸,表明等离子体片内可能存在多个局域的快速流管(Zesta et al., 2006).作为高速流在磁尾的镜像过程, PESTR雷达在电离层内观测到高速流带有明显的方位角方向上分量(Zou et al., 2009).所以磁尾等离子体片的地向快速流在向近地穿透的过程中,除了地向速度大小变化外,在方位角方向上也存在偏转.但这个结论还没有得到卫星观测的充分证实.本文使用TC-1卫星(Liu et al., 2005)在近地磁尾的探测数据,对此问题进行了研究.研究结果表明近地高速流在近地磁尾的地向运动过程中,不仅存在昏侧和晨侧的偏转,还存在南北方向的偏转.
2仪器及地向流选取方法
我们使用了TC-1卫星(Liu et al.,2005)上搭载的FGM(Flux Gate magnetometers)仪器的磁场数据(Carr et al., 2005)和 HIA(Hot Ion analysis)仪器的等离子体数据(Rème et al., 2005).TC-1卫星轨道的倾角为28°, 近地点为570 km, 远地点为79000 km(大约-13.4RE),卫星自旋周期为4 s. 在2004—2007年的7—10月,TC-1运行在地球磁尾, 多次穿越近地等离子体片, 为研究近地高速流的演化提供了丰富的高质量数据.本文针对这一时期TC-1观测到的地向等离子体流, 进行统计分析.
考虑到距地心11.5RE处地磁场强度开始随着地向距离减少而显著增加(Rong et al., 2014)、地向高速流在尾状与偶极子状磁尾处的分界处(-13RE~-15RE),甚至可能在更远的磁尾处已开始减速;而TC-1的远地点为-13.4RE;选取速度不小于100 km·s-1的地向流(V≥100 km·s-1且Vx>0),分析其可能的演化特征.为了从理论、模拟和观测上与过去研究地向高速流的时空演化作比较,我们选取的区域为-13.4RE≤X≤-5RE,|Y|≤15RE. 本文使用的数据及结果,均为地心太阳黄道坐标系(Geocentric Solar Ecliptic system, GSE).
3卫星运行轨道和地向等离子体流分布
3.1卫星的运行轨道
图1给出了在2004—2007磁尾季节时,TC-1卫星的运行轨道. 由卫星在XY平面的运行轨道可以看出,卫星在晨侧的停留时间比在昏侧略长.XZ平面的运行轨道显示,卫星在南侧的停留时间比北侧略长. 而由YZ平面的运行轨道发现,卫星的运行轨道呈现出明显的非对称性特征,卫星在晨侧和南侧的采样点明显地比在昏侧和北侧多. 单从卫星的运行轨道来看,相对于XZ和YZ平面,卫星在XY平面的轨道特征更有利于我们研究地向等离子体流在近地的演化.
3.2地向等离子体流的空间分布
按照地向流选取方法,在2004—2007磁尾季节,共挑选出143892个地向等离子体流,其空间分布如图2所示.地向流在XY平面内的分布相对均匀. 在XZ平面内,地向流在X方向变化较大,而在Z方向上主要集中在±4RE以内. 在YZ平面内,尽管地向流在Y方向变化较大,在Z方向上却主要集中于±5RE以内. 结合图1可以看出,地向流在Z方向上的集中分布不太可能是受卫星运行轨道影响,而可能是地向流自身的分布特点造成的. 因此,接下来我们讨论地向流的分布特征时,主要聚焦在两个方面:一方面主要是讨论其沿着日地连线即X的分布,研究磁尾地向高速流的演化;另一方面讨论地向高速流在XY平面上的分布,研究地向高速流的偏转.
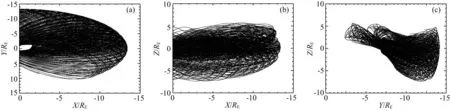
图1 在2004—2007磁尾季节时, TC-1的运行轨道Fig.1 Orbits of TC-1 in the tail seasons from 2004 to 2007

图2 2004—2007磁尾季节时, TC-1观测到的地向流分布Fig.2 Distribution of the earthward flow observed by TC-1 in the tail seasons from 2004 to 2007
4地向等离子体流的统计特征
为了与Shiokawa等(1997)在较大地心距离处的研究结果进行对比,我们将选出的地向流沿着日地连线进行分析.从图3a可以看出越靠近地球,卫星观测到的高速流个数越少,这和Shiokawa等(1997)的观测结果比较接近.从图3b可以看出随着地心距离的减小,地向流发生率(在1RE×1RE格点内选取出的地向流个数与卫星在此区域内采样到的高质量数据个数的百分比)降低,但是一直到X=-5RE处,发生率仍然保持在1%左右.这主要是由于我们的选取标准降低了流速,才使得我们在近地选取出了更多的地向流,并可以更好地研究地向流演化.从图3c可以看出随着地心距离的减小,地向流的总速度V均值从200 km·s-1减小到150 km·s-1. 地向流的地向分量Vx从150 km·s-1减小到90 km·s-1,与总速度变化趋势基本一致.地向流的V及Vx的变化特点,与Shiokawa等(1997)给出的地向高速流在较远的磁尾处开始减速的趋势保持一致. 此外,我们还在图3c中给出了地向流的晨昏向分量Vy及南北向分量Vz的分布情况. 随地心距离减小,Vy基本上稳定在60 km·s-1附近,Vz从70 km·s-1缓慢减小到60 km·s-1; 但是在X=-9RE处,Vz略有增加(大约80 km·s-1).
综合考虑卫星的运行轨道,卫星观测到的地向流在南北方向上的分布范围较小,在晨昏方向上的分布范围较大,而且在晨昏两翼处也观测到了较多的地向流,我们详细研究了地向流发生率和Vx的二维分布情况,具体结果如图4所示.
4.1地向流发生率的二维分布
图4a给出了地向流发生率在XY平面内的二维分布,右侧的色标给出不同发生率对应的颜色.可以看出随地心距离减小,地向流发生率在日地连线附近急剧降低,但在晨昏两翼处却相对较大. 从地向流发生率的二维分布来看,部分地向高速流可以穿透到X=-10RE甚至更加靠近地球的位置,只有极少数穿透到日地连线附近,大部分被偏转到了晨昏两翼处.进一步比较后发现:靠近黄昏侧翼处的地向流发生率明显比黎明侧翼处的大;这可能是因为等离子体流在地向运动的过程中,受到了磁场梯度和曲率的西向漂移影响.
图4b给出了Vx在XY平面内的二维分布,右侧的色标显示不同大小的Vx对应的颜色.不同区域内观测到了不同大小的Vx,可能是地向流并非单向减速,或者是发生在不同的地磁活动期间,或者兼而有之.
4.2流速的二维分布
为了给出速度的大致分布特征并与以前的研究结果进行对比分析,图5a,5b,5c中将地向流分成了晨侧(Y<-5RE)、昏侧(Y>5RE)和等离子体片(-5RE≤Y≤5RE)三个区域进行分析. 为了考察地向流在更小区域可能出现的细节特征,图5d,5e,5f中将流速三分量在XY平面内做了1RE×1RE平均. 从TC-1的远地点到-5RE处, 图5a给出三个区域内Vx的分布.等离子体片内Vx急剧下降(绿色曲线所示),这和以前的研究结果(Shiokawa et al.,1997)相似.结合图5d中Vx的二维分布,可以看出:在X=-13RE靠近磁尾的晨昏两侧,都没有观测到地向流;在X=-12RE~-13RE处的晨侧,观测到了较少的地向流,Vx均值较大;X~-12RE靠近地球的晨侧,地向流增多,Vx均值变化较小,基本保持在100 km·s-1左右;X~-12RE靠近地球的昏侧,Vx略有波动;在X~-6RE附近急剧下降后,逐渐恢复到之前的水平并略有上升.从图5d中还可以看出:Vx的整体分布具有明显的晨昏不对称性,以日地连线为分界线时,晨侧的地向流速度高于昏侧,尤其是靠近地球时晨昏两翼处的差异更加明显.
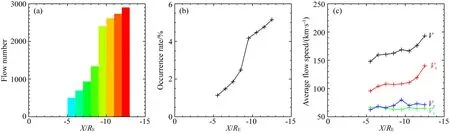
图3 地向流的个数、发生率和平均流速随着地向距离的分布Fig.3 Number, occurrence rate and average flow speed of the earthward flow along the sun-earth line
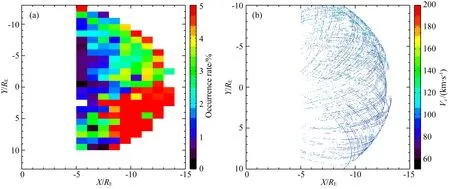
图4 地向流发生率(a)和Vx(b)在X-Y平面内的分布Fig.4 Occurrence rate (a) and Vx (b) of the earthward flow in XY plane
图5b给出三个区域内Vy的均值分布在60~80 km·s-1之间.从TC-1的远地点到X~-5RE,三个区域内Vy均值及变化幅度相当,说明近地对Vx影响较大的磁场偶极化或磁通量堆积对Vy影响较小.X~-6RE处:日地连线附近的Vy下降,晨侧的基本不变,昏侧的上升.三区域内Vy的均值一直超过50 km·s-1表明:地向流在近地运动过程中,向着晨昏两翼偏转. 图5d显示,Vy均值无显著特点.
图5c给出三个区域内Vz的均值分布在55~110 km·s-1之间.X=-12RE靠近地球侧:在昏侧Vz均值最大,日地连线附近的居中,晨侧的最小.结合图5f可以看出,Vz分布具有明显的晨昏不对称性:晨侧的明显低于昏侧,在较大的地心距离处,尤其明显. 三区域内Vz的均值一直超过50 km·s-1且变化范围较大说明,地向流在近地运动的过程中,向着南北方向偏转.
综合图5b、图5c、图5e和图5f可以看出,地向流在近地运动过程中同时向着晨昏和南北方向偏转.
为了考察地向流运动过程中密度的变化特点,我们在图6a中给出了其在XY面内的分布.地向流的密度整体上偏小(Angelopoulos et al.,1992),与之前的(Baumjohann et al., 1989; Ohtani et al., 2004)高速流期间密度下降一致. 从TC-1的远地点到-5RE处,图6a的等离子体密度大致呈现出上升趋势.X=-8RE的地球侧,大部分情况下靠近日地连线的密度较大. 而晨昏两翼处,仅有小部分区域密度较高,可能是由于等离子体片的不规则结构(Zhang et al., 2002; Shen et al., 2012; Rong et al., 2013)或摆动(Duan et al., 2013;Sun et al.,2010, 2014)造成的,或者与太阳风动压脉动驱动的磁场结构传播到磁尾等离子体片(Shi et al., 2014)有关.
为了研究这些地向流是否伴随有触发ULF波的不稳定性(Lui et al.,2008; 马玉端等,2014),我们给出了平行和垂直于磁场的流速在XY面内的分布.从TC-1的远地点到-5RE时,图6b给出平行流速最明显的变化表现在晨昏方向上.以日地连线为分界线时,平行流速具有明显的晨昏不对称性,黎明侧的明显高于黄昏侧.可以看出,如果需要统计近地平行流速对触发ULF波不稳定性的物理过程,黎明侧的地向流更有优势.

图5 平均流速的三分量随着地心距离及在X-Y平面内的分布Fig.5 The distribution of the three components of the average earthward flow along the sun-earth line and in the XY plane
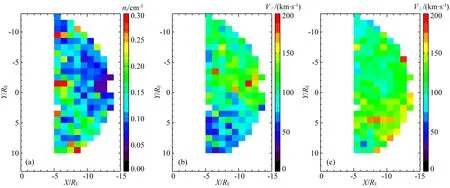
图6 地向流的平均密度(a),平行(b)和垂直(c)于磁场的流速分量在X-Y平面内的分布Fig.6 The average density (a), parallel (b) and perpendicular (c) components to the magnetic field of the earthward flow in the XY plane
从TC-1远地点到X~-8RE,图6c给出了地向流垂直于磁场的分量分布.总体上来说,日地连线附近的垂直流速较小,而晨昏两翼较大,有可能与磁尾电流片厚度的晨昏不对称性有关(Rong et al.,2011).在黄昏侧的垂直流速较大,更容易激发垂直传播的ULF波(马玉端等,2014). 如果晨昏两翼处激发ULF波的不稳定性与电流中断密切相关(Lui et al., 2008),那么从我们的统计结果来看,近地电流中断可以出现在不同的位置,出现在晨昏两翼的概率相对较大.
4.3压力的二维分布
等离子体的压力及压力梯度对于离子、电场、电流、能量密度分布函数和地向高速流的运动都有重要影响,为此我们在图7中给出了热压(a)、磁压(b)、总压(c)在XY面内的分布,各个图右侧的色标给出了不同大小压力值所对应的颜色. 结合图7a和图7b来看, 除了极少位置处热压与磁压大致相当之外,近地压力的主导项是磁压. 随地心距离减小,磁压总体上增大. 同一地心距离处,黎明侧及日地连线附近的磁压总体上大于黄昏侧.图7c给出的总压与磁压变化趋势大体上一致.-11RE靠近磁尾的区域:日地连线附近的总压变化较大导致尾向上较大的压力梯度;造成等离子体流地向减速.-11RE靠近地球的位置:沿着日地连线的方向上总压较大但是基本不变,压力梯度较小;从日地连线到黎明侧的方向上,总压总体上减小形成晨向上较大的压力梯度;从日地连线到黄昏侧的方向上,总压急剧减小形成黄昏向上很大的压力梯度. 越靠近地球,晨昏两个方向上较大的压力梯度出现的位置越靠近晨昏两翼.总压分布形成的压力梯度,可能是造成等离子体流在地向上减速,在晨昏方向上偏转的直接原因,这也导致了在晨昏两翼处的地向流发生率比较高. 而在晨昏两翼处观测到较大的压力梯度可能进一步导致了在较大的方位角上观测到场向电流(Shiokawa et al., 1998)增强及电离层内R1和R2电流(Zong et al., 2007; Dunlop et al., 2015).
另外,可以发现:在日地连线附近,距离地球较远的位置处才出现较小的压力;在晨昏两翼,距离地球较近的位置处已出现较小的压力;我们的统计研究结果说明过去事例研究中电流中断在不同位置出现,可能是由近地磁尾的压力分布造成的.
需要注意的是:地向高速流的运动除了受压力梯度影响外(Xing et al.,2010),还受麦克斯韦张力的影响(Karlsson et al.,2015).Cluster 四颗卫星的研究结果表明压力梯度和麦克斯韦张力的共同作用使得等离子体流并不是单向减速(Li et al., 2011;马玉端等, 2014). 从图4和图5 的统计也可以看出,地向流的速度变化并不是单一减速趋势.由于这里只有TC-1单颗卫星的观测,难以准确估算磁张力;在本文中仅根据地向流发生率推测磁压主导的总压力梯度使得地向等离子体流减速和偏转,真实过程还需考虑磁张力对于地向流的影响.
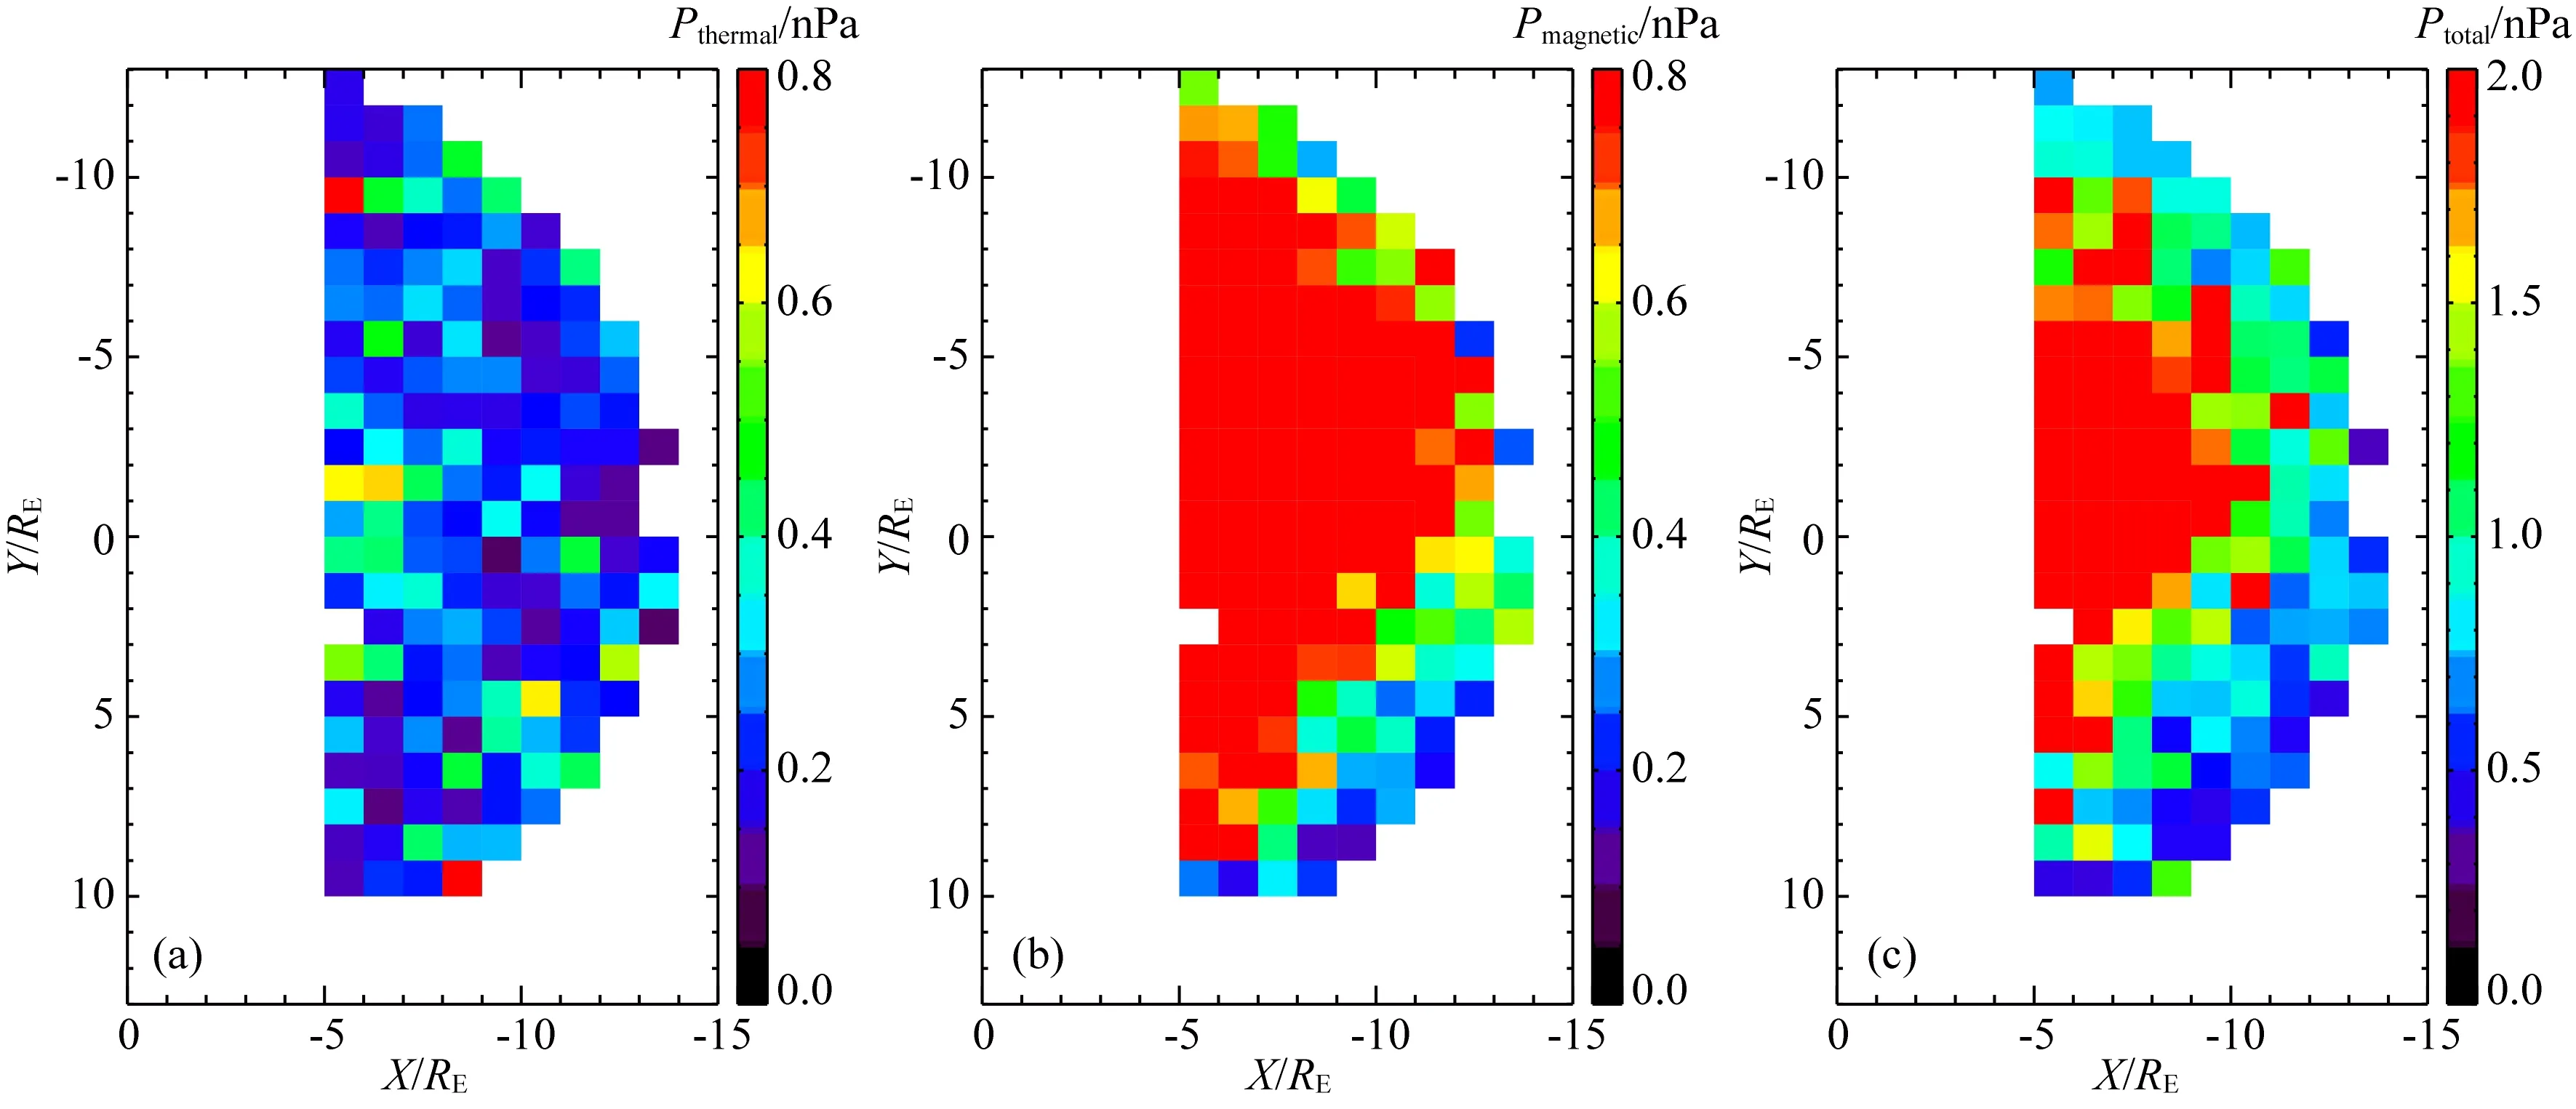
图7 地向流的热压(a),磁压(b)和总压(c)在X-Y平面内的分布Fig.7 Distribution of the average thermal (a), magnetic (b) and total pressure (c) during the earthward flow in the XY plane
5结论和讨论
在考虑了地向高速流减速因素的情况下,我们将过去研究地向高速流的空间演化区域从9RE的地心距离推进到5RE,统计结果如下:
(1) 发生率在晨昏两翼增大.与较远磁尾处地向流的发生率相比,日地连线附近的地向流发生率延续了逐步降低趋势,而在晨昏两翼处的发生率有不降反升的新特点.
(2) 流速三分量变化趋势不一致.由流速三分量在近地的分布,可给出其大致运动图像为: 地向减速,并向着晨昏和南北方向偏转. 总速度和Vx随地心距离减小而降低,延续了在较大地心距离处的减速趋势(Shiokawa et al.,1997). 除了在某些地心距离处略有增加外,Vy随地心距离变化较小.Vz的均值及其变化幅度大于Vy,而且其在黄昏侧比黎明侧大. 流速三分量的变化,可能是造成日地连线附近地向流发生率减小,而晨昏两翼发生率增大的原因.
(3) 密度分布不均匀.地向流期间,等离子体流的密度整体偏小,与之前研究给出的高速流时密度偏小一致(Baumjohann et al., 1989).从TC-1的远地点到近地的过程中,密度整体上逐步增大. 此外,密度分布也呈现出明显的晨昏不对称性:黄昏侧的密度整体上大于黎明侧的,个别区域甚至大于日地连线附近.
(4) 平行和垂直流速特点不同.以日地连线为分界线时,平行和垂直于磁场的流速,具有明显的晨昏不对称性.黎明侧的平行流速大于黄昏侧,黄昏侧的垂直流速大于黎明侧.较大的垂直流速,容易触发与电流中断(Lui et al.,2008; 马玉端等,2014)密切相关的不稳定性.不同位置处都观测到了较高的垂直流速,说明近地电流中断可以发生在不同位置.从统计结果来看,在黄昏侧发生的概率较高.
(5) 磁压在近地磁尾总压中占据主导地位.除了非常少的热压可与磁压相当之外,磁压大部分时候都在总压中占据主导地位.日地连线附近的磁压较大,晨昏两翼的磁压较小,形成晨昏向较大的压力梯度,可能是导致等离子体流在近地偏转、在晨昏两翼处发生率较大的直接原因.
较大的垂直流速 (Lui et al.,2008)和较小的磁压(或者较大的压力梯度)的位置分布都说明:电流中断更容易出现在晨昏两翼处,而不是在日地连线附近.
综合我们在近地的统计研究结果,可以给出:等离子体流在地向运动的过程中,受磁压为主导的压力影响,在晨昏方向上发生偏转;导致近地晨昏两翼的地向流发生率增大,近地电流中断可以出现在更靠近地球的位置并更多地出现在晨昏两翼.而有关地向流在近地的偏转、压力梯度的分布是否影响场向电流(Shiokawa et al.,1998;Dunlop et al.,2015)、磁层-电离层耦合(Zou et al., 2009) 将会是我们要开展的工作.
References
Angelopoulos V, Baumjohann W, Kennel C F, et al. 1992. Bursty bulk flows in the inner central plasma sheet.J.Geophys.Res., 97(A4): 4027-4039.
Angelopoulos V, Kennel C F, Coroniti F V, et al. 1994. Statistical characteristics of bursty bulk flow events.J.Geophys.Res., 99(A11): 21257-21280.
Baumjohann W, Paschmann G, Cattell C A. 1989. Average plasma properties in the central plasma sheet.J.Geophys.Res., 94(A6): 6597-6606.
Baumjohann W, Paschmann G, Lühr H. 1990. Characteristics of high-speed ion flows in the plasma sheet.J.Geophys.Res., 95(A4): 3801-3809.
Birn J, Hesse M, Schindler K, et al. 2009. Role of entropy in magnetotail dynamics.J.Geophys.Res., 114, A00D03, doi:10.1029/2008JA014015.
Cao J B, Ma Y D, Parks G, et al. 2006. Joint observations by Cluster satellites of bursty bulk flows in the magnetotail.J.Geophys.Res., 111(A4): A04206, doi: 10.1029/2005JA011322.Cao J B, Duan J T, Du A M, et al. 2008. Characteristics of middle- to low-latitude Pi2 excited by Bursty Bulk Flows.J.Geophys.Res., 113: A07S15, doi: 10.1029/2007JA012629.
Cao J B, Yan C X, Dunlop M, et al. 2010. Geomagnetic signatures of current wedge produced by fast flows in a plasma sheet.J.Geophys.Res., 115: A08205, doi: 10.1029/2009JA014891.
Cao J B, Ma Y D, Parks G, et al. 2013. Kinetic analysis of the energy transport of bursty bulk flows in the plasma sheet.J.Geophys.Res., 118(1): 313-320, doi: 10.1029/2012JA018351. Carr C, Brown P, Zhang T L, et al. 2005. The Double Star magnetic field investigation: instrument design, performance and highlights of the first year′s observations.Ann.Geophys., 23(8): 2713-2732.
Chen C X, Wolf R A. 1999. Theory of thin-filament motion in earth′s magnetotail and its application to bursty bulk flows.J.Geophys.Res., 104(A7): 14613-14626.
Duan A Y, Cao J B, Ma Y D, et al. 2013. Cluster observations of large-scale southward movement and dawnward-duskward flapping of earth′s magnetotail current sheet.Sci.ChinaTech.Sci., 56(1): 194-204, doi: 10.1007/s11431-012-5077-1.
Duan A Y, Cao J B, Dunlop M, et al. 2014. Energetic electron bursts in the plasma sheet and their relation with BBFs.J.Geophys.Res., 119(11): 8902-8915, doi: 10.1002/2014JA020169.Dubyagin S, Sergeev V, Apatenkov S, et al. 2011. Can flow bursts penetrate into the inner magnetosphere?Geophys.Res.Lett., 38(8): L08102, doi: 10.1029/2011GL047016.
Dunlop M W, Yang J Y, Yang Y Y, et al. 2015. Simultaneous field-aligned currents at Swarm and Cluster satellites.Geophys.Res.Lett., 42(10): 3683-3691, doi: 10.1002/2015GL063738.Fu H S, Khotyaintsev Y V, André M, et al. 2011a. Fermi and betatron acceleration of suprathermal electrons behind dipolarization fronts.Geophys.Res.Lett., 38(16): L16104, doi: 10.1029/2011GL048528.
Fu H S, Khotyaintsev Y V, Vaivads A, et al. 2012a. Occurrence rate of earthward-propagating dipolarization fronts.Geophys.Res.Lett., 39(10): L10101, doi: 10.1029/2012GL051784.
Fu H S, Khotyaintsev Y V, Vaivads A, et al. 2012b. Pitch angle distribution of suprathermal electrons behind dipolarization fronts: A statistical overview.J.Geophys.Res., 117(A12): A12221, doi: 10.1029/2012JA018141.
Fu H S, Cao J B, Khotyaintsev Y V, et al. 2013. Dipolarization fronts as a consequence of transient reconnection: In situ evidence.Geophys.Res.Lett., 40(23): 6023-6027, doi: 10.1002/2013GL058620.
Fu S Y, Shi Q Q, Wang C, et al. 2011b. High-speed flowing plasmas in the Earth′s plasma sheet.Chin.Sci.Bull., 56(12): 1182-1187, doi: 10.1007/s11434-011-4361-y.
Hamrin M, Pitkäen T, Norqvist P, et al. 2014. Evidence for the braking of flow bursts as they propagate toward the earth.J.Geophys.Res., 119(11): 9004-9018, doi: 10.1002/2014JA020285.Karlsson T, Hamrin M, Nilsson H, et al. 2015. Magnetic forces associated with bursty bulk flows in earth′s magnetotail.Geophys.Res.Lett., 42(9): 3122-3188, doi: 10.1002/2015GL063999.Kauristie K, Sergeev V A, Amm O, et al. 2003. Bursty bulk flow intrusion to the inner plasma sheet as inferred from auroral observations.J.Geophys.Res., 108(A1): 1040, doi: 10.1029/2002JA009371.Kepko L, Kivelson M G, Yumoto K. 2001. Flow bursts, braking, and Pi2 pulsations.J.Geophys.Res., 106(A2): 1903-1915, doi: 10.1029/2000JA000158.
Li S S, Angelopoulos V, Runov A, et al. 2011. On the force balance around dipolarization fronts within bursty bulk flows.J.Geophys.Res., 116(A5): A00I35, doi: 10.1029/2010JA015884.Liu Z X, Escoubet C P, Pu Z Y, et al. 2005. The Double Star mission.Ann.Geophys., 23(8): 2707-2712.
Lui A T Y, Yoon P H, Mok C, et al. 2008. Inverse cascade feature in current disruption.J.Geophys.Res., 113(A1): A00C06, doi: 10.1029/2008JA013521.
Lui A T Y. 2009. Comment on “Tail Reconnection Triggering Substorm Onset”.Science, 324(5933): 1391.
Lyons L R, Nagai T, Blanchard G T, et al. 1999. Association between Geotail plasma flows and auroral poleward boundary intensifications observed by CANOPUS photometers.J.Geophys.Res., 104(A3): 4485-4500. Ma Y D, Cao J B, Nakamura R, et al. 2009. Statistical analysis of earthward flow bursts in the inner plasma sheet during substorms.J.Geophys.Res., 114(A7): A07215, doi: 10.1029/2009JA014275.
Ma Y D, Cao J B, Reme H, et al. 2010. The radial evolution of earthward BBFs during substorm.Sci.ChinaEarthSci., 53(10): 1542-1551.
Ma Y D, Cao J B, Reme H, et al. 2012. Multi-spacecraft observations of earthward flow bursts.Sci.ChinaTech.Sci., 55(5): 1305-1311, doi: 10.1007/s11431-012-4797-6.
Ma Y D, Cao J B, Fu H S, et al. 2014. ULF wave accompanied with high-speed flows observed by TC-1 in the near magnetotail and the instability analysis.ChineseJ.Geophys. (in Chinese), 57(11): 3754-3765, doi: 10.6038/cjg20141129.
Miyashita Y, Machida S, Nosé M, et al. 2012. A statistical study of energy release and transport midway between the magnetic reconnection and initial dipolarization regions in the near-earth magnetotail associated with substorm expansion onsets.J.Geophys.Res., 117(A11): A11214, doi: 10.1029/2012JA017925.Nakamura R, Baumjohann W, Schödel R, et al. 2001. Earthward flow bursts, auroral streamers, and small expansions.J.Geophys.Res., 106(A6): 10791-10802.
Ohtani S I, Shay M A, Mukai T. 2004. Temporal structure of the fast convective flow in the plasma sheet: Comparison between observations and two-fluid simulations.J.Geophys.Res., 109(A3): A03210, doi: 10.1029/2003JA010002.
Palin L, Jacquey C, Sauvaud J A, et al. 2012. Statistical analysis of dipolarizations using spacecraft closely separated along Z in the near-earth magnetotail.J.Geophys.Res., 117(A9): A09215, doi: 10.1029/2012JA017532.Panov E V, Kubyshkina M V, Nakamura R, et al. 2013. Oscillatory flow braking in the magnetotail: THEMIS statistics.Geophys.Res.Lett., 40(11): 2505-2510, doi: 10.1002/grl.50407.Pitkänen T, Aikio A T, Amm O, et al. 2011. EISCAT-Cluster observations of quiet-time near-earth magnetotail fast flows and their signatures in the ionosphere.Ann.Geophys., 29(2): 299-319, doi: 10.5194/angeo-29-299-2011.
Pontius D H Jr, Wolf R A. 1990. Transient flux tubes in the terrestrial magnetosphere.J.Geophys.Res., 17: 49-52. Rème H, Dandouras I, Aoustin C, et al. 2005. The HIA instrument on board the Tan Ce 1 double star near-equatorial spacecraft and its first results.Ann.Geophys., 23(8): 2757-2774. Rong Z J, Wan W X, Shen C, et al. 2011. Statistical survey on the magnetic structure in magnetotail current sheets.J.Geophys.Res., 116(A9): A09218, doi: 10.1029/2011JA016489.
Rong Z J, Wan W X, Shen C, et al. 2013. Method for inferring the axis orientation of cylindrical magnetic flux rope based on single-point measurement.J.Geophys.Res., 118(1): 271-283, doi: 10.1029/2012JA018079.Rong Z J, Wan W X, Shen C, et al. 2014. Radial distribution of magnetic field in earth magnetotail current sheet.Planet.SpaceSci., 103: 273-285, doi: 10.1016/j.pss.2014.07.014.
Sergeev V A, Sauvaud J A, Popescu D, et al. 2000. Multiple-spacecraft observation of a narrow transient plasma jet in the earths plasma sheet.Geophys.Res.Lett., 27(6): 851-854.
Shang W S, Yao Z H, Shi Q Q, et al. 2014. Braking of high-speed flows in the magnetotail: THEMIS joint observations.Chin.Sci.Bull., 59(3): 326-334.
Shen C, Rong Z J, Dunlop M W, et al. 2012. Spatial gradients from irregular, multiple-point spacecraft configurations.J.Geophys.Res., 117(A11): A11207, doi: 10.1029/2012JA018075.Shi Q Q, Hartinger M D, Angelopoulos V, et al. 2014. Solar wind pressure pulse-driven magnetospheric vortices and their global consequences.J.Geophys.Res., 119(6): 4274-4280, doi: 10.1002/2013JA019551.
Shiokawa K, Baumjohann W, Haerende G. 1997. Braking of high-speed flows in the near-earth tail.Geophys.Res.Lett., 24(10): 1179-1182.Shiokawa K, Baumjohann W, Haerendel G. 1998. Azimuthal pressure gradient as driving force of substorm currents.Geophys.Res.Lett., 25(7): 959-962.
Sigsbee K, Cattell C A, Fairfield D, et al. 2002. Geotail observations of low-frequency waves and high-speed earthward flows during substorm onsets in the near magnetotail from 10 to 13RE.J.Geophys.Res., 107(A7): SMP 27-1-SMP 27-16, doi: 10.1029/2001JA000166.
Sun W J, Shi Q Q, Fu S Y, et al. 2010. Statistical research on the motion properties of the magnetotail current sheet: Cluster observations.Sci.ChinaTech.Sci., 53(6): 1732-1738, doi: 10.1007/s11431-010-3153-y.
Sun W J, Fu S Y, Shi Q Q, et al. 2014. THEMIS observation of a magnetotail current sheet flapping wave.Chin.Sci.Bull., 59(2): 154-161, doi: 10.1007/s11434-013-0056-x. Wang Z Q, Cao J B. 2010. ULF waves associated with the periodical high speed flows in magnetotail plasma sheet.ChineseJ.Geophys. (in Chinese), 53(2): 231-236, doi: 10.3969/j.issn.0001-5733.2010.02.001.Wolf R A, Chen C X, Toffoletto F R. 2012. Thin filament simulations for earth′s plasma sheet: Interchange oscillations.J.Geophys.Res., 117(A2): A02215, doi: 10.1029/2011JA016971.Xing X, Lyons L R, Angelopoulos V, et al. 2010. Plasma sheet pressure evolution related to substorms.J.Geophys.Res.,115(A1): A01212, doi: 10.1029/2009JA014315.
Zesta E, Lyons L R, Donovan E. 2000. The auroral signature of earthward flow bursts observed in the magnetotail.Geophys.Res.Lett., 27(20): 3241-3244.
Zesta E, Lyons L R, Wang C P, et al. 2006. Auroral poleward boundary intensifications (PBIs): Their two-dimensional structure and associated dynamics in the plasma sheet.J.Geophys.Res., 111(A5): A05201, doi: 10.1029/2004JA010640.Zhang H, Pu Z Y, Cao X, et al. 2007. TC-1 observations of flux pileup and dipolarization-associated expansion in the near-earth magnetotail during substorms.Geophys.Res.Lett., 34(3): L03104, doi: 10.1029/2006GL028326.
Zhang T L, Baumjohann W, Nakamura R, et al. 2002. A wavy twisted neutral sheet observed by CLUSTER.Geophys.Res.Lett., 29(19): 5-1-5-4, doi: 10.1029/2002GL015544.
Zong Q G, Fu S Y, Baker D N, et al. 2007. earthward flowing plasmoid: Structure and its related ionospheric signature.J.Geophys.Res., 112(A7): A07203, 10.1029/2006JA012112.
Zou S S, Lyons L R, Nicolls M J, et al. 2009. PFISR observations of strong azimuthal flow bursts in the ionosphere and their relation to nightside aurora.J.Atmos.Sol.-Ter.Phys., 71(6-7): 729-737.
附中文参考文献
马玉端, 曹晋滨, 符慧山等. 2014. 近磁尾TC-1观测到伴随有高速流的ULF波及不稳定性分析. 地球物理学报, 57(11): 3754-3765, doi: 10.6038/cjg20141129.
王志强, 曹晋滨. 2010. 磁尾等离子体片中周期性高速流相伴随磁场超低频波. 地球物理学报, 53(2): 231-236, doi: 10.3969/j.issn.0001-5733.2010.02.001.
(本文编辑何燕)
The deflection of the earthward flow observed by TC-1 in the near magnetotail
MA Yu-Duan1, YANG Jian1, PANG Xue-Xia1,2
1SchoolofSpaceandEnvironment,BeihangUniversity,Beijing100191,China2CollegeofPhysicsScienceandTechnology,HebeiKeyLabofOptic-ElectronicInformationandMaterials,HebeiUniversity,HebeiBaoding071002,China
AbstractUsing the data observed by the TC-1 satellite in the magnetotail season from 2004 to 2007, we extended the earthward high-speed flow to the lower speed and statistically investigated its spatial evolution in the geocentric distances between -13.4RE and -5RE. Our findings are as follows: (1) When the earthward flow are moving close to the earth, the occurrence rate of the earthward flow decreases mainly around the sun-earth line, the occurrence rate in the dawn and dusk flank does not fall but rise, the highest occurrence rate locates in the dusk flank, which may indicate that the earthward flow is deflecting to the dawn and dusk flank under its process penetrating to the earth. (2) Closer to the earth, the amplitude of V and Vx is smaller; there are slight variations of Vy and Vz and their distributions are dawn-dusk asymmetry; which indicates that the process penetrating to the earth is accompanied by the dawn-dusk and north-south deflection. (3) During the earthward flow, the plasma density is relatively small on the whole; it gradually increases with the decrease of the geocentric distances. (4) The distribution of the parallel and perpendicular flow speed is dawn-dusk asymmetry. The parallel speed in the dawn is larger than that in the dusk. The perpendicular speed in the dusk is larger than that in the dawn. Considering that the large perpendicular flow speed is easy to trigger the instability closely related to the current disruption, we infer that the current disruption occurs easily in the dusk. (5) The magnetic pressure is mostly dominant with few thermal pressures comparable to the magnetic pressure. The total pressure is large near the sun-earth line and small in the dawn and dusk, so large pressure gradient forms both in the dawn and dusk direction; which cause the earthward flow deflect and the occurrence rate increase in the dawn and dusk flank. Lower pressure than the ambient can be observed in the dawn and dusk flank close to the earth, and that can be observed farther away from the earth around the sun-earth line; which suggest that the current disruption occurred at different locations in the past cases may be caused by the pressure distribution close to the earth.
KeywordsEarthward flow; Deflection; Instability; Current disruption; Pressure gradient
基金项目国家自然科学基金(41431071、41174141和41204131), 国家科技支撑计划(2011CB811404)资助.
作者简介马玉端,女,主要从事磁尾卫星探测数据的分析.E-mail:ydma@buaa.edu.cn
doi:10.6038/cjg20160402 中图分类号P353
收稿日期2015-09-27,2015-12-03收修定稿
马玉端, 杨建, 庞学霞. 2016. TC-1在近磁尾观测到地向流的偏转.地球物理学报,59(4):1189-1198,doi:10.6038/cjg20160402.Ma Y D, Yang J, Pang X X. 2016. The deflection of the earthward flow observed by TC-1 in the near magnetotail.ChineseJ.Geophys. (in Chinese),59(4):1189-1198,doi:10.6038/cjg20160402.