Examination of Correlation between Histidine and Cadmium Absorption by Eleagnusangustifolia L., Vitisvinifera L. and Neriumoleander L. Using HPLC-MS and ICP-MS
2016-06-15SukranAkkusOzenMehmetYaman
Sukran Akkus Ozen, Mehmet Yaman
Firat University, Faculty of Science, Department of Chemistry, Elazig, Turkey
Examination of Correlation between Histidine and Cadmium Absorption byEleagnusangustifoliaL.,VitisviniferaL. andNeriumoleanderL. Using HPLC-MS and ICP-MS
Sukran Akkus Ozen, Mehmet Yaman*
Firat University, Faculty of Science, Department of Chemistry, Elazig, Turkey
In this study, HPLC-MS and ICP-MS methods wereused for the determination of histidine and cadmiuminEleagnusangustifoliaL.,VitisviniferaL. andNeriumoleanderL. leaves taken from industrial area including Gaziantep and Bursa cities. To histidine determination by HPLC-MS, flow rate of mobile phase, fragmentor potential, injection volume and column temperature were optimized as 0.2 mL·min-1, 70 V, 15 μL and 20 ℃, respectively. For extraction of histidine from plants, distilled water was used by applying on 90 ℃ and 30 min. The concentrations (as mg·kg-1) of histidine were found to be in range of 8~22 forEleagnusangustifoliaL., 10~33 forVitisviniferaL. and 6~11 forNeriumoleanderL. The concentrations of cadmium were found to be in ranges of 6~21 μg·kg-1forVitisviniferaL. 15~110 μg·kg-1forEleagnusangustifoliaL. and 63~218 μg·kg-1forNeriumoleanderL.
Histidine; Cadmium; Hyperaccumulator plants; ICP-MS; HPLC-MS
e-mail: sakkus23@gmail.com *Corresponding author e-mail: ijpacmy@gmail.com; myaman@firat.edu.tr
Introduction
Heavy metals can be harmful to humans and animals and tend to bioaccumulate through the food chain[1-2]. Cadmiumhas common industrial use as well as its carcinogenic effect, and thus, it has become a serious pollutant in diverse environmental settings[3-4]. Over the past two centuries, anthropogenic and industrial activities have led to high emissions of toxic metals into the environment at the more high concentrations. Because metals exposed into environment are toxic and none biodegradable unlike organical compounds, removal of excess metal ions from polluted sites is important, reasonably. So, numerous efforts have been undertaken to find methods of removing heavy metals from soil, such as chemical remediation,phytoremediation, soil washing, nano materials, remediation with bacteria, electricalforce and heat[5-7]. Chemical remediation involves the use of chemicals to clean the environment. However, this method is not universal, highly costly and may cause secondary pollution[8]. Phytoextraction (in other words, phytoremediation) is the removal of metals from soil using hyperaccumulatorplants. Phytoextraction or phytoremediation is both 1000-fold cheaper than conventional remediation methods and environmentally friendly technology[8-9]. The use of hyperaccumulator plants opens a new branch of phytoremediation technology that is an ecofriendly and scientific approach to remove, extract, or inactivate metal ions in the soil using plants[5,10-12]. In the phytoremediation, the basic concept is as follow: Growing and harvesting of plants on the polluted soils, burning of plants and smelting or storing of the ash. Hyperaccumulators often exhibit higher metal concentrations in their tissues than are present in the soil and can tolerate much higher metal concentrations before showing symptoms of toxicity[12]. Most hyperaccumulators absorb selectively particular metals but the mechanisms of selection are not understood at the molecular level[13]. Plant-ligands play a role in the sequestration of metals from soils, transport to the above-ground tissue and finally storage. Nitrogen-donor ligands and especially free amino acids are assumed to play a role in hyperaccumulators. Heavy metals are intracellularly chelated through the synthesis of amino acids, organic acids, GSH, or HM-binding ligands such as metallothioneins (MTs), phytochelatins (PCs), compartmentation within vacuoles. Some metals can inactivate enzymes by binding to cysteine residues. Among free amino acids, histidine (His) is considered to be the most important formetal hyperaccumulation[10-14]. Histidine can act as a tridentate ligand via its carboxylato, amine and imadazole functions. While there are many metal-binding biomolecules, this study focuses only on histidine ligand that has been reported to play a role in sequestering, transporting or storing the accumulated metal.As a result, the discovery of new hyperaccumulator plants has high importance.In terms of toxicity of elements, most concern to date has been centered on Cd, Pb and Ni in plants[15-20].
The aim of this study is,firstly, to examine the correlation between Cd and histidine in plants leaves includingEleagnusangustifoliaL.,VitisviniferaL. andNeriumoleanderL. Secondly, to consider the Cd-pollution extent in two highly industrialized cities in Turkey using three plant species. For this purpose, HPLC-MS and ICP-MS methods were optimized for the determination of histidine and Cd in the leaves samples Representative locations in the surrounding area of the organized industrial zone including lead battery production, cement factory and other similar industrial factories placed around Gaziantep and Bursa cities were chosen for this study.
1 Experimental
1.1 Apparatus and Reagents
The concentrations of Cdwere determinedusing a Perkin-Elmer SCIEX ELAN9000 inductively coupled plasma mass spectrometer (ICPMS) (PerkinElmer SCIEX, Concord, ON, Canada). The operation conditions for ICP-MS were taken from the manual Handbook. A microwave digestion system (CEM MARSXpress) was used to prepare the samples for the analysis. Doubly distilled water, obtained with a water purification system (Millipore Direct-Q, Millipore Corporation, Bedford, MA, USA) was used for all samples and standard preparations. An Agilent 1200 HPLC-MS system was used for the quantification of histidine. The instrument included an autosampler, a binary pump, a temperature controlled column oven, and an Agilent 6110 MS detector that was operated in selected ion monitoring (SIM) and scan mode equipped with positive ion electrospray ionization. The HPLC effluent entered the mass spectrometer through an electrospray capillary set at 3 000 V. Nitrogen was used as the drying and vaporizer gas at 300 and 500 ℃. The drying gas flow was 11.0 L·min-1(Table 1). A Zorbax Eclipse XDB-C18 (4.6 mm, 150 mm, 5 μm) was used as the column. Unless stated otherwise, all chemicals used throughout the study were of high-purity reagent grade. Concentrated nitric acid (65%, Merck) was used in the digestion procedure. The cadmium stock solution (1 000 mg·L-1) was prepared from its nitrate salt (Merck, Darmstadt, Germany). All chemicals used were of analytical reagent grade.
1.2 Sampling and sample preparation
EleagnusangustifoliaL.,VitisviniferaL. andNeriumoleanderL. leaves were collected around Gaziantep and Bursa citiesof 1 500 000 and 2 000 000 populations in SE and NWTurkey, respectively, that arethe important industrial centers of Turkey (Figure 1). The samples for the control area were taken away from the urban and industrial areas. The sampling was conducted in the summer of 2011. The healthy looking leaves (about 100 g fresh plant) were taken from per site. The plants were transferred to the laboratory in plastic bags, washed with tap water, and then, rinsed with distilled water. After drying procedure at 70 ℃, the samples were ground with agate mortar and then homogenously mixed. The locations of plant sampling were shown at Figure 1.
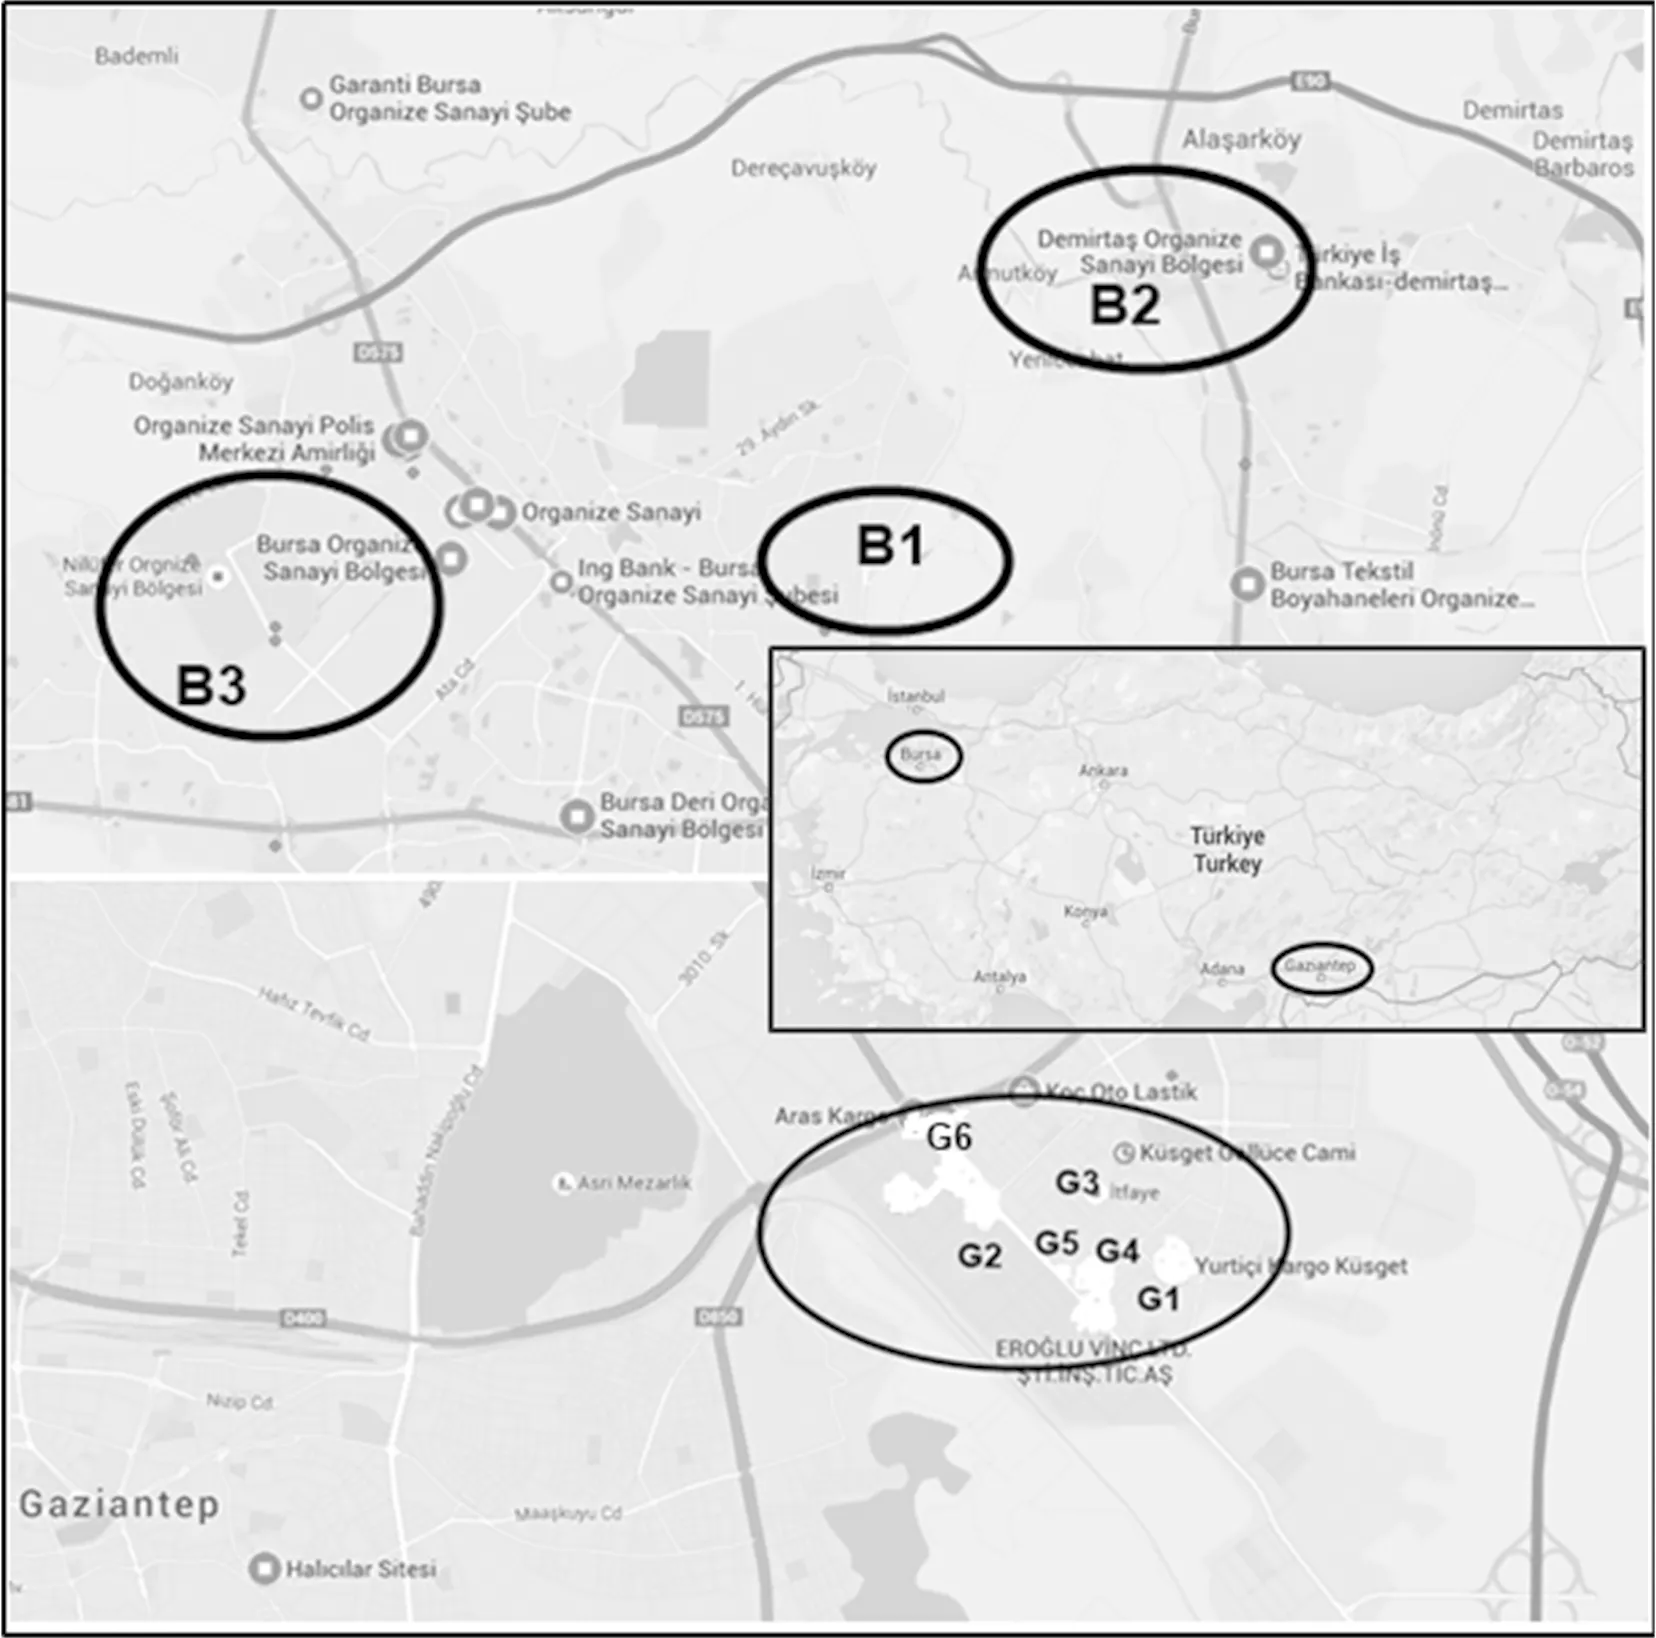
Fig.1 Map of sampling locations
To digestion of plant leaves, a 0.3 g portion of the sample was transferred into Teflon and concentrated nitric acid added. Then, the mixtures were irradiated for 30 min as described in manual handbook of microwave oven. The solutions were heated up near to dryness. After addition 20 mL of 0.1 mol·L-1nitric acid, the solution was filtrated, if necessary, and the clear solution was analyzed by ICP-MS. Each of samples was analyzed in triplicate and mean values were taken as result.
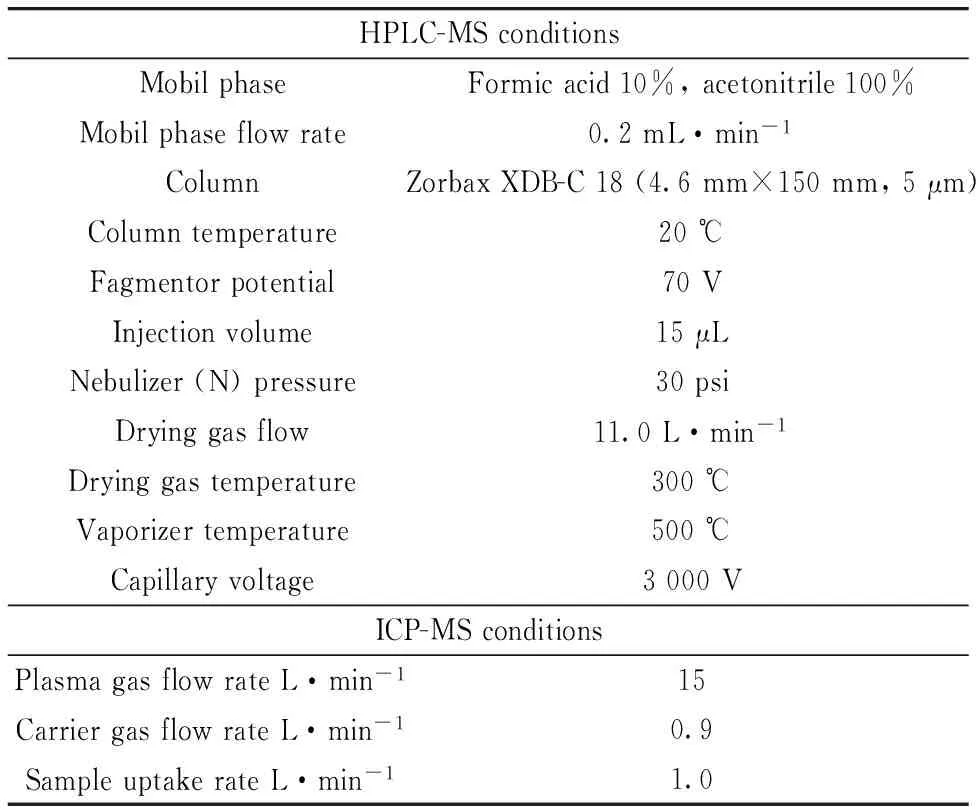
Table 1 Operating conditions for histidine and Cd determination by HPLC-MS and ICP-MS
A HPLC-MS method was optimized for the determination of histidine inEleagnusangustifoliaL.,VitisviniferaL. andNeriumoleanderL. leaves. For this purpose, flow rate of mobile phase, fragmentorpotential, injection volume and column temperature were examined and optimized as 0.2 mL·min-1, 70 V, 15 μL and 20 ℃, respectively. To extract histidine from plant leaves, 0.1 M HCl and distilled water wereexamined by applying different temperatures between 20~90 ℃ and stirring times of 15~60 minutes as seen in Figure 2. It was found that distilled water, the temperature of 90 ℃ and stirring time of 30 min are the optimum conditions. Further, different volumes of distilled water were examined to determine optimum amount of extractant using the same amount of the same plant species. It was found that 30 mL of distilled water is sufficient to maximum signal of histidine. In the derivatization step, direct distilled water (underivatization), fenilisothiosiyanat anddabsyl chloride were examined by using the scheme in Figure 2, to determine the best derivatization reagent.
2 Results and discussion
Analytical performance: There are three methods to check the reliability of the results obtained. These are (1) the usage of Standard Reference Material (SRM), (2) comparison of the results with those obtained by independent method for the same samples, and (3) the recovery test. In this study, the first method was used to metal determinations and the third method was used for HPLC-MS measurements. The obtained concentration ofCd in SRM, “Bush branches and leaves-Trace elements (NCS DC73348)”, were found to be 135 μg·kg-1that the certified value is 140 μg·kg-1. Becausethe recovery of 96% was achieved, Cd determination in this study is considered as the accurate. In the HPLC measurements for histidine, the recoveries, at least, 95% from the plant leaves fortified (3 mg·kg-1) with histidine were obtained to test the accuracy. The effects of contaminationwere eliminated by subtracting the obtained valuesfrom the blank.

Fig.2 Steps in analytical scheme for histidine determination
From the Table 2and Figures 3—5, the concentrations of Cd were found to be in ranges of 15~110 μg·kg-1forEleagnusangustifoliaL., 6~21 μg·kg-1forVitisviniferaL. and 63~218 μg·kg-1forNeriumoleanderL. The concentrations of histidine were found to be in range of 10~33 mg·kg-1forVitisviniferaL. 8~23 mg·kg-1forAngustifoliaL. and 6~11 mg·kg-1forNeriumoleanderL. except control group. Normal concentrations of Cd in plants wereconsidered in ranges of 0.01~1.0 mg·kg-1for plants[21-22]. Kabata-Pendias considered a much higher value of 10 mg·kg-1asan excessive or toxic level of this elementfor plants[21]. Hyperaccumulation has been recognized as an extreme physiological response in heavy metal tolerance. In other words, hyperaccumulator plants can tolerate much higher metal concentrations without symptoms of toxicity[12, 23-25]. However, the physiological processes involved in hyperaccumulation are not well understood. Plants must be able to store the metal ions in nonlabile complexes to eliminate toxic effects. The most likely areas for storage are the cellwall, the cytosol and the vacuole. A number of steps are required for metal ions to reach the storage tissues: mobilization and uptake from soil, compartmentation and sequestration within roots, transfer to the xylem for transport, distribution between metal sinks in abovegroundtissue and sequestration and storage in leaf cells[26]. Each stage could affect metal accumulation.
The hyperaccumulator may be detoxifying the metal in the leaves via strong binding ligands. So, the ligands including histidine (His), cysteine and phytate may play a part in sequestration within isolated compartments[10-14]. Kaya et al. found cadmium concentrations inVitisviniferaL.,EleagnusangustifoliaL. andNeriumoleanderL. leaves grown area around lead battery factory, up to 70 (in range of 7~70), 327 (in range of 106~327) and 172 (in range of 66~172) μg·kg-1, respectively[15-20]. They obtained those results on 2006—2007. Four years later, the obtained values in this study for the same area were given in Table 2 and Figures 3—5.
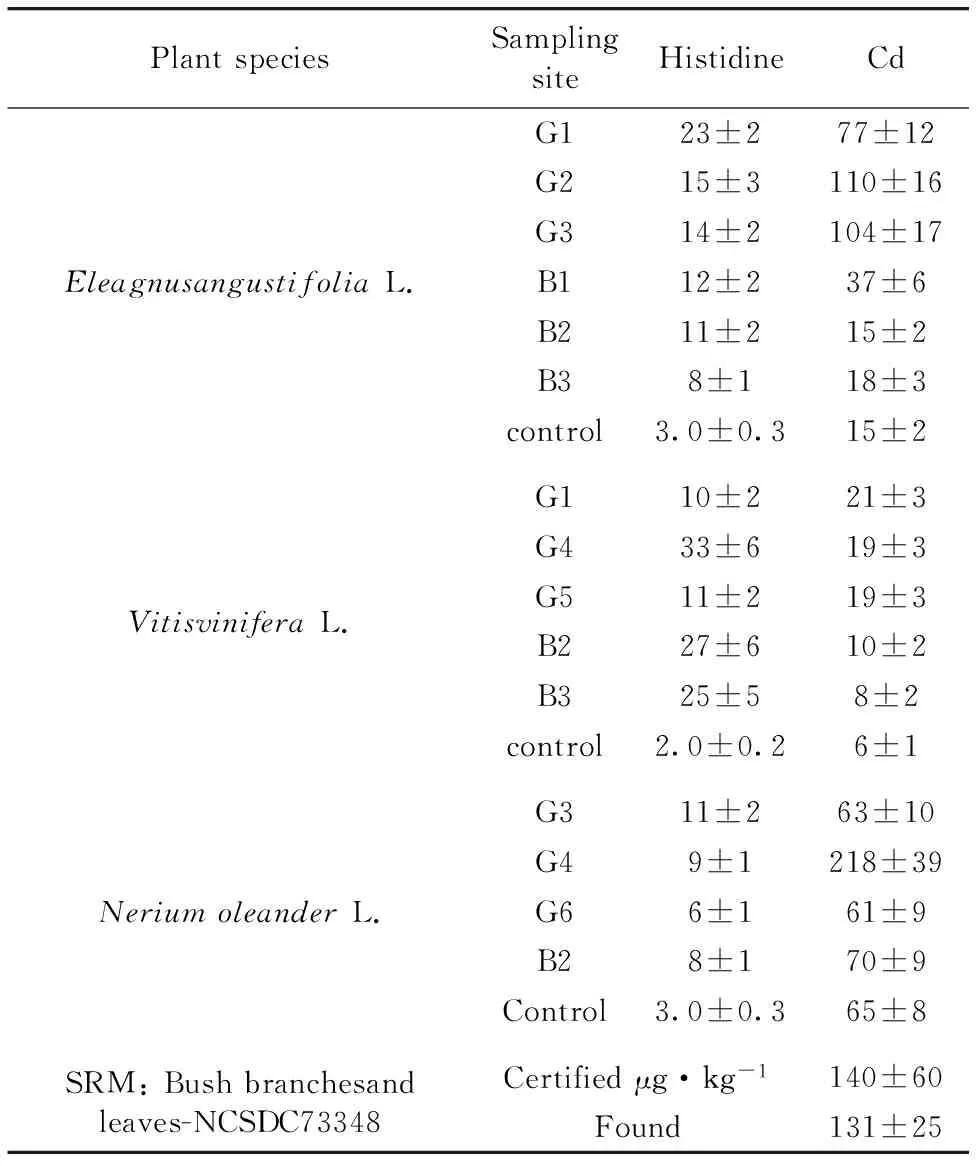
Table 2 Cd and Histidine concentrations in the studied samples, μg·kg-1
It was reported that metal concentrations in plants change depending on the plant species, polluted source, and the wind direction[27]. Onianwa and Fakayodedetermined trace metal levels in topsoil and vegetation (the plant Cromonolinaodorata, a composite) taken from the vicinity of a lead-battery manufacturing plant located in Ibadan-the largest city in Nigeria[27]. They found that Cd concentration (as mg·kg-1) in plants grown in polluted area was 1.5, while Cd concentration in plant samples taken from the control site was 0.4 mg·kg-1[27]. The high metal uptake may be attributed to high-lyefficient intracellular compartmentalization. Hyperaccumulation in a number of speciesappeared to be the result of airborne contamination of the leaf surface,rather than root uptake and translocation. Boyd hasreviewed interactions between heavy metals pollutants and chemical ecology[28]. It was concluded that communities and ecosystems are difficult tostudy due to their complexity, but a complete understanding of metal pollutanteffects cannot be accomplished without such studies. Hopefully, amore complete understanding will enable us to limit harmful effects of anthropogenic heavy metal pollutants on Earth’s biota. Due to high toxic and carcinogenic effects of metals including cadmium for human and animal, numerous studies were carried out to determine its concentration in environment, food and biological matrices[29-33]. The correlation coefficient between Cd and histidine concentrations were found to ber=0.67 forEleagnusangustifoliaL.,r=0.09 forVitisviniferaL. andr=0.29 forNeriumoleanderL. Hence, insignificant linear correlation forEleagnusangustifoliaL.(r=0.67) were seen.
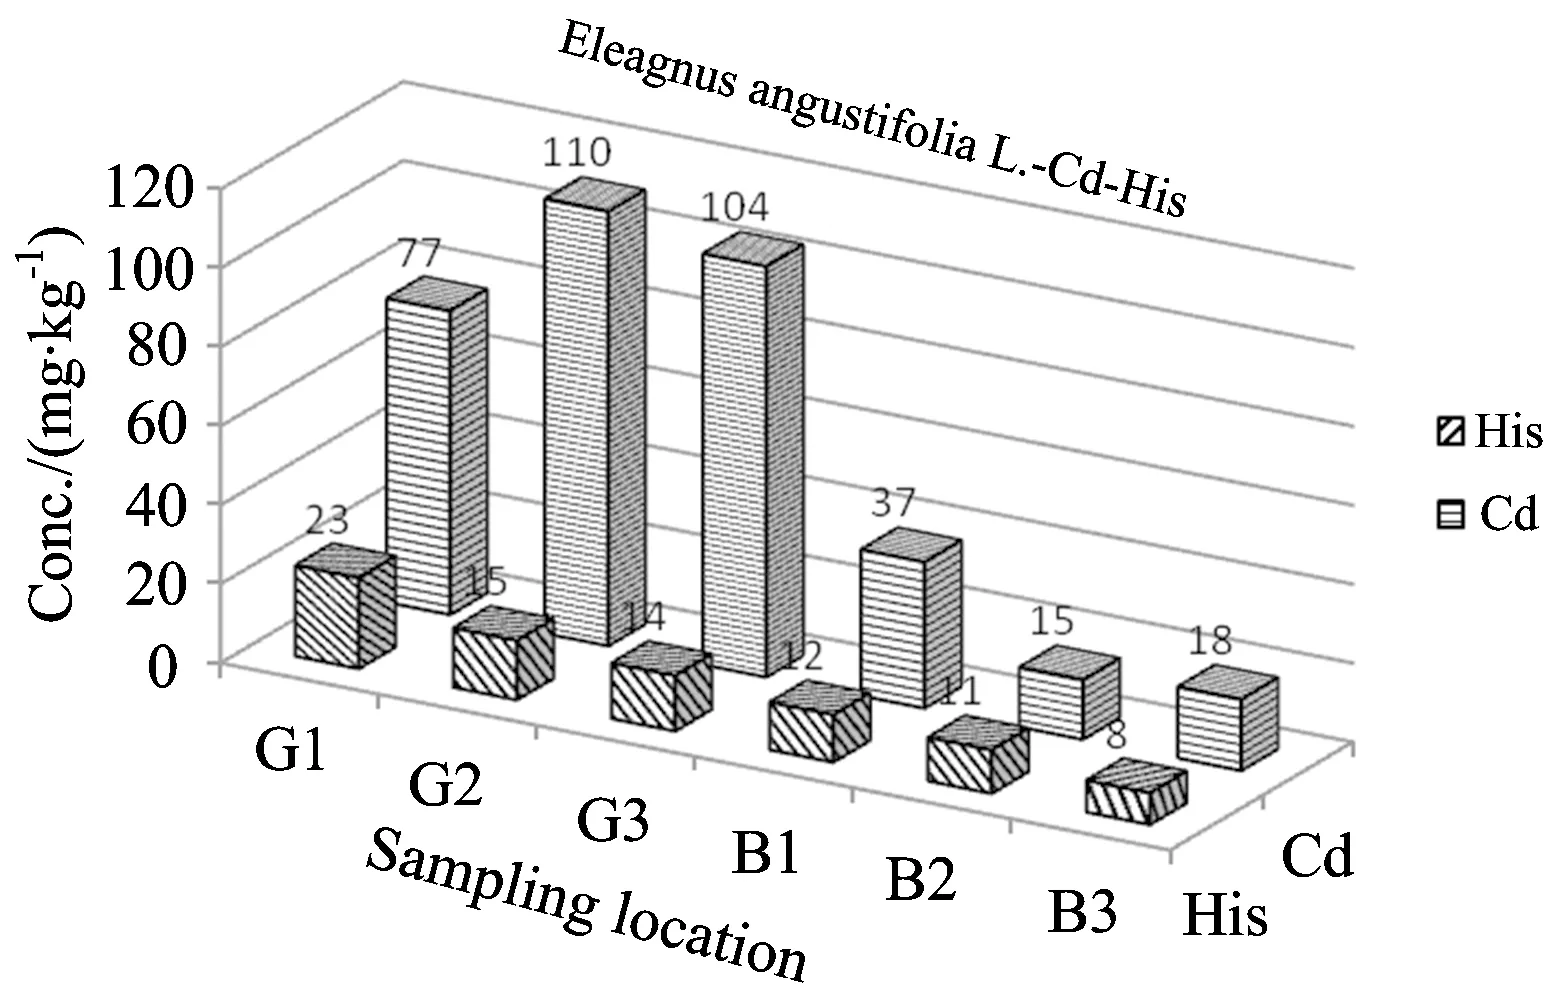
Fig.3 Comparison of Cd and histidine levels inE.angustifoliaL. depending on sampling location
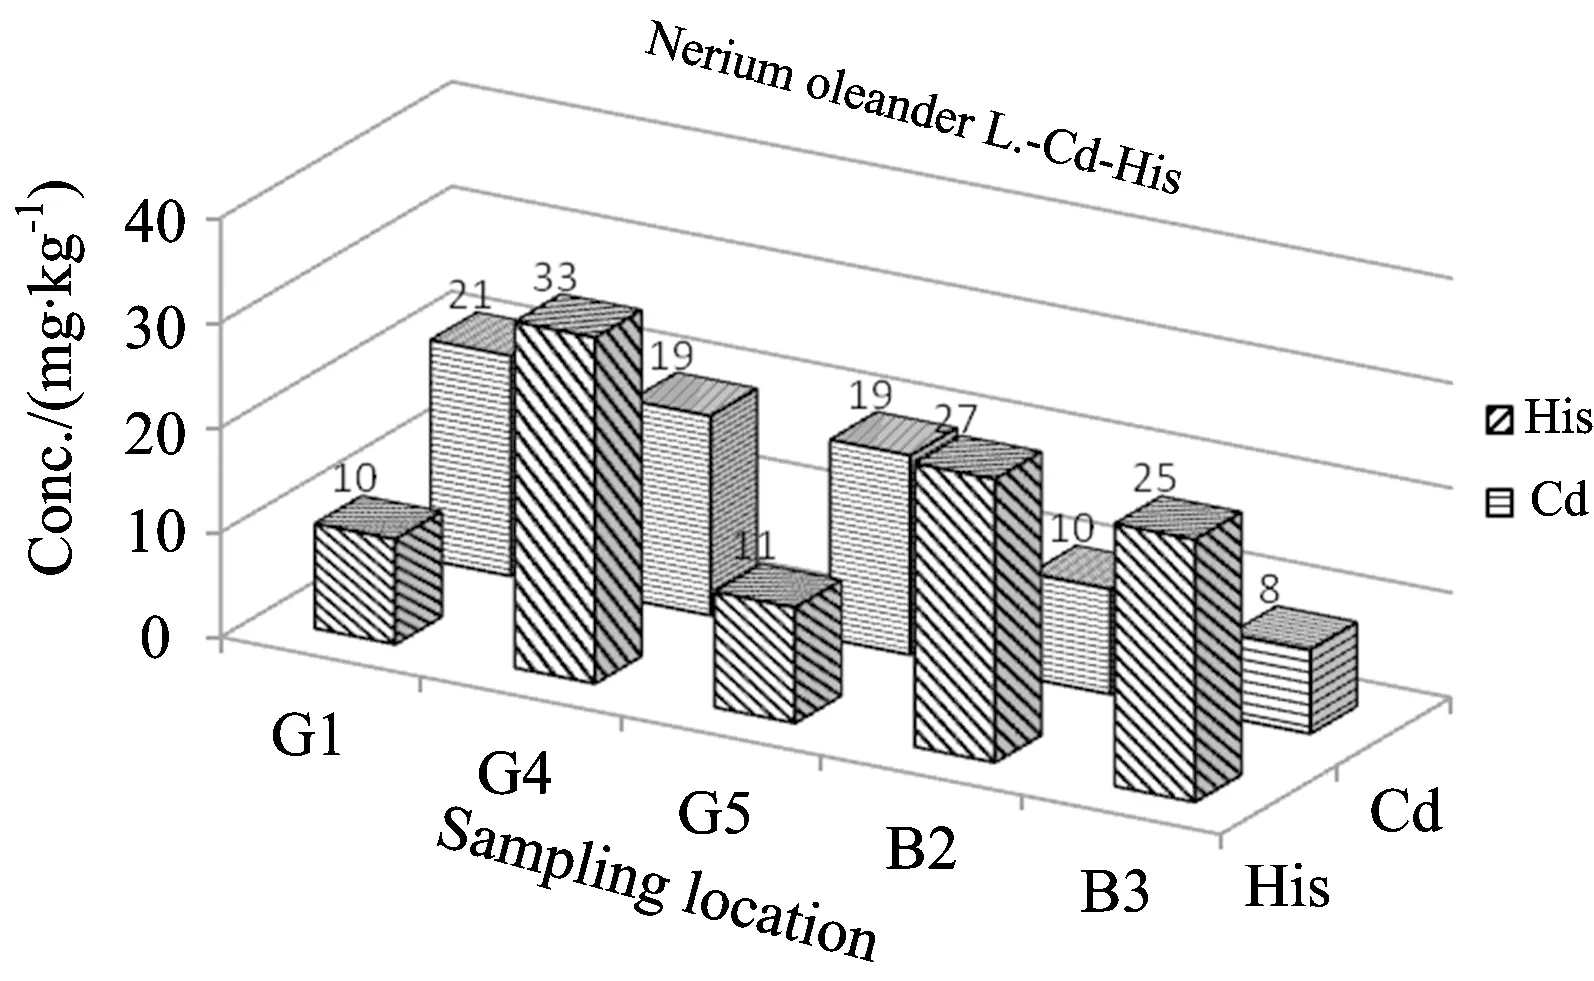
Fig.4 Comparison of Cd and histidine levels inV.viniferaL. depending on sampling location
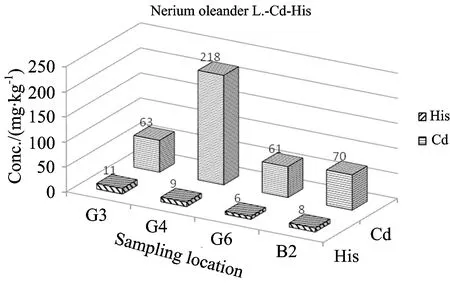
Fig.5 Comparison of Cd and histidine levels inN.oleanderL. depending on sampling location
3 Conclusion
Cadmium concentrations up to 218 μg·kg-1(in leaves ofN.oleanderL. ) were found in leaves of the studied matrices includingNeriumoleanderL.,VitisviniferaL. andEleagnusangustifoliaL. taken from organized industrial zonein Gaziantep city. The lowest Cd concentration in this plant species was found to be 61.0 μg·kg-1. So, the rate of highest to lowest Cd concentration (Table 2) forN.oleanderL. is 3.6-fold, and this reveal, clearly, that thisplant leaves has a potential as biomonitor and/or hyperaccummulator for Cd.Taking into consideration between Cd and histidine values from Table 2, insignificant linear correlation forEleagnusangustifoliaL. (r=0.67) were seen.
[1] Mertz W. Academic Press, Newyok. Fifth Ed, 1987.
[2] Yaman M. Current Medical Chem., 2006, 13(21): 2513.
[3] Rani A, Kumar A, Lal A, et al. International Journal of Environmental Health Research, 2014, 24(4): 378.
[4] Huff,et al. Int. J. Occup. Environ. Health., 2007, 13(2): 202.
[5] Mulligan C N,et al. Engineering Geology, 2001, 60: 193.
[6] Gunawardana B,et al. Plant Soil, 2010, 329: 283.
[7] Pilon-Smils E, Pilau M. Critical Reviews in Plant Sciences, 2002, 21: 439.
[8] Shah K, Nongkynrih J M. Biologia Plantarum, 2007, 51(4): 618.
[9] Krämer U, Chardonnens A N. Appl. Microbiol. Biotechnol.,2001, 55: 661.
[10] Haydon M J, Cobbett C S. New Phytol., 2007, 174(3): 499.
[11] Callahan D L, Baker A J M, Kolev S D, et al. Journal of Biological Inorganic Chemistry, 2006, 11: 2.
[12] Ugulu I. Applied Spectroscopy Reviews, 2015, 50: 113.
[13] Hall J L. Journal of Experimental Botany, 2002, 366: 1.
[14] Krämer U, et al. Nature, 1996, 379: 635.
[15] Kaya G, Okumus N, Yaman M. Fresenius Environ. Bull., 2010, 19(4):669.
[16] Kaya G, Yaman M. Trace Elements and Electrolytes, 2008, 25(3): 156.
[17] Kaya G, Yaman M. Talanta, 2008, 75: 1127.
[18] Kaya G, Ozcan C, Yaman M. Bull. Environ. Contam Toxicol, 2010, 84(2): 191.
[19] Kaya G, Yaman M. Spectrosc. Spectral Anal., 2012, 32(1): 229.
[20] Kaya G, Yaman M. Instrumentation Science & Technology, 2012, 40(1): 61.
[21] Kabata-Pendias A. Trace Elements in Soils and Plants, Fourth Edition, Taylor and Francis Group, 2011.
[22] Dong J, Mao W H, Zhang G P,et al. Plant Soil and Environment, 2007, 53(5): 193.
[23] Bargagli R. Plants as Biomonitors, in: Trace Elements in Terrestrial Plants: an Ecophysiological Approach to Biomonitoring and Biorecovery. Springer, Berlin Heideberg New York, 1998.
[24] Mulgrew A, Willeams P. Biomononitoring of Air Quality Using Plants, Air Hygiene Report no:10 Berlin, Germany WHO CC. 165, 2000.
[25] Mertens J, et al. Environmental Pollution, 2005, 138: 1.
[26] Clemens S, Palmgren M G, Kramer U. Trends Plant Sci., 2002, 7: 309.
[27] Onianwa P C, Fakayode S O. Environmental Geochemistry and Health, 2000, 22: 211.
[28] Boyd R S. J. Chem. Ecol., 2010, 36(1): 46.
[29] Yaman M, Kaya G, Yekeler H. World J. Gastroentor., 2007, 13(4): 612.
[30] Er C, Senkal B F, Yaman M. Food Chem., 2013, 137(1-4): 55.
[31] Ozen O A, Songur A, Sarsilmaz M, et al. Trace Elem. Med. Biol., 2003, 17(3): 207.
[32] Yaman M, Cokol N. At. Spectrosc., 2004, 25(4): 185.
[33] Yaman M, Bakirdere S. Mikrochim. Acta, 2003, 141: 47.
O657.3
A
2015-08-20; accepted: 2015-10-09
This study was financially supported by the Scientific Investigate Projects of Firat University, Turkey (Project Number: FF.11.19)
10.3964/j.issn.1000-0593(2016)02-0588-05
