Determination of Poly(Diallyldimethylammonium Chloride) via Spectrophotometric Titration with Coomassie Brilliant Blue G Dye
2016-06-15AlexanderShyichukDorotaZikowskaJanLamkiewicz
Alexander Shyichuk, Dorota Ziókowska, Jan Lamkiewicz
UTP University of Science and Technology, Faculty of Chemical Technology and Engineering, Seminaryjna 3, 85-326 Bydgoszcz, Poland
Determination of Poly(Diallyldimethylammonium Chloride) via Spectrophotometric Titration with Coomassie Brilliant Blue G Dye
Alexander Shyichuk*, Dorota Ziókowska, Jan Lamkiewicz
UTP University of Science and Technology, Faculty of Chemical Technology and Engineering, Seminaryjna 3, 85-326 Bydgoszcz, Poland
Poly(diallyldimethylammonium chloride) (PDDA) is used as organic coagulant in water purification and auxiliary agent in paper production. Determination of PDDA in aqueous solutions is carried out usually by means of polyelectrolyte titration using streaming current detector or o-Toluidine Blue dye for endpoint recognition. The proposed method of PDDA assay takes advantage of Coomassie Brilliant Blue G dye having strong affinity to cationic macromolecules. Titration of PDDA solution with the dye is carried out measuring absorbance at 585 nm. Inflection points of the obtained zigzag photometric curves have good repeatability provided that titration rate is low enough to attain endpoint for 1 hour or more. The method assures rectilinear calibration (R2=0.999 5) in the broad range of PDDA concentrations from 0.3 to 9.6 mg·dm-3.
PDADMAC; PolyDADMAC; Cationic polyelectrolyte; Colloid titration
Introduction
Poly(diallyldimethylammonium chloride) is cationic polyelectrolyte of high charge density. Technical grade PDDA is used mainly as coagulant and flocculant in water treatment[1-2]. The coagulation mechanism consists in neutralization of anionic colloidal particles by cationic macromolecules followed by particle bridging. PDDA is also used as retention and dewatering aid in the papermaking industry[3-4]. Due to good adsorption on proteinaceous surfaces PDDA is usual component in cosmetics under designation Polyquaternium-6[5].
Methods of quantitative determination of PDDA are based mostly on binding with anionic polymers or anionic dyes. The most often cited method of PDDA determination is titration with potassium polyvinyl sulphate[6-8]. Titration endpoint is usually recognized with streaming current detector[9]registering charged macromolecules in moving medium. Unfortunately, streaming current detector loses sensitivity in solutions with increased electrical conductivity[9-10]. Another approach for endpoint recognition is application of ortho-Toluidine Blue dye as indicator[7-8]. Ortho-Toluidine Blue dye undergoes color change from blue to pink-violet being coupled with anionic macromolecules hence titrant excess may be detected via visual observation[8,11]. More accurate approach consists in spectrophotometric measurements at 628-635 nm[11]. Unfortunately, ionic strength above 20 mM may affect interaction of ortho-Toluidine Blue dye with titrant[7-8]. This interference may be reduced using increased concentrations of the indicator dye. One more problem under polyelectrolyte titrations with optical detection is formation of colloidal suspensions disturbing color change recognition[7].
PDDA may be also assayed with UV-vis spectral measurements using appropriate color reagent. For example, gold nanoparticles were used for accurate determination of PDDA in environmental samples[12]. Very suitable reagents for PDDA determination proved to be anionic dyes[13-15]. Common problem of dye-binding assays is formation of suspensions disturbing spectral measurements. The present work takes advantage of suspension formation for recognition of equivalence point under titration of PDDA with Coomassie Brilliant Blue G dye (CBB). Similar procedure of spectrophotometric titration with Naphthol Blue Black dye proved to be feasible and accurate enough when applied for poly(hexamenthylene biguanide) determination[16]. Application of Coomassie Brilliant Blue G dye results in more pronounced absorbance drop and better sensitivity of the spectrophotometric titration method.
1 Experimental
1.1 Instruments
Spectrophotometer: Pharo 300 with 10 mm plastic cells. Automatic burette: Radelkis OP-930/1 controlled with a PC. Absorbance measurements under titrations were performed at 585 nm using monochromator from spectrophotometer Spekol 11, magnetically stirred 30 mL glass cell with 20 mm optical path length and light meter TES 1336A connected to the PC.
1.2 Reagents
CBB dye (Brillant Blau G 250) from Carl Roth and poly(diallyldimethylammonium chloride) of medium molar mass (100~200 kg·mol-1) from Aldrich were used. Stock solutions of CBB (1 mmol·L-1) and PDDA (1 mN) as well as diluted work solutions were stored in the dark. Ionic strength and pH of analyte solutions were adjusted to required values by means of 2 mol·L-1solutions of NaCl and HCl/NaOH, respectively.
1.3 Procedure
Samples of PDDA solutions (15 mL while another is not stated) with concentrations from 0.001 5 to 0.06 mN were titrated with 0.1 mM CBB solution. Both data acquisition and burette control were performed by means of custom software.
2 Results and discussion
Preliminary experiments reveal clearly that low soluble adduct is formed when certain quantity of CBB dye is added to PDDA solution (Fig.1). The solutions are homogenous when molar quantity of the dye is less than molar quantity of PDDA mers. Deep-blue flocks are formed when dye-to-polymer equivalent ratio slightly exceeds unity. Further increase of CBB quantity results in homogenous solutions again (Fig.1).

Fig.1 Appearance of PDDA solutions with increasing quantity of CBB dye added. Numbers indicate dye-to-polymer equivalent ratio
2.1 Spectral study
Spectral profiles taken from the solutions in question provide numerical evidence of the above-mentioned visual observations. In general, optical density of the solutions is increased following gradual increase of the dye content [Fig.2(a)]. The absorption maximum maintains at wavelength characteristic for anionic form of CBB dye, i.e. 585 nm. At very beginning absorbance at 585 nm rises linearly with the dye content. However, absorbance increase is inhibited at dye-to-polymer equivalent ratio equal to 1 [Fig.2(b)]. The probable cause is the dye-polymer complexes begin to lose solubility. The most conspicuous changes are registered at dye-to-polymer equivalent ratio equal to 1.1~1.2. The solution spectrum undergoes substantial distortion [Fig.2(a)] and overall absorbance of the solution is decreased [Fig.2(b)] following precipitate formation. Further increase of CBB dye concentration leads to recovery of typical spectral profile [Fig.2(a)]. Correspondingly, absorbance is increased again [Fig.2(b)].
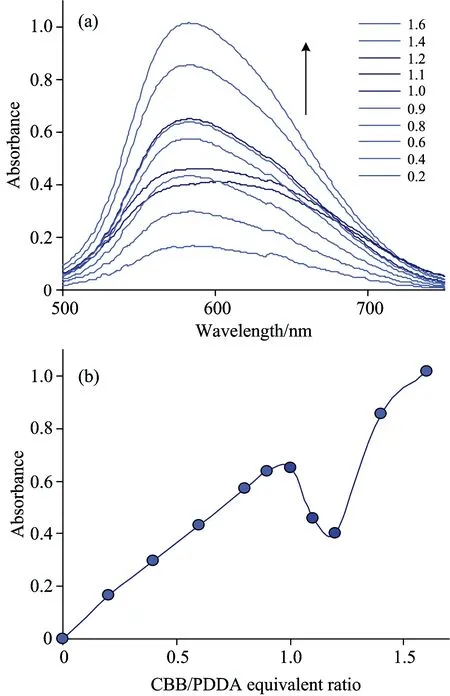
Fig.2 Vis spectra (a) and values of absorbance at 585 nm (b) depending on dye-to-polymer equivalent ratio. Concentration of PDDA equals 0.02 mN
One should to note that dye-polymer precipitate is formed rather slowly. Marked changes in solution spectrum are registered after 20 minutes [Fig.3(a)]. First visible flocks are formed after 2 hours resulting in substantial distortion of solution spectrum [Fig.3(a)]. Absorbance at 585 is halved for 3 hours [Fig.3(b)] following flocks sedimentation. Being no agitated, the precipitate flocks are settled slowly and absorbance is decreased overnight to value as small as 0.1. The observed slow precipitate formation may be explained taking in mind general mechanism of dye ion pair formation including fast electrostatic attraction followed by slow rearrangement of hydrophobic molecular fragments[17]. Magnitude of absorbance drop at nearly equivalent quantity of the dye added is far more pronounced as compared with that registered under titrations with Naphthalene Blue Black dye[16]. Apparently, bulk aromatic structure of CBB dye results in more hydrophobic aggregates making better possibilities for flocculation.

Fig.3 Time dependence of spectrum (a) and absorbance at 585 nm (b) of solution containing 0.02 mN PDDA and 0.024 mmol·L-1CBB
2.2 Spectrophotometric titration
Taking in mind the obtained spectral data (Figs.2), precise titrations were carried out registering absorbance at 585 nm. The obtained photometric curves are characterized with sharp drops (Fig.4).
The first inflection point of the titration curve appears close to dye-to-polymer ratio equal to 1. For that reason the local maximum of the curve was accepted as titration endpoint. Because of slow formation of precipitate flocks the titration endpoint can be recognized precisely under condition that dye dosing rate is slow enough. Figure 5 illustrates clearly that too rapid dosing may result in less sharp drop of absorbance and overestimation of titration endpoint. Optimal dosing rate proved to be dependent on analyte concentration. The larger is PDDA concentration, the larger titration rate may be applied. General recommendation for dosing rate is that the endpoint should be attained for 60 min or more.

Fig.4 Tracks of spectrophotometric titrations at indicated PDDA concentrations and CBB dosing rates

Fig.5 Effect of dosing rate on tracks of spectrophotometric titration of 0.042 mN PDDA solution
In order to improve endpoint recognition at low PDDA concentrations one can also reduce titration increment. Titration curves proved to be much more smooth lines when reduced titration increment was applied together with reduced dosing rate and increased volume of analyte solution-compare Figures 6(a) and (b). Thereby inflection points are well recognizable at PDDA concentrations as low as 0.002~0.003 mN [Fig.6(b)].
Applying the optimized titration rate, perfectly rectilinear dependence of endpoint volume on PDDA concentration was obtained (Fig.7). Quite good values of variance,σ2and standard deviation,σ(Table 1) confirm good repeatability of the proposed method. Recovery proved to have acceptable values as well (Table 1). The highest measurable concentration of PDDA proved to be equal 0.06 mN. Apparently, the upper limit of PDDA concentration may be increased applying titration cell with increased volume and decreased optical path. The minimal measurable PDDA concentration proved to be equal 0.002 mN. The registered value is far lower as compared to limit of determination registered for titrations with Naphthalene Blue Black dye (0.05 μN)[16]. The obvious cause is good flocculation ability of CBB dye used in this study. Influence of analyte solution characteristics on titration results is shown in Fig.8. Uncertainty of results may exceed 10% in case pH value goes beyond the range from 6 to 8 or ionic strength exceeds 2 mmol·L-1.

Fig.6 Tracks of spectrophotometric titrations at indicated PDDA concentrations and CBB dosing rates. Sample volume and titration increment are equal 15 mL and 20 μL (a) as well as 20 mL and 2 μL (b)

Fig.7 Relationship between PDDA concentration and titration volume at the endpoint

Table 1 Statistical parameters of the spectrophotometric titration
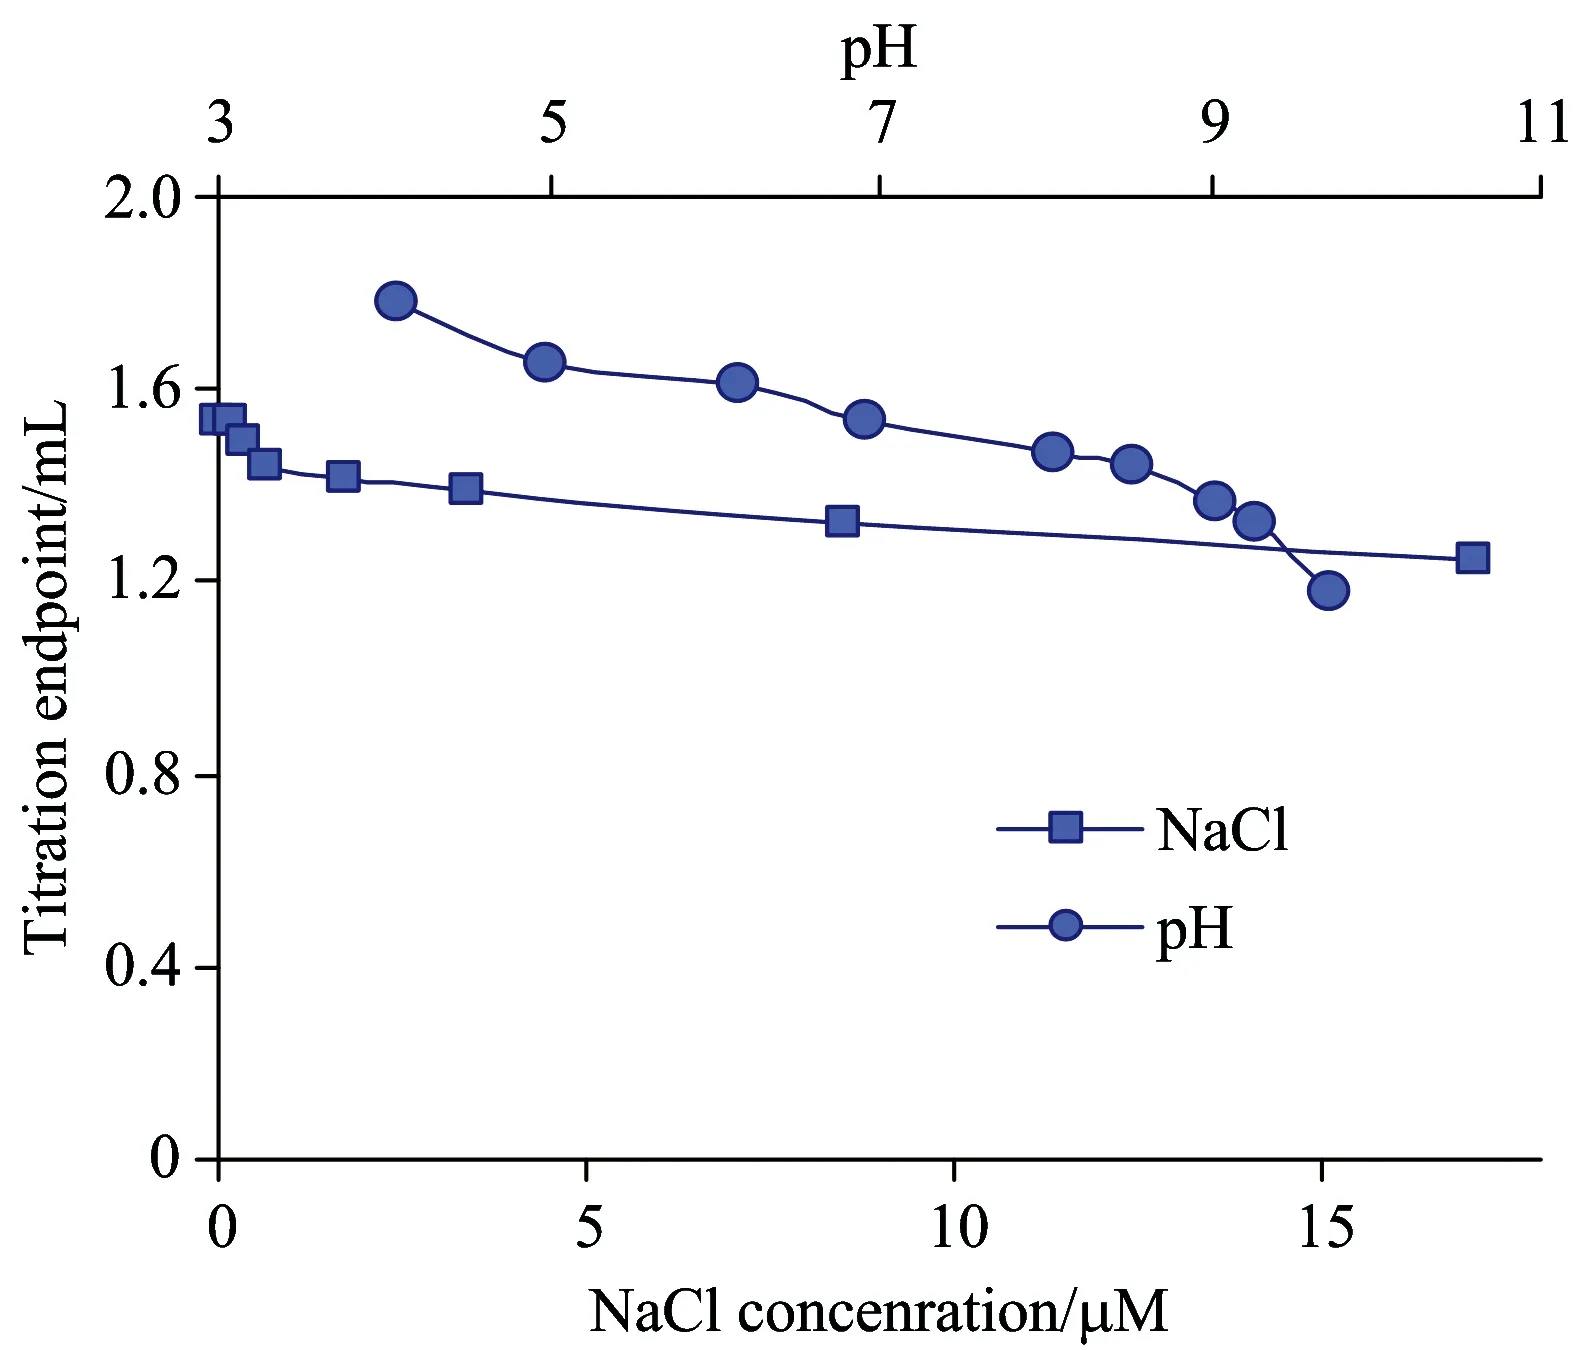
Fig.8 Effect of pH and ionic strength on endpoint volume under titration of 0.01 mN PDDA solution
3 Conclusion
Spectrophotometric titration with CBB standardized solution proved to be feasible method of PDDA determination. Exactly neutralized cationic macromolecules form large flocks with CBB dye resulting in pronounced drop of solution absorbance and reliable recognition of titration endpoint. The proposed method possesses good repeatability and precision.
[1] Wang S, Liu C, Li Q. Water Res., 2013, 47(13): 4538.
[2] Piazza G J, Lora J H, Garcia R A. Bioresour. Technol., 2014, 152: 548.
[3] Petzold G, Schwarz S, Lieske A. Wochenbl. Papierfabr., 2010, 138(2): 112.
[4] Chin S M, Youn H J, Ryu J, et al. Nord. Pulp Pap. Res. J., 2012, 27(5): 915.
[5] Cumming J L, Hawker D W, Matthews C, et al. Toxicol. Environ. Chem., 2010, 92(9): 1595.
[6] Masadome T. Talanta, 2003, 59(4): 659.
[7] Mocchiutti P, Zanuttini M A. BioResources, 2007, 2(3): 399.
[8] Cumming J, Hawker D, Chapman H, et al. Water Air Soil Pollut., 2011, 216(1-4): 441.
[9] Pelton R, Cabane B, Cui Y, et al. Anal. Chem., 2007, 79(21): 8114.
[10] Hubbe M A. Paper Technology, 2008, 49(6): 21.
[11] Gumbi B, Ngila J C, Ndungu P G. Phys. Chem. Earth, 2014, 67-69: 117.
[12] Gumbi B, Ngila J C, Ndungu P G. Anal. Methods, 2014, 6(17): 6963.
[13] Mwangi I W, Ngila C J, Ndungu P. Water SA, 2012, 38(5): 707.
[14] Zió?kowska D, Shyichuk A, ?elazko K. Polimery, 2012, 57(4): 303.
[15] Subrizi F, Crucianelli M, Grossi V, et al. ACS Catal., 2014, 4(3): 810.
[16] Zió?kowska D, Syrotynska I, Shyichuk A. Polimery, 2014, 59(2): 160.
[17] Aminian M, Nabatchian F, Vaisi-Raygani A, et al. Anal. Biochem., 2013, 434(2): 287.
O657.3
A
2015-06-20; accepted: 2015-08-10
10.3964/j.issn.1000-0593(2016)02-0583-05
*Corresponding author e-mail szyjczuk@utp.edu.pl