基于数值模拟的SHPB实验数据处理方法
2016-04-25张军徽
张军徽,尚 兵
(1.北方工业大学土木工程学院,北京 100144; 2.广州航海学院航务工程系,广东广州 510725)
1 Introduction
SHPB has been widely used to test the properties of materials at high strain rates.[1-4]But there are some factors that affect the accuracy of the measurement.The main aspects that determine the accuracy of the measurement in SHPB experiment can be classified in five types.The first type is related to the SHPB basic assumptions.[5]The SHPB technique is based on two assumptions,namely,the assumption of one-dimensional stress wave propagation in bars and that of stress uniformity along the specimen thickness.The second type is related to the accuracy of the forces and the velocities at the specimen boundaries provided by the SHPB system.The third type is related to the interface friction between the specimen and the bars.[6-7]The fourth type is of weather the inertial response of the specimen could be neglected.The fifth type is how to process the data of the SHPB experiment.
The following factors affect the data processing.First,the three basic waves are measured at sections other than the bar-specimen interfaces.They have to be shifted from the strain gauges to the specimen faces.Waves change in their shapes (wave dispersion) on propagating along the bar.Second,the exact time shifting for the three waves has to be identified and the proper formulae have to be selected.When one SHPB experiment has been completed,the wave signals are recorded.Although there are some factors that may affect the accuracy of measurement,such as the errors due to stress equilibrium,inertia response and interface friction, the data processing method can be adopted to improve the final accuracy.
The influence of the time shifting is analyzed by numerical simulations and the results obtained from different processing methods are assessed.Furthermore a data processing program is developed,visually showing the three basic waves recorded and the corresponding stress-strain curves obtained by using the different processing methods,by adjusting the relative starting-times of those three basic waves.
2 SHPB Data Processing Methods
A typical SHPB set-up is sketched in Fig.1.[8]It is composed of a long input bar and a long output bar with a short specimen sandwiched between them.The impact of the bullet at the free end of the input bar develops a compressive longitudinal incident waveεi(t).Once it arrives at the bar specimen interface,a reflected waveεr(t) is developed in the input bar,whereas a transmitted waveεt(t) is developed in the output bar.The three basic waves are recorded by the strain gauges respectively in the input and output bars.

Fig.1 The schematic diagram of a SHPB setup
During the numerical simulation experiments,the bars must remain elastic and should be long enough to avoid the overlapping from the incident and the reflected elastic waves.So the following assumptions are made:
(a) The wave propagation in the bars is well approximated by the one-dimensional wave propagation theory,implying that the radial-inertia and the friction effects of the specimen are all negligible.
(b) The stress and the strain in the specimens are uniformly distributed in the axial direction.
Based on the first assumption,the strain rate,the strain,and the stress histories in the specimen can be calculated from the recorded bar-surface strain signals with the following equations,namely:[9]
(1) Three waves method (Kolsky,1949)
Whereεi,εrandεtare incident,reflected,and transmitted strain histories,respectively;Ais the cross-sectional area of the bars;EandCare Young’s modulus and elastic wave speed in the bar material,respectively;A0andl0stand for the initial cross-sectional area and the length of the specimen,respectively.
When the second assumption is satisfied,namely the specimen is in a state of uniform stress,we have
E[εi(t)+εr(t)]=Eεt(t)
(4)
The Eqs.(1)-(3) can be simplified either to Eqs.(5)-(7) or to Eqs.(8)-(10),as follows.
(2) Two-wave-1 method,using the incident and transmitted waves to calculate the stress-strain curve
(3) Two-wave-2 method,using the incident and reflected waves to calculate the stress-strain curve
Theoretically,when the above two basic assumptions are satisfied,the results obtained by the three-wave method and the two-wave method should be consistent.However,it is not the case in practice,particularly depending on the time-shifting technique.In the following,we will discuss this problem through the numerical simulation experiment.
(4) Three-wave mutual-checking method
The three-wave mutual-checking method (3W-MC-M) was proposed by Shangetal.[10]It is based on the original three waves method,while a time-shifting method is introduced to correctly adjust the relative starting-time position of the basic waves.In fact,an arbitrarily adjusting of the relative position of the three waves may cause a new error.In the 3W-MC-M the time-shifting is based on the following two characteristics,so that the error decreases and the material constitutive behavior obtained is more credible.
According to momentum conservation,the difference of transmitted and incident waves should be equal to the reflective wave.So when we process the data,we can adjust the relative position of basic waves till this character is satisfied.In this way,we can avoid the time shifting error.
According to the basic assumptions of the SHPB experiment,two waves method and three waves method should provide a consistent stress-strain curve.We adjust the relative position of basic waves till the stress-strain curves calculated from different methods are as identical as possible.
Those two characteristics are equivalent.They will be satisfied simultaneously,when the time shifting is accurate.In the following,we will analyse the curves obtained from different methods through numerical simulation experiments.
3 Finite Element Simulations of SHPB Experiment on Steel
To ensure a reasonable uniformity of the stress within the specimen,the length of the specimen should be much smaller than that the of stress wave.Steel is usually regarded as a homogeneous isotropic material,so the thickness of the specimen can be small.The assumption of the stress uniformity is satisfied better than e.g. concrete-like materials.Theoretically,the stress-strain curves obtained from the above-mentioned different method are approximately the same.
In this study,the technology of pulse shaping is used.The conventional split Hopkinson pressure bar apparatus is modified by shaping the incident wave so that the specimen is in a dynamic stress equilibrium and has a nearly constant strain rate over most of the test duration.[11-12]
3.1 Numerical Model
The calculations are performed using the general-purpose finite element code Abaqus/Explicit version 6.10 with element type CAX4R(axis symmetric element,reduced integration).Parameters of the bar:Young’s modulusE=210 GPa,Poisson’s ratioγ=0.3,DiameterDb=14 mm,Densityρ=7 850 kg/m3.The position of strain gauge can be confirmed through Fig.1.L1=0.75 m,L2=0.75 m,L3=0.33 m.These parameters can confirm the time shifting,and separate the incident,transmitted and reflected waves.
Davies and Hunter showed that the slenderness ratio plays opposite roles on axial and lateral inertia effects and an optimal slenderness ratio exists[13]
(11)

(12)
In order to avoid the effect of friction,we set the friction coefficient of the bar/specimen interfaceμ=0.All boundaries are free.Loading consisted of hitting the input bar with a pressure pulse[14]are plotted in Fig.2.
3.2 Results and Discussion
During the analysis special attention was focused on the development of the data processing methods.The strain histories of pointsBandEin Fig.1 are regarded as that of the strain Gauges 1 and 2 which are plotted in Fig.3.Curve 1 is the strain history of pointB,and curve 2 that of pointE.
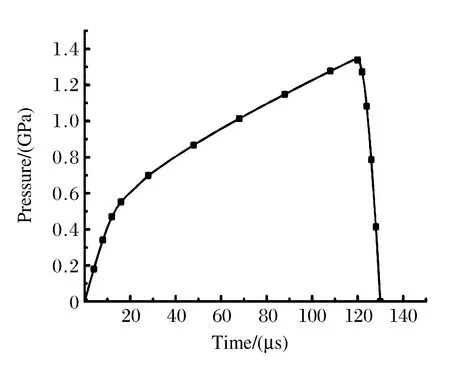
Fig.2 Loading pressure pulse
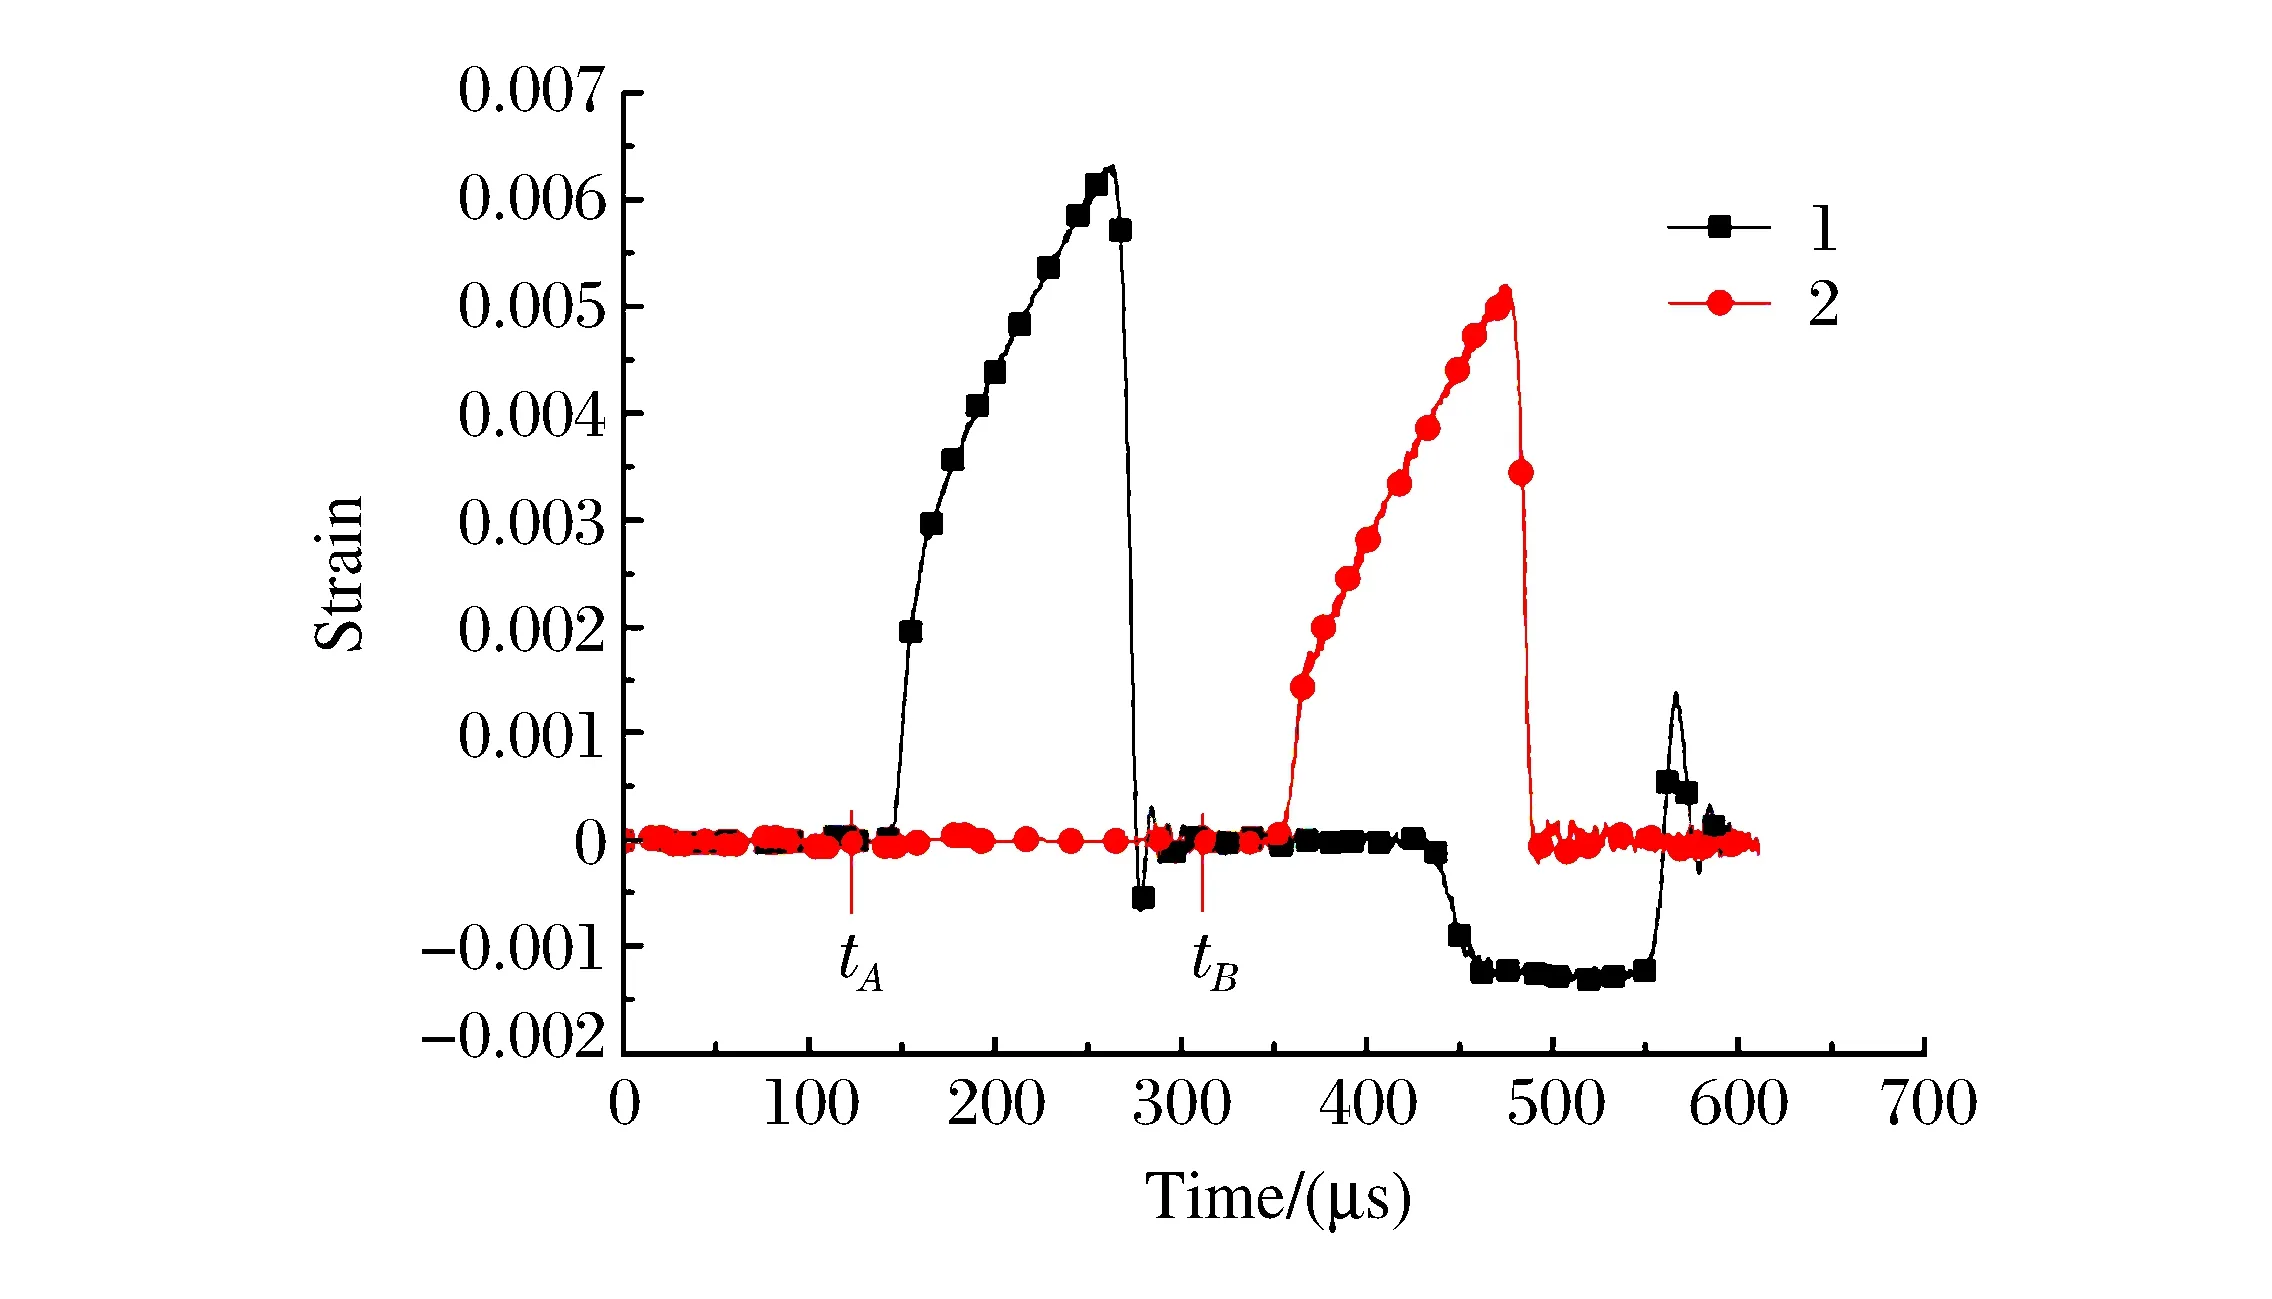
Fig.3 Strain histories of points B and E in a numerical SHPB test
The strain rate,strain and stress histories of the material under investigation are calculated with Eqs.(1)-(10).However,the reflected and transmitted signals are measured at different locations on the bars,or equivalently at different time.Note that Eqs.(1)-(10) are deduced for the waves at the specimen/bar interfaces.The measured waves thus must be synchronized,which turns out to be critical in data processing.
In principle,the waves measured at the strain gauge locations should be shifted to the specimen/bar interfaces before the equations are applied.There are two issues in practical experiments associated with the shift.One is the wave dispersion associated with the transverse inertia effects of waves propagating along an actual 3-D rod;and the other is the determination of the starting point of each of the waves for proper synchronization.Wave dispersions should be either experimentally eliminated or numerically corrected,which is not discussed here.We assume the duration of the incident,reflected and transmitted wave are the same,and select the duration oftA-tBin Fig.3 as the basic duration of the incident wave.So
The history of reflected wave is
tA+2L2/cb~tB+2L2/cb
(13)
The history of the transmitted wave is
tA+(L2+L3)/cb+Ls/cs~tB+(L2+L3)/cb+Ls/cs
(14)
WhereL2andL3are the distances from the strain gauge locations on the incident and the transmission bars to the bar/specimen interfaces,respectively (Fig.1);Lsis the length of specimen;cbis the stress wave speed in the bars;csis the stress wave speed in the specimen material,which often needs to be estimated.[15]So some artificial errors exist.In fact,when we do SHPB experiment,the errors of distance and wave speed exist objectively.How to avoid the errors? Three-wave mutual-checking method needn’t use the Eq.(13) and (14),so these errors can be avoided.In the following,we first introduce the process of three-wave mutual-checking method,and then prove its validity.
We select the starting pointtAand end pointtBof the incident wave (Fig.3).The start points of the transmitted and reflected waves can be selected arbitrarily.The duration of the three waves is assumed as the same,so the end points of the transmitted and reflected waves can be calculated throughtAandtB.Then we synchronize the signals,just like Fig.4(a).
The basic waves are plotted in Fig.4(a),where curve 1 is the incident wave,curve 2 the transmitted wave,curve 3 the reflected wave,and curve 4 the difference of the transmitted wave and the incident wave.
Fig.4(b) shows the stress-strain relation obtained from the waves and the relative position in Fig.4(a).CurvesA,BandCare the stress-strain relations calculated from two-wave method 1,two-wave method 2,and three waves method.
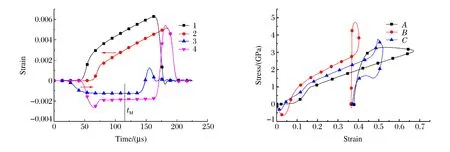
Fig.4(a) The waves and their relative positions Fig.4(b) The stress-strain curves obtained from Fig.4(a)
Obviously,those results are incorrect,because firstly the momentum is not conservative,for example,at the time oftM(Fig.4(a)).Secondly,the stress-strain curves calculated from different methods are not consistent (Fig.4(b)).So we need to adjust the relative positions of the basic waves.
Then we shift the transmitted wave and the reflected wave (change their starting points),and obtain the Fig.5,where curve 1 is the incident wave,curve 2 is the transmitted wave,curve 3 is the reflected wave,curve 4 is the difference of the transmitted wave and the incident wave.In Fig.5(b),the curvesA,BandCare the stress-strain relations calculated from the two-wave method 1,the two-wave method 2 and the three waves method respectively.It seems that the results are still not satisfactory too,since the stress-strain curves determined from the different methods are not consistent.But it looks better than the results in Fig.4.
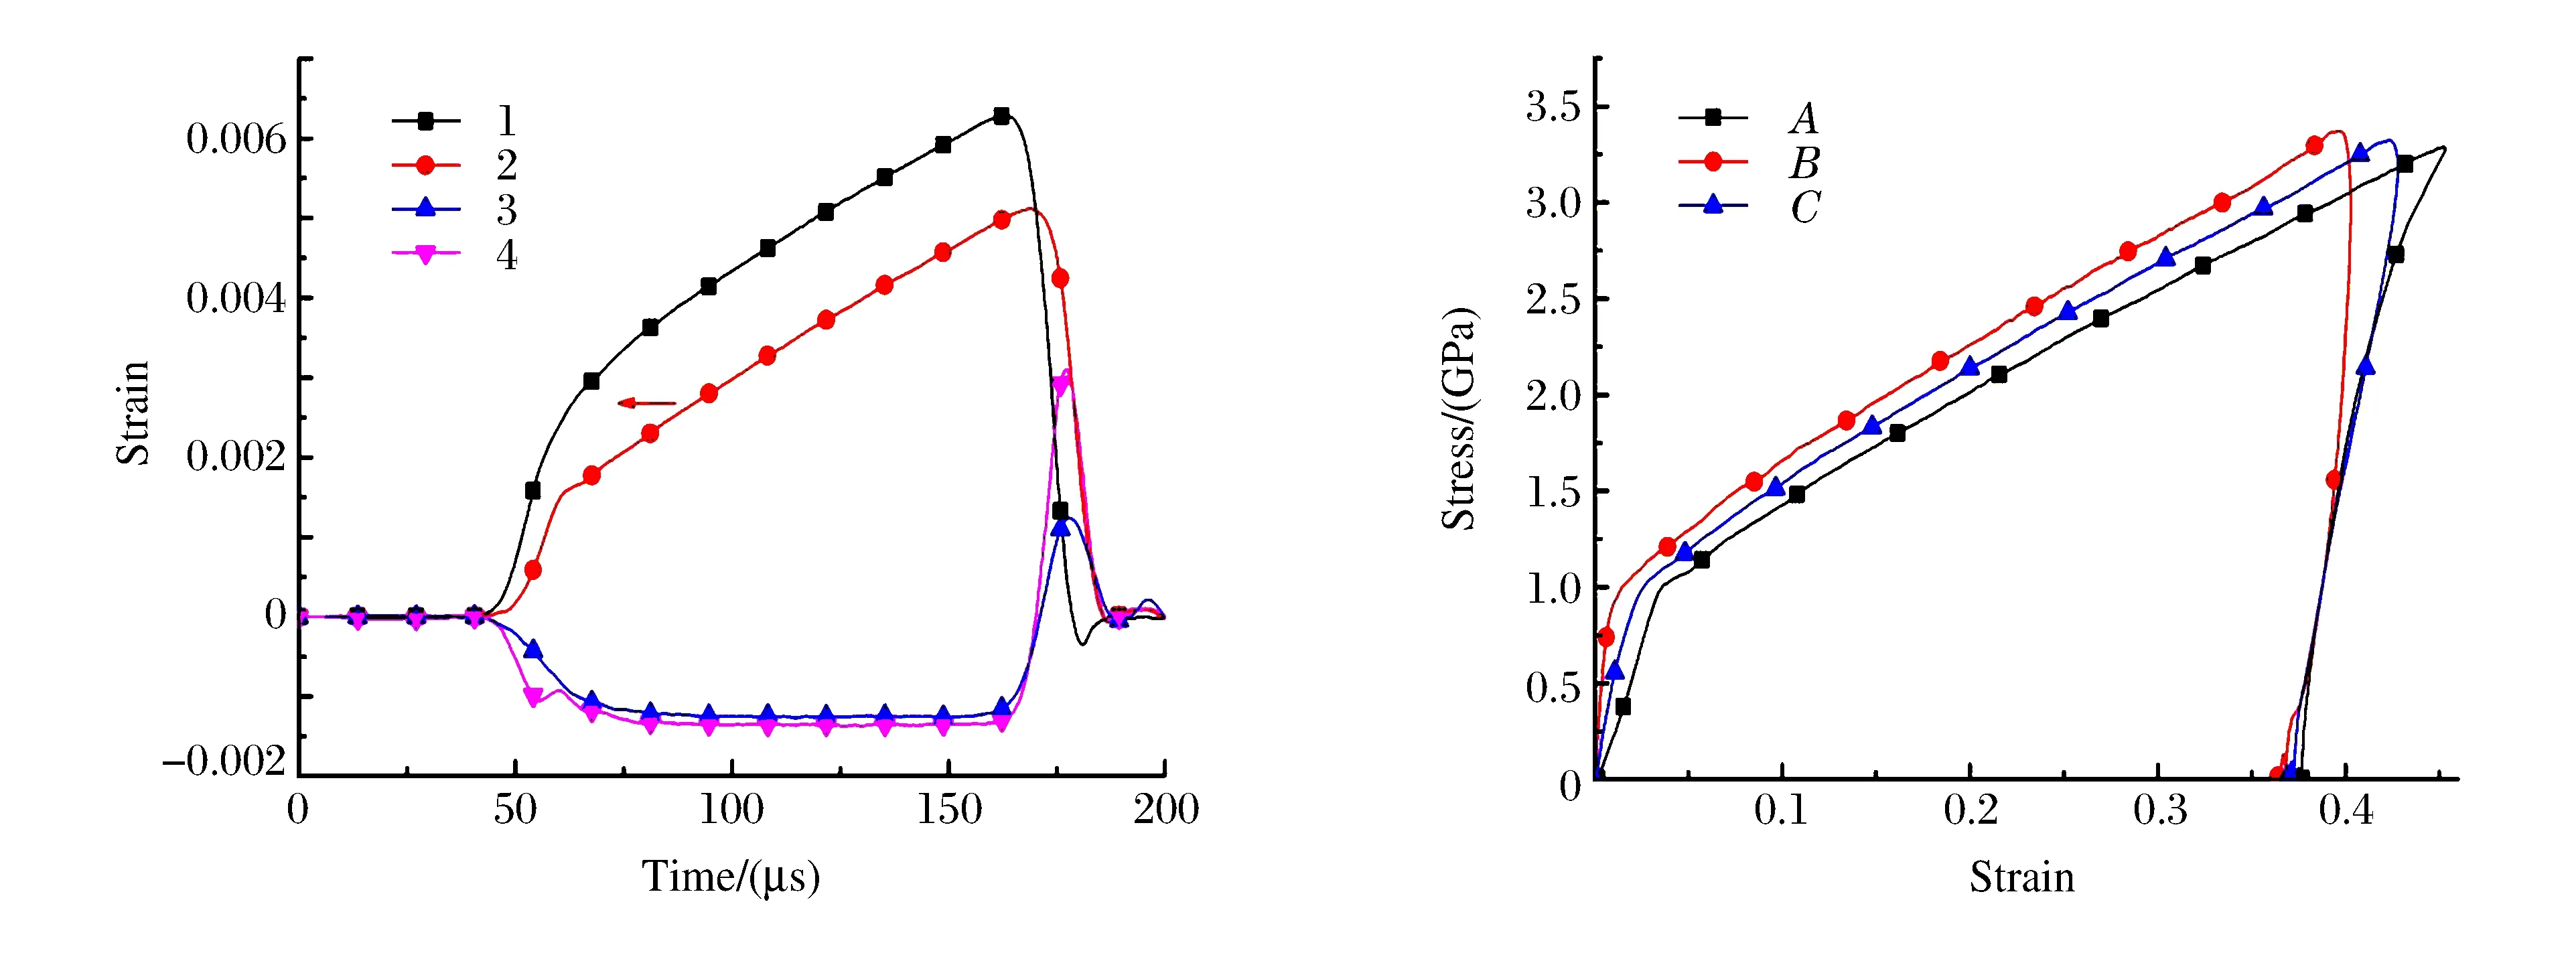
Fig.5(a) The waves and their relative positions Fig.5(b) The stress-strain curves obtained from Fig.5(a)
We further adjust the relative positions of the basic waves.Then we obtain the Fig.6.The legends in Fig.6 are the same as in Fig.5.
As can be seen,the curve 3 and curve 4 in Fig.6(a) are now approximately the same.This characteristic reflects the momentum conservation.Correspondingly,the curvesA,BandCare almost consistent.So the stress-strain curves,shown in Fig.6(b),satisfactorily reflect the constitutive behavior of the specimen.
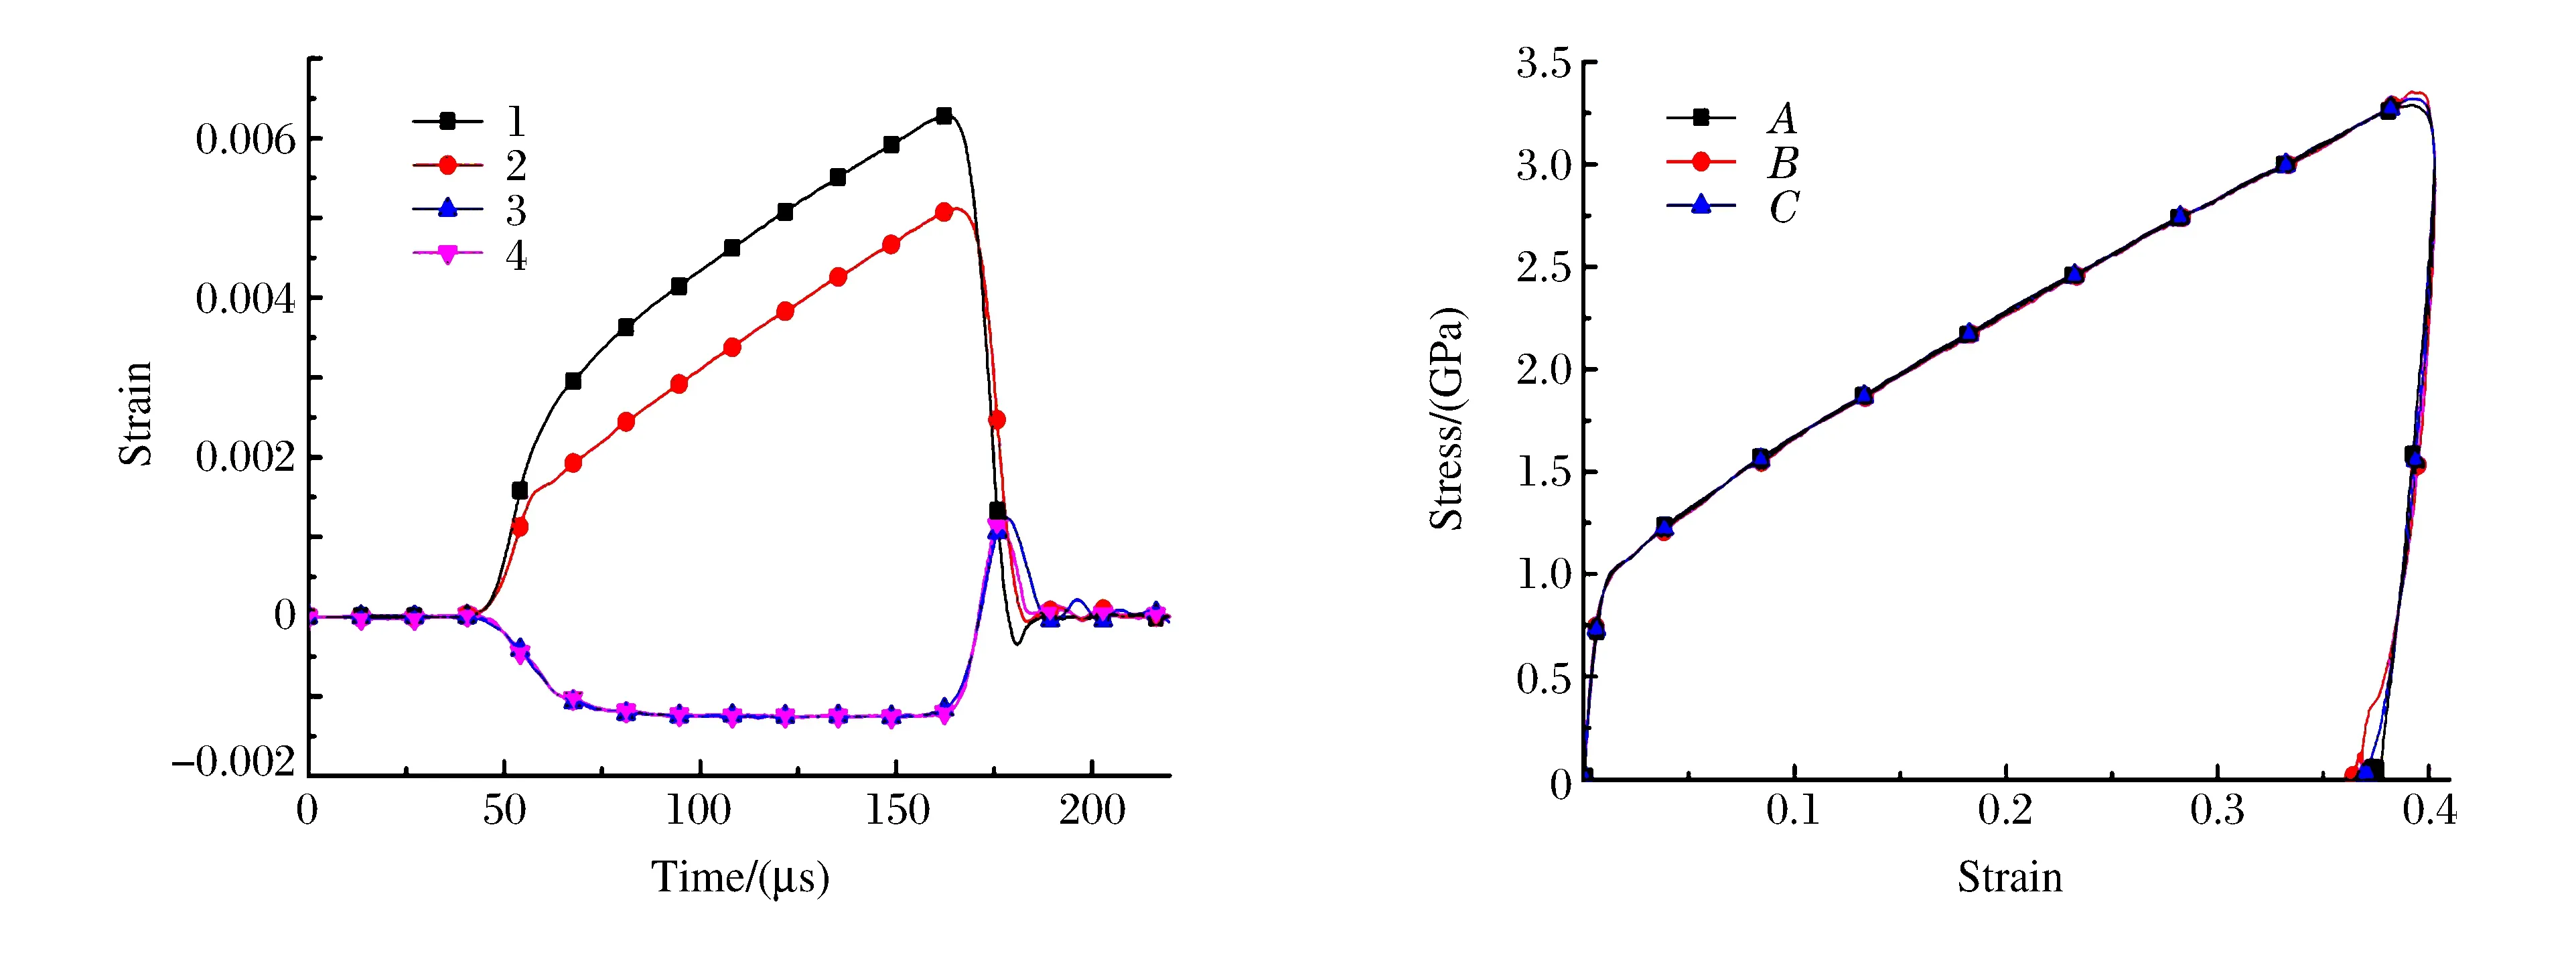
Fig.6(a) The waves and their relative positions Fig.6(b) The stress-strain curves obtained from Fig.6(a)
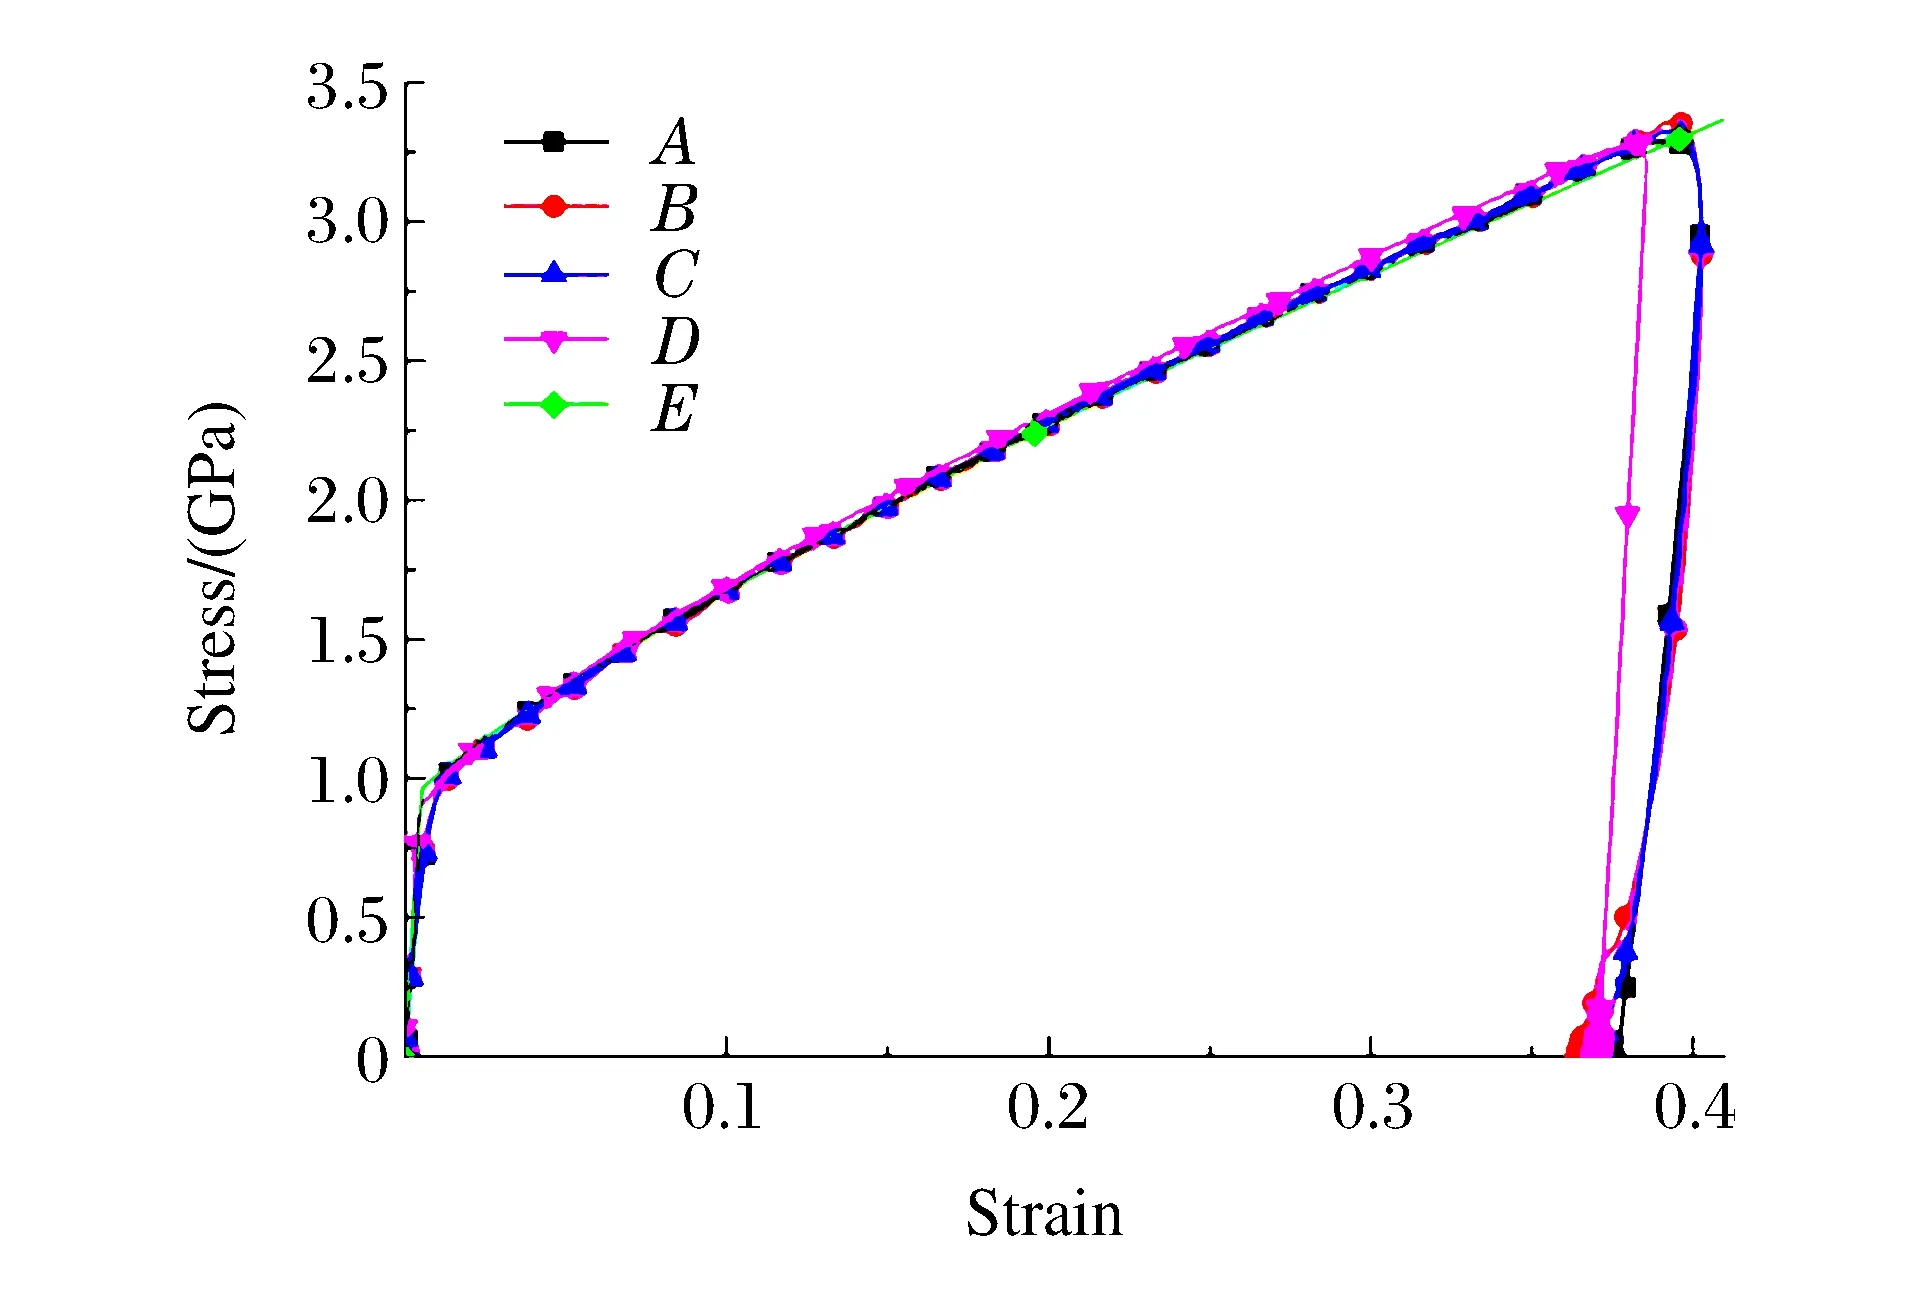
Fig.7 Comparison of stress-strain curves
The comparisons of the stress-strain curves obtained from different methods are shown in Fig.7,where the curvesA,BandCare the same as the stress-strain curves plotted in Fig.6(b),the curveDis calculated from the finite element,the curveEis obtained from the Johnson-Cook model (Eq.(12)),taking the strain rate as 3.7×10³s-1.All the curves are almost consistent with each other,which proves that the stress-strain curves obtained by the three-wave mutual-checking method are reliable.
4 Conclusions
(1) Numerical simulations show that the two waves method and the three waves method are equivalent for small specimens,if the assumption of dynamic stress equilibrium in specimen can be satisfied,and thus the result is reliable.
(2) For homogeneous isotopic materials,such as steel,copper etc.,the three-wave mutual-checking method can avoid the error due to time shifting.
(3) The three-wave mutual-checking method is established by satisfying two characters,namely:first,the momentum conservation;and second,all the curves obtained from different method are consistent with each other.
[1] TAI Y S.Uniaxial compression tests at various loading rates for reactive powder concrete [J].Theor Appl Fract Mech,2009.52(1):14-21.
[2] SONG B,CHEN W N,LUK V.Impact compressive response of dry sand [J].Mech Mater,2009,41(6):777-785.
[3] SHI B,ATTIA M H.Evaluation criteria of the constitutive law formulation for the metal-cutting process[J].J Eng Manufact,2010,224(B9):1313-1328.
[4] LEE O S,HWANG S W,CHOI H B,et al.Dynamic deformation of aluminum alloys at high temperature by using SHPB techniques [C]//9th International Conference on the Mechanical and Physical Behaviour of Materials under Dynamic Loading.Brussels,Belgium,2009:26-32.
[5] LEE O S,LEE J Y,KIM G H,et al.High strain-rate deformation of composite materials using a split Hopkinson bar technique [J].Key Eng Mater,2000,183:307-312.
[6] TRAUTMANN A,SIVIOUR C R,WALLEY S M,et al.Lubrication of polycarbonate at cryogenic temperatures in the split Hopkinson pressure bar [J].Int J Impact Eng,2005,31(5):523-544.
[7] SHAZLY M,PRAKASH V,LERCH B A.High strain-rate behavior of ice under uniaxial compression [J].Int J Solids Struct,2009,46(6):1499-1515.
[8] GRAY G T Ⅲ.Classic split-Hopkinson pressure bar technique.Mechanical testing and evaluation [M].Novelty,OH:ASM,2000:8-14.
[9] WANG L L,ZHU J,HU S S.An analysis of stress uniformity for concrete-like specimens during SHPB tests [J].Int J Impact Eng,2009,36(1):61-72.
[10] 尚 兵,胡时胜,姜锡权.金属材料SHPB实验数据处理的三波校核法 [J].爆炸与冲击,2010(4):429-432.
SHANG B,HU S S,JIANG X Q.A three-wave coupling method for data treatment in SHPB experiments with metal samples [J].Explosion and Shock Waves,2010,30(4):429-432.
[11] FREW D J,FORRESTAL M J,CHEN W.Pulse shaping techniques for testing brittle materials with a split Hopkinson pressure bar [J].Exp Mech,2002,42(1):93-106.
[12] FREW D J,FORRESTAL M J,CHEN W.A split Hopkinson pressure bar technique to determine compressive stress-strain data for rock materials [J].Exp Mech,2001,41(1):40-46.
[13] LI Q M,MENG H.About the dynamic strength enhancement of concrete-like materials in a split Hopkinson pressure bar test [J].Int J Solids Struct,2003,40(2):343-360.
[14] HUA Z,ZHU W H,WANG G D.The study of numerical character for femtosecond pulse shaping [J].Chinese Physics,2007,16(11):3429-3433.
[15] CHEN W,SONG B.Split Hopkinson (Kolsky) bar:Desing,testing and applications [M].New York:Springer,2011:22-36.
