Self-adaptive Green-Ampt inf i ltration parameters obtained from measured moisture processes
2016-04-18WenwenLingYongshuZhuLiChenbZhongboYu
*,Wen-wen LingYong-shu ZhuLi Chenb,Zhong-bo Yu
aState Key Laboratory of Hydrology-Water Resources and Hydraulic Engineering,Hohai University,Nanjing 210098,China
bDesert Research Institute,Las Vegas,NV 89119,USA
Self-adaptive Green-Ampt inf i ltration parameters obtained from measured moisture processes
Long Xianga,*,Wen-wen Linga,Yong-shu Zhua,Li Chena,b,Zhong-bo Yua
aState Key Laboratory of Hydrology-Water Resources and Hydraulic Engineering,Hohai University,Nanjing 210098,China
bDesert Research Institute,Las Vegas,NV 89119,USA
Available online 30 September 2016
The Green-Ampt(G-A)inf i ltration model(i.e.,the G-A model)is often used to characterize the inf i ltration process in hydrology.The parameters of the G-A model are critical in applications for the prediction of inf i ltration and associated rainfall-runoff processes.Previous approaches to determining the G-A parameters have depended on pedotransfer functions(PTFs)or estimates from experimental results,usually without providing optimum values.In this study,rainfall simulators with soil moisture measurements were used to generate rainfall in various experimental plots.Observed runoff data and soil moisture dynamic data were jointly used to yield the inf i ltration processes,and an improved self-adaptive method was used to optimize the G-A parameters for various types of soil under different rainfall conditions.The two G-A parameters,i.e.,the effective hydraulic conductivity and the effective capillary drive at the wetting front,were determined simultaneously to describe the relationships between rainfall,runoff,and inf i ltration processes.Through a designed experiment,the method for determining the GA parameters was proved to be reliable in ref l ecting the effects of pedologic background in G-A type inf i ltration cases and deriving the optimum G-A parameters.Unlike PTF methods,this approach estimates the G-A parameters directly from inf i ltration curves obtained from rainfall simulation experiments so that it can be used to determine site-specif i c parameters.This study provides a self-adaptive method of optimizing the G-A parameters through designed field experiments.The parameters derived from field-measured rainfall-inf i ltration processes are more reliable and applicable to hydrological models.
Green-Ampt model;Levenberg-Marquardt algorithm;Parameter optimization;Ungauged basin;Pedotransfer function
1.Introduction
Inf i ltration plays an important role in terrestrial hydrologic processes.It affects the runoff generation process and is dramatically inf l uenced by the soil hydraulic properties and soil porous texture(Sivakumar,2015).Most physically based hydrologic models have described the relationships between rainfall,runoff,and inf i ltration processes implicitly or explicitly(Lee et al.,2015).The Green-Ampt(G-A)inf i ltration model(Green and Ampt,1911)is one such model based on the soil porous media characteristics(Prevedello et al.,2009).It is widely used in the hydrologic field due to its reasonable physical mechanism and easy-to-solve solution(Govindaraju et al.,1996;Ma et al.,2010;O'Brienet al.,2009;Silburn and Connolly,1995;Wang et al.,2010). For example,both the FLO-2D model in Maricopa County and the Water Erosion Prediction Project(WEPP)model of the U.S.Department of Agriculture(USDA)(Dun et al., 2009;Risse et al.,1995)have adopted the G-A model for rainfall-runoff prediction.Meanwhile,many researchers have improved the G-A model in order to adapt it to more complex soil systems(Gowdish and Munoz-Carpena,2009).They have focused on solving the equations and estimating its parameters theoretically(Regalado et al.,2005;Verbist et al., 2010).The most common method is to make use of pedotransfer functions(PTFs)(Brooks and Corey,1966)to calculate the parameters of the G-A model(Rawls et al., 1983;Regalado et al.,2005).They also suggest that it is reasonable to use half of the saturation conductivity as the effective conductivity(Bouwer,1966).This hypothesis has been commonly accepted in practice.However,it has limitations when the G-A model is used in the field(van den Putte et al.,2013).In order to avoid the limitations,ring inf i ltrometers were used to measure the hydraulic conductivity by imposing ponded conditions in some field experimental methods(Angermann et al.,2002;Esteves et al.,2000; Galbiati and Savi,1995;Mohamoud,1991;Reynolds,2010; Suleiman and Swartzendruber,2003).However,this method is not f i t for non-ponded initial conditions when the G-A model is used.On the other hand,some researchers have used rainfall simulators for the parameterization of the G-A model (Esteves et al.,2000;Rawls et al.,1992;Suleiman and Swartzendruber,2003;Valiantzas,2010;Taskinen et al., 2008).In those studies,the measured runoff data(the runoff process is an indirect part of the inf i ltration process) were used to calibrate the G-A model and to generate best fi tting parameters for the model.However,the uncertainty of observed data series decreases the reliability of the parameters and at the same time prevents derivation of multiparameters to describe the relationships between the coupled equations put forward by Athira and Sudheer(2015). To solve these problems,we designed an inf i ltration equipment for small-scale rainfall experiments through a moisture survey and developed a parameter optimization algorithm to derive the G-A parameters using the measured data.
In this study,rainfall simulators were set up in various experimental plots based on a typical pedologic background. Accumulated inf i ltration curves and moisture dynamic data were obtained in the experiments.High-intensity rainfall experiments were conducted in each plot and inf i ltration curves were yielded under the simulated rainfall conditions.Then,a new self-adaptive optimization approach based on the Levenberg-Marquardt(LM)algorithm(Marquardt,1963)was validated theoretically,in order to estimate the G-A parameters directly from these data,and a quantified relationship between soil textures and the G-A parameters was built through comparison with the parameters derived directly from the PTF method.Based on these data,the method for extraction of the G-A parameters based on the pedologic background was developed for high-resolution distributed hydrologic models.
2.Materials and methods
2.1.Optimization setup
Since the G-A model was presented by Green and Ampt (1911),it has been modified by several researchers.Mein and Larson(1973)extended the model from ponded conditions to constant intensity conditions.Chu(1978)applied this model to unsteadyrainfallintensities.Inthese studies,the G-Amodel was treated as two parts:under the steady state,the inf i ltration rate equals the rainfall intensity before ponding;as the wetting front moves downwards with time,ponding occurs and the integrated version of the G-A model after ponding can be expressed as

where I is the vertical accumulative inf i ltration depth;S is the soil capillary drive at the wetting front;θiand θsare initial and saturated water contents,respectively;Keis the effective hydraulic conductivity;t is time;the tpis the ponding time,and tp=Ip/P,in which P is the rainfall intensity(P>Ke)and Ipis the inf i ltration depth at tp,which is calculated as follows:

tsis a virtual time def i ned as follows:

To implicitly calculate I in Eq.(1),four parameters are needed:Ke,S,θs,and θi.In Eq.(1),S,θs,and θialways have an integrity form of S(θs-θi).This can be simplified to one parameter M,where M=S(θs-θi).The parameters to be optimized are then reduced to two:Keand M.
The self-adaptive optimization algorithms can be categorized as local and global search methods.Depending on the hill-climbing strategy,search algorithms can be divided into direct and gradient-based methods.Gradient-based methods use the information about the gradient of the objective function and direct search methods use only the information about the objective function value.In this study,we chose a gradientbased method,the LM algorithm,as our optimization method. The general object of the LM algorithm is to minimize the sum of the square residuals(Eq.(4))by gradually changing the optimized parameters.Its objective function is assumed to be the nonlinear least squares problems as follows:

where yiis the observed data series at time step i,f(xi,β)is the optimized series using the optimized parameter β,xiis a variable,and m is the maximum series number.f(xi,β)in this study was solved implicitly through Eq.(1)using the Newton method because the G-A model is an implicit function for accumulated inf i ltration series.Each time step is recorded as i(i=1,2,···,t)in correspondence to accumulated inf i ltration at time t.As shown in Eq.(1),the total errors between simulated and observed values for accumulated inf i ltration can be provided by Eq.(5)at different duration times related to the same parameters through the Newton method.In Eq. (5),we def i ne the objective function,which is the same as that required in the LM algorithm,but the change of parameters changes the whole inf i ltration process.The objective function in Eq.(5)focuses on the parameters'domains and their optimized climbing paths.Under the two parameter conditions,the objective function can be written as

where I is the vertical accumulative inf i ltration depth,and its observed value in this equation is related to time t;and the ponding time is related to M and Kein various combinations. We rebuilt tsand Ipas the function,so the Jacobian of the objective function can be derived as follows:
Using tp=Ip/P and Eq.(3),we obtain

Similarly,using Eqs.(2),(3),and(5),we obtain the following equations:
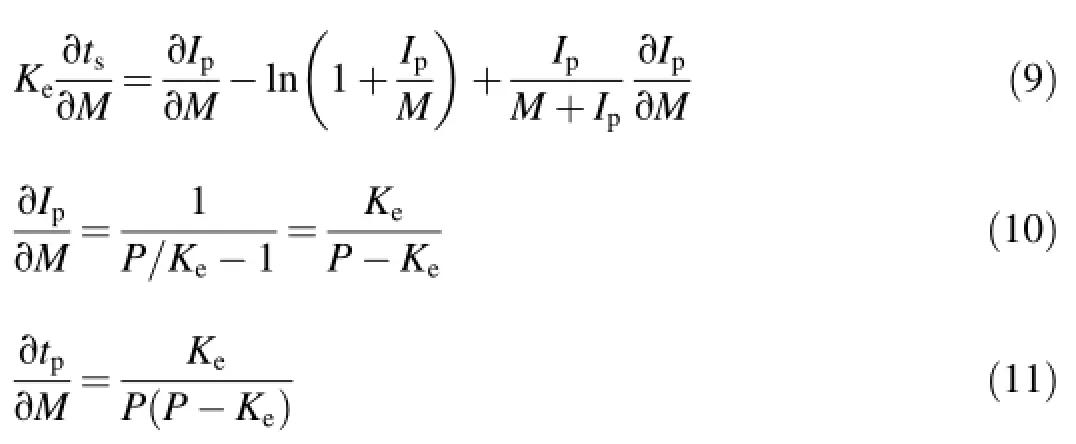
Using Eqs.(9)through(11),we obtain
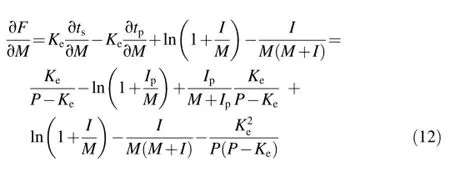
Thus,Eqs.(8)and(12)compose a Jacobian,which is used in the optimization computation through consideration of rainfall intensity and ponding time.The various steps can be calculated by Eq.(13)in each time interval:

where Xtis a group of parameters at time t,Xt+1is the parameter's value at the time following time t,J is the Jacobian matrix mentioned above,F(X)is the target optimized function,such as in Eq.(5),λ is a constant coeff i cient,and D is a constant number.When λ is very small,the optimized search step approaches that of the Newton method;when λ is large enough,the optimized search step is close to that of the gradient descent method.Using the input Jacobian for the objective function,the LM algorithm can search the optimum parameters.
2.2.Theoretical calibration of optimization method
The structure of the solution is the basis for searching optimization parameters.The existence of a unique global solution should be examined.Then,the impact factors(e.g.,recharge intensity,duration,and ponded conditions)should be validated theoretically for the solution scheme.Fig.1 shows a straightforward method(the approaching method)of calculating the minimumrootmeansquareerror(RMSE)betweenthesolutions of the G-A model and the Richards equation for all possible Keand M parameter combinations.Different recharge intensities and durations were tested for three types of theoretical soils (sandy,sandy clay loam,and clay loam),as shown in Figs.1(a through c).The RMSE,as the objective function,can well describe the structure of solution for the G-A model.Numerical analysis also shows that the optimized parameters are superior to the parameters extracted from theoretical and semitheoretical parameter estimation methods(e.g.,yield from Brooks and Corey(1966)or van Genuchten(1980)).
In this study,the general object of the LM algorithm was to minimize the residual sum of squares,which is similar to the value of the RMSE.The automatic search program was revised in our study.A problem in the LM algorithm is the result of non-unique or local solutions,which are derived from numerical errors or uncertainty of input data(More et al., 1980).In order to solve this problem,the MINPACK-1 package from the Argonne National Laboratory(More et al., 1980)can be used to extract the G-A parameters from the theoretical inf i ltration curves and numerical approximation curves in various soils by repeated iterations.All locally optimized solutions can be compared and a global optimum solution can be obtained by identifying the smallest value of the objective function.This approach can avoid random errors in calculations(Hristopulos,2015).For example,as shown in Fig.2,the initial value affects the f i nal optimum parameters due to uneven distribution of objective functions.However, multiple trials under the various initial conditions should generate a series of objective function values whose minimum error is the best location for solution.Thus,the modifiedmethod is capable of searching the parameters of the G-A model in complex inf i ltration processes.
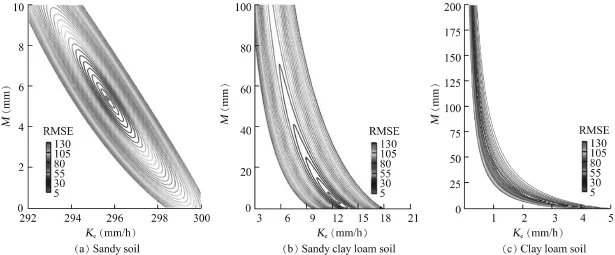
Fig.1.RMSE distributions in approaching method for selected soils.

Fig.2.Multiple trials for avoiding initial value problems.
2.3.Experimental framework
A series of rainfall simulation tests was conducted in each representative mapping unit in the Rainbow Wash and White Tank watersheds located in Arizona,in the United States.The rainfall simulator(RFS)was used in the tests(Bhardwaj and Singh,1992;Munn and Huntington,1976;Mutchler and Moldenhauer,1963).The cover area was 61× 61 cm2. Water drops were produced on the needles by providing a constant gravity head directly beneath the rainfall simulator. The recharge rates were designed for recording precipitation at 54 mm/h.In this condition,the experimental frame was close to an actual rainfall event.Unlike the traditional ponding inf i ltration experiment,most of the rainfall characteristics were retained in this study.For pedologic background, approximately 200 g of soil were collected from a depth ranging from 0 to 10 cm at each of the sampling locations within each mapping unit,and the soil particle size distributions and bulk densities were analyzed.Tested soils were classified by particle size distribution,as shown in Fig.3. Statistical data of the particle size distribution of soil in the experimental plots are shown in Table 1.
To obtain the accumulated water inf i ltration,we measured the water content in soil porous media beneath the RFS and the surface runoff at the down-sloping boundary.A probe with a length of 13 cm was installed at an angle of 30。with respect to the horizontal plane to measure the water content, which means that the effective depth for analysis was 6.5 cm. The collected data were recorded manually and continuously using a water content recorder(WCR)(model CS-616, Campbell Scientif i c Inc.(CSI)Logan,UT,U.S.A.).The accumulative inf i ltration curves were then obtained from these data.Only measurements taken in the first 10—30 min in each test were adopted in order to ensure that the wetting front did not occur below the probe.The measurements were based on the estimated wetting front position using the rainfall intensity and collected runoff volume.In the experiment,the time of runoff occurrence was recorded to optimize the ponding time.
Because soil structure strongly inf l uences inf i ltration and runoff characteristics,a semi-quantitative estimation of the soil structure was conducted.Although the soil structure was diff i cult to quantify,its inf l uences could be examined in order to explain unexpected measured results in rainfall simulator tests.Three parallel experiments were conducted for each plot unit.
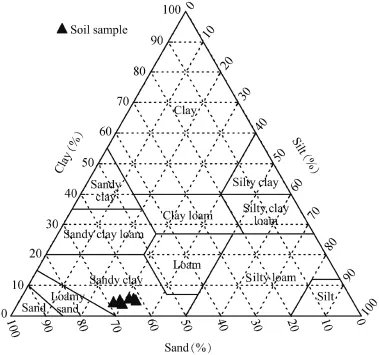
Fig.3.Soil catalog by particle size distribution for test plots'soils.

Table 1Statistic analysis of soil's PSD(particle size distribution)at each plot.
3.Results and discussion
3.1.Evaluation of inf i ltration curves
The observed and f i tting inf i ltration curves for each plot, representing three stochastic locations at each experimental plot,are labeled A,B,and C,in order to avoid uncertainty (Fig.4).For most experimental cases,the inf i ltration curves were drawn by continuous data from the WCR sensor in field experiments.However,some plot tests(e.g.,Q2A and Q0A, et al.)were recorded manually because there were coarse rocks on the plots'surfaces.The sensor could not identify soil layers or heterogeneous surface flows,so the monitoring data interrupted the homogenous hypothesis in the G-A model.In these cases,the accumulated inf i ltrations were calculated indirectly by subtracting observed runoff from rainfall at specif i c times.All measured and optimized predicted inf i ltration curves using the LM algorithm are shown in Fig.4.In most cases,the inf i ltration depths obtained from the WCR sensor ref l ect the same time series behaviors predicted by the G-A model.For these cases,the optimized accumulated infi ltrations agree with the observed ones.However,for some tests,the measured curves,which exhibit a distinctly nontheoretical S shape(e.g.,Q1A,Q2C,and Q3C in Fig.4),are different from the theoretical accumulated inf i ltration curves predicted by the G-A model.These non-theoretical cases were observed on older soils.Here,the inf i ltration rate was not a monotonically decreasing function,which existed for a theoretical uniform soil.Although the experiments were conducted in the same mapping unit,the inf i ltration processes were different.
In these cases,the inf i ltration rates were low in the early period,then increased rapidly toward the middle period of the test,and f i nally decreased to lower and relatively stable values. In the field,the causes leading to S-shaped inf i ltration curves can be complex.Layered soil(Ma et al.,2010),the surface seal(Damodhara et al.,2006),preferential flow paths(Lepore et al.,2009),and the surface microtopography(Vˊazquez et al., 2005)affect the results.In experiments,heterogeneous soils in test plots and soil structures are major factors.Initially,the upper layer and microtopography decide the recharge rates.If the conditions of the upper layer and microtopography are the same,the curves are close to theoretical ones.When the heterogeneous layers appear,the accumulative curves change at the wetting front between the soil layer interfaces.The abrupt changes of recorded curves shown in Fig.4 depend on the difference between the soil layers.A stable inf i ltration rate is decided by the minimum permeation of the soil layers at specified plots.
Using a standard G-A model,these non-theoretical inf i ltration curves cannot be matched.For these non-theoretical cases,the accumulated inf i ltration is overestimated by the G-A model before the measured inf i ltration rates increase signif i cantly.The reasons for the phenomena are not known entirely.However,we have found that the layering,presence of a surface crust,and microtopography can inf l uence the initial inf i ltration rates and preferential flow,causing the wetting front to penetrate the designed depth(6.5 cm)ahead of the expected time.The records show that a portion of the initial precipitation will puddle and prevent all water from inf i ltrating when clay particles exist.Most non-theoretical cases occurred on soils with the presence of silt(Q1 and Q2).This silt layer,with the higher water holding capacity and lower Ks(saturated conductivity),could have prevented water from moving deeper into the soil,within the range of inf l uence ofthe sensor.The non-theoreticalcasesappearmore frequently in the same plots(Q1 and Q2),implying that soil structure may contribute to the formation of non-theoretical curves.The proposed model cannot handle such complex curves,due to the hypotheses of the G-A model(such as a constant inf i ltration rate and uniform soil).
3.2.Optimized f i tting parameters
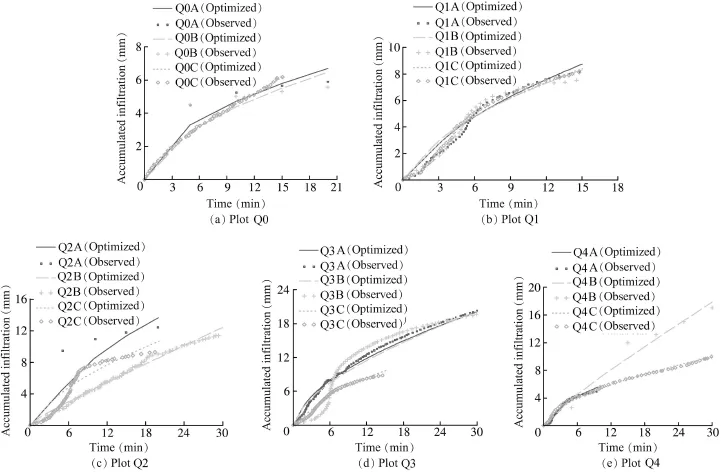
Fig.4.Extraction of optimized G-A parameters by LM algorithm from RFS experiments.

Table 2Optimized G-A parameters for field RFS experiments and Saxton and Rawls's PTF(2006).
The automatic search results from the method mentioned above are shown in Table 2 and the predicted data are plotted in Fig.4.For most of the cases,the measured inf i ltration curvehas an overall shape similar to the theoretical curve.For example, before ponding,the gradient of the curve(e.g.,an inf i ltration rate approximately equal torainfallintensity)remainsconstant; after ponding,the inf i ltration rate gradually decreases until it approaches a constant value for the remaining time.In these conditions,the results obtained from our proposed search approach agree with the observed series.In other cases,the measured curve has a different shape(e.g.,some measured curves in this study were S-shaped),and the proposed approach willnotbefullysatisfactory;fewerobservedpointsleadtomore fi ttingerrorsinQ2Aaswell.However,theoptimizedresultscan still describe the complex soil structure and other factors.For sandy soil cases(Q4A and Q2C),the in fi ltration curves were short and there were few sampling points due to the heterogeneous surface and a high in fi ltration rate,indicating that the sampling points cannot represent the experimental hypothesis. Thus,these cases were disregarded during parameter optimization.From the Nash-Sutcliffe test in Table 2,we note that the proposed approach could take into account all uncertainties and provide a series of representative parameters from the experimental data set.
3.3.Analysis and comparison with previous PTF methods
Modeling soil hydrologic processes for different landscape elements is important for many studies on land-use planning problems.The PTF has been developed as a simplified method of assessing soil hydraulic parameters obtained from soil physical properties,and it is much less laborious and less expensive.In model application,PTF can more routinely measurethesoilhydraulicpropertiesinungaugedbasins.Asfor the PTF in the G-A model,a commonly used one is Saxton and Rawls's PTF.According to Rawls et al.(1983),the KevaluerelatedtothisPTFishalfofKs.BasedonBrakensiek(1977)and Rawls et al.(1983),the soil capillary drive S from Saxton and Rawls's PTF is calculated by the following equations:

where γ is the Brooks-Corey pore size distribution parameter,and ψbis the bubbling pressure(mm),assumed to be one half of the air entry value(Bouwer,1966;Brakensiek, 1977).In their studies,however,Saxton and Rawls(2006) considered the bubbling pressure to be equal to the air entry value.The calculated parameters are listed in Table 2. Fig.5 shows the comparison of the optimized parameter results and the estimated parameters by Saxton and Rawls's PTF(Saxton and Rawls,2006).Saxton and Rawls's PTF predicts higher Kevalues,but for most of the cases these values are ranked in the same order of magnitude as the optimized results.The S values predicted by the PTF generally range from 200 to 450 mm,whereas the optimized S values have a much larger range.For most cases,the PTF predicted values are higher than the optimized S values. Considering both Keand S effects,the parameters predicted by Saxton and Rawls's PTF tend to overestimate inf i ltration, and thus underestimate runoff when applied to hydrologic modeling.Nevertheless,the rainfall simulator tests were the closest to natural conditions,and the parameters derived from them represented the hydrologic units better than PTF-generated parameters.

Fig.5.G-A parameters from RFS test and Saxton and Rawls's PTF in various plots.
3.4.G-A parameters derived from rainfall-inf i ltration measurement
When the set of PTF input parameters is def i ned,the PTF output can be obtained.In this study,multiple regression analysis was conducted to build the relationships between input and output parameters.An advantage of regression techniques is that most essential input parameters can be found automatically using stepwise regression.Multiple linear regressions is a parametric test,in which,for a given set of independent variables,the possible values for a dependent variable are assumed to be normally distributed and have a constant variance.Typically,the probability of Kein soils is logarithmically distributed,which requires log-transformed values of Keor lg Keto be the dependent variable in PTF. Correlations between the G-A parameters(Table 2)and soil texture are obtained from the optimization results of the RFS tests where soil information are also available,especially including the percentages of gravel,sand,silt,and clay,as well as bulk density(Brakensiek,1977;Brakensiek and Onstad, 1977).Effective hydraulic conductivity and soil capillary drive prediction using RFS tests are:

where Gr,Sa,and Clare the percentages of gravel,sand,and clay,respectively,and Bdis the bulk density(g/cm3).Correlation coeff i cients for Keand S are 0.69 and 0.74,respectively. The relatively low values of the correlation coeff i cients in these regression equations ref l ect the inherent heterogeneity and uncertainty of natural soils.In addition,the limited number of successful experiments reduces the applicability of these equations.Although the specif i c form of these equations should be verified with a larger number of additional tests due to the limited RFS experiments,that form can ref l ect the integrated information for the specif i c locations.
4.Conclusions
The RFS test has the advantage of simulating the natural impact of rainfall and consequently eliminates the disadvantage associated with the traditional methods of obtaining hydrologic parameters in ungauged areas.It offers most of the integrated information for the inf i ltration process in specif i cexperimental locations.In this study,an optimized method of estimating the G-A parameters has been developed based on the RFS test.Unlike previous PTF methods,this method directly estimates the G-A parameters from in fi ltration curves. Through a parameter optimization procedure,the proposed method provides optimized results as to the effective hydraulic conductivity and the soil capillary drive.Further analyses show that the optimized parameters reproduce the measured in fi ltration curves.Field-observed non-theoretical in fi ltration curves(e.g.,S-shaped in fi ltration curves),usually due to complex soil structure or microtopography,are not adequately fi tted by the optimized parameters found by this method. However,the optimized results can provide the best approximation.Compared with the theoretical PTF approach,the optimized method for the G-A model is proper for estimating the soil hydraulic parameters for a speci fi c site.This study shows that the optimization approach with the RFS test can rapidly address potential error related to complex plot surface and soil structure,and,combined with the RFS test,it contributes to hydrologic modeling studies with improved parameters in ungauged watersheds.
Angermann,T.,Wallender,W.W.,Wilson,B.W.,Werner,I.,Hinton,D.E., Oliver,M.N.,Zalom,F.G.,Henderson,J.D.,Oliveira,G.H.,Deanovic,L.A., et al.,2002.Runoff from orchard f l oors:Micro-plot field experiments and modeling.J.Hydrol.265(1—4),178—194.http://dx.doi.org/10.1016/S0022-1694(02)00109-9.
Athira,P.,Sudheer,K.P.,2015.A method to reduce the computational requirement while assessing uncertainty of complex hydrological models. Stoch.Environ.Res.Risk Assess.29(3),847—859.http://dx.doi.org/ 10.1007/s00477-014-0958-4.
Bhardwaj,A.,Singh,R.,1992.Development of a portable rainfall simulator inf i ltrometerforinf i ltration,runoffanderosionstudies.Agric.WaterManag. 22(3),235—248.http://dx.doi.org/10.1016/0378-3774(92)90028-U.
Bouwer,H.,1966.Rapid field measurement of air entry value and hydraulic conductivity of soil as signif i cant parameters in flow system analysis.Water Resour.Res.2(4),729—738.http://dx.doi.org/10.1029/WR002i004p00729.
Brakensiek,D.L.,1977.Estimating the effective capillary pressure in the Green and Ampt inf i ltration equation.Water Resour.Res.13(3),680—682. http://dx.doi.org/10.1029/WR013i003p00680.
Brakensiek,D.L.,Onstad,C.A.,1977.Parameter estimation of the Green and Ampt inf i ltration equation.Water Resour.Res.13(6),1009—1977.http:// dx.doi.org/10.1029/WR013i006p01009.
Brooks,R.H.,Corey,A.T.,1966.Properties of porous media affecting fl uid flow.J.Irrig.Drain.Div.72(IR2),61—88.
Chu,S.T.,1978.In fi ltration during unsteady rain.Water Resour.Res.14(3), 461—466.http://dx.doi.org/10.1029/WR014i003p00461.
Damodhara,R.M.,Raghuwanshi,N.S.,Singh,R.,2006.Development of a physically based 1D-in fi ltration model for irrigated soils.Agric.Water Manag.85(1—2),165—174.http://dx.doi.org/10.1016/j.agwat.2006.04.009.
Dun,S.,Wu,J.Q.,Elliot,W.J.,Robichaud,P.R.,Flanagan,D.C., Frankenberger,J.R.,Brown,R.E.,Xu,A.C.,2009.Adapting the water erosion prediction project(WEPP)model for forest applications.J.Hydrol. 366(1—4),46—54.http://dx.doi.org/10.1016/j.jhydrol.2008.12.019.
Esteves,M.,Faucher,X.,Galle,S.,Vauclin,M.,2000.Overland flow and in fi ltration modelling for small plots during unsteady rain:Numerical results versus observed values.J.Hydrol.228(3—4),265—282.http:// dx.doi.org/10.1016/S0022-1694(00)00155-4.
Galbiati,G.,Savi,F.,1995.Evaluation of the comparative in fl uence of soil hydraulic properties and roughness on overland flow at the local scale.J. Agric.Eng.Res.61(3),183—190.http://dx.doi.org/10.1006/jaer.1995.1045.
Govindaraju,R.S.,Kavvas,M.L.,Jones,S.E.,Rolston,D.E.,1996.Use of Green-Ampt model for analyzing one-dimensional convective transport in unsaturated soils.J.Hydrol.178(1—4),337—350.http://dx.doi.org/ 10.1016/0022-1694(95)02796-3.
Gowdish,L.,Munoz-Carpena,R.,2009.An improved Green-Ampt inf i ltration and redistribution method for uneven multistorm series.Vadose Zone J. 8(2),470—479.http://dx.doi.org/10.2136/vzj2008.0049.
Green,W.H.,Ampt,G.A.,1911.Studies on soil physics,part 1:The flow of air and water through soils.J.Agric.Sci.4(1),1—24.
Hristopulos,D.,2015.Covariance functions motivated by spatial random field models with local interactions.Stoch.Environ.Res.Risk Assess.29(3), 739—754.http://dx.doi.org/10.1007/s00477-014-0933-0.
Lee,T.,Shin,J.,Park,T.,Lee,D.,2015.Basin rotation method for analyzing the directional inf l uence of moving storms on basin response.Stoch.Environ.Res.Risk.Assess.29(1),251—263.http://dx.doi.org/10.1007/ s00477-014-0870-y.
Lepore,B.J.,Morgan,C.L.S.,Norman,J.M.,Molling,C.C.,2009.A mesopore and matrix inf i ltration model based on soil structure.Geoderma 152(3—4), 301—313.http://dx.doi.org/10.1016/j.geoderma.2009.06.016.
Ma,Y.,Feng,S.Y.,Su,D.Y.,Gao,G.Y.,Huo,Z.L.,2010.Modeling water inf i ltration in a large layered soil column with a modified Green-Ampt model and HYDRUS-1D.Comput.Electron.Agric.71(s1),S40—S47. http://dx.doi.org/10.1016/j.compag.2009.07.006.
Marquardt,D.W.,1963.An algorithm for least squares estimation of nonlinear parameters.J.Soc.Ind.Appl.Math.11(2),431—441.
Mein,R.G.,Larson,C.L.,1973.Modelinginf i ltrationduringasteadyrain.Water Resour.Res.9(2),384—394.http://dx.doi.org/10.1029/WR009i002p00384.
Mohamoud,Y.M.,1991.Evaluating the Green and Ampt inf i ltration parameter values for tilled and crusted soils.J.Hydrol.123(1—2),25—38.http:// dx.doi.org/10.1016/0022-1694(91)90066-Q.
More,J.J.,Garbow,B.S.,Hillstrom,K.E.,1980.User Guide for Minpack-1. Argonne National Laboratory,Argonne.
Munn,J.R.,Huntington,G.L.,1976.Aportablerainfallsimulatorforerodibility and inf i ltration measurements in rugged terrain.Soil Sci.Soc.Am.J.60, 622—624.http://dx.doi.org/10.2136/sssaj1976.03615995004000040046x.
Mutchler,C.K.,Moldenhauer,W.C.,1963.Applicator for laboratory rainfall simulator.Trans.Am.Soc.Agric.Eng.6,220—222.http://dx.doi.org/ 10.13031/2013.40871.
O'Brien,J.S.,Jorgensen,G.R.,Garcia,R.,2009.FLO-2D Software Version 2009.FLO-2D Software,Inc,Nutrioso,AZ.
Prevedello,C.L.,Loyola,J.M.T.,Reichardt,K.,Nielsen,D.R.,2009.New analytic solution related to the Richards,Philip,and Green-Ampt equations for inf i ltration.Vadose Zone J.8(1),127—135.http://dx.doi.org/10.2136/ vzj2008.0091.
Rawls,W.J.,Brakensiek,D.L.,Miller,N.,1983.Green-Ampt inf i ltration parameters from soils data.J.Hydraul.Eng.109(1),62—69.http://dx.doi.org/ 10.1061/(ASCE)0733-9429(1983)109:1(62).
Rawls,W.J.,Ahuja,L.R.,Brakensiek,D.L.,1992.Estimating soil hydraulic properties from soils data.In:Proceedings of the International Workshop on Indirect Methods for Estimating Hydraulic Properties of Unsaturated Soils.University of California,Riverside,pp.329—340.
Regalado,C.M.,Ritter,A.,Alvarez-Benedi,J.,Munoz-Carpena,R.,2005. Simplified method to estimate the Green-Ampt wetting front suction and soil sorptivity with the Philip-Dunne falling-head permeameter.Vadose Zone J.4(2),291—299.
Reynolds,W.D.,2010.Measuring soil hydraulic properties using a cased borehole permeameter:Steady flow analyses.Vadose Zone J.9(3), 637—652.http://dx.doi.org/10.2136/vzj2009.0136.
Risse,L.M.,Nearing,M.A.,Zhang,X.C.,1995.Variability in Green-Ampt effective hydraulic conductivity under fallow conditions.J.Hydrol. 169(1—4),1—24.http://dx.doi.org/10.1016/0022-1694(94)02676-3.
Saxton,K.E.,Rawls,W.J.,2006.Soil water characteristic estimates by texture and organic matter for hydrologic solutions.Soil Sci.Soc.Am.J.70(5), 1569—1578.http://dx.doi.org/10.2136/sssaj2005.0117.
Silburn,D.M.,Connolly,R.D.,1995.Distributed parameter hydrology model (ANSWERS)applied to a range of catchment scales using rainfall simulator data I:inf i ltration modelling and parameter measurement.J.Hydrol. 172(1—4),87—104.http://dx.doi.org/10.1016/0022-1694(95)02740-G.
Sivakumar,B.,2015.Networks:A generic theory for hydrology?Stoch.Environ.Res.Risk Assess.29(3),761—771.http://dx.doi.org/10.1007/ s00477-014-0902-7.
Suleiman,K.A.,Swartzendruber,D.,2003.Measurement of sated hydraulic conductivity of surface soil in the field with a small-plot sprinkling inf i ltrometer.J.Hydrol.272(1—4),203—212.http://dx.doi.org/10.1016/S0022-1694(02)00265-2.
Taskinen,A.,Sirvi¨o,H.,Bruen,M.,2008.Modelling effects of spatial variability of saturated hydraulic conductivity on autocorrelated overland flow data:Linear mixed model approach.Stoch.Environ.Res.Risk Assess. 22(1),67—82.http://dx.doi.org/10.1007/s00477-006-0099-5.
Valiantzas,J.D.,2010.New linearized two-parameter inf i ltration equation for direct determination of conductivity and sorptivity.J.Hydrol.384(1—2), 1—13.http://dx.doi.org/10.1016/j.jhydrol.2009.12.049.
van den Putte,A.,Govers,G.,Leys,A.,Langhans,C.,Clymans,W.,Diels,J., 2013.Estimating the parameters of the Green-Ampt inf i ltration equation from rainfall simulation data:Why simpler is better.J.Hydrol.476, 332—344.http://dx.doi.org/10.1016/j.jhydrol.2012.10.051.
vanGenuchten,M.T.,1980.Aclosed-formequationforpredictingthehydraulic conductivity of unsaturated soils.Soil Sci.Soc.Am.J.44(5),892—898.
Vˊazquez,E.V.,Miranda,J.G.V.,Gonzˊalez,A.P.,2005.Characterizing anisotropy and heterogeneity of soil surface microtopography using fractal models.Ecol.Model.182(3—4),337—353.http://dx.doi.org/10.1016/ j.ecolmodel.2004.04.012.
Verbist,K.,Torfs,S.,Cornelis,W.M.,Oyarzun,R.,Soto,G.,Gabriels,D., 2010.Comparison of single-and double-ring inf i ltrometer methods on stony soils.Vadose Zone J.9(2),462—475.http://dx.doi.org/10.2136/ vzj2009.0058.
Wang,L.L.,Li,Z.J.,Bao,H.J.,2010.Development and comparison of Gridbased distributed hydrological models for excess-inf i ltration runoffs.J. HohaiUniv.Nat.Sci.38(2),123—128.http://dx.doi.org/10.3876/ j.issn.1000—1980.2010.02.001(in Chinese).
Received 12 October 2015;accepted 9 May 2016
This work was supported by the National Natural Science Foundation of China(Grants No.51309078 and 51349015),the National Technology Support Program in the 12th Five-Year Plan of China(Grant No.2012BAK10B04),the Fundamental Research Funds for the Central Universities,the Program of Dual Innovative Talents Plan and Innovative Research Team in Jiangsu Province, and the Research on Spatio-Temporal Variable Source Runoff Model Based on Geomorphic Hydrological Response Units and Demonstration Application (Grant No.SHZH-IWHR-73).
*Corresponding author.
E-mail address:xianglonghhu@gmail.com(Long Xiang).
Peer review under responsibility of Hohai University.
http://dx.doi.org/10.1016/j.wse.2016.05.001
1674-2370/©2016 Hohai University.Production and hosting by Elsevier B.V.This is an open access article under the CC BY-NC-ND license(http:// creativecommons.org/licenses/by-nc-nd/4.0/).
©2016 Hohai University.Production and hosting by Elsevier B.V.This is an open access article under the CC BY-NC-ND license(http:// creativecommons.org/licenses/by-nc-nd/4.0/).
杂志排行
Water Science and Engineering的其它文章
- Numerical analysis of rapid drawdown:Applications in real cases
- Stability analysis of unsaturated soil slope during rainfall inf i ltration using coupled liquid-gas-solid three-phase model
- Seismic responses of high concrete face rockfill dams:A case study
- Numerical simulation of seismic damage and cracking of concrete slabs of high concrete face rockfill dams
- Design considerations and behavior of reinforced concrete core dams during construction and impounding
- Numerical stress-deformation analysis of cut-off wall in clay-core rockfill dam on thick overburden
