A community-based controlled trial of a comprehensive psychological intervenon for community residents with diabetes or hypertension
2016-03-30QingzhiZENGYanlingHEZhenyuSHIWeiqingLIUHuaTAOShimingBUDongleiMIAOPingLIUXuanzhaoZHANGXiaopingLIXuejunQI0QinZHOU
Qingzhi ZENG, Yanling HE,*, Zhenyu SHI, Weiqing LIU, Hua TAO, Shiming BU, Donglei MIAO,Ping LIU, Xuanzhao ZHANG, Xiaoping LI, Xuejun QI0, Qin ZHOU
A community-based controlled trial of a comprehensive psychological intervenon for community residents with diabetes or hypertension
Qingzhi ZENG1, Yanling HE1,*, Zhenyu SHI2, Weiqing LIU3, Hua TAO4, Shiming BU5, Donglei MIAO6,Ping LIU7, Xuanzhao ZHANG8, Xiaoping LI9, Xuejun QI10, Qin ZHOU11
Background:Depression and anxiety often occur in persons with chronic physical illnesses and typically magnify the impairment caused by these physical condions, but lile aenon has been paid to this issue in low- and middle-income countries.
Aim: Evaluate the effectiveness of a community-based psychological intervention administered by nonspecialized clinicians and volunteers for alleviating depressive and anxiety symptoms in individuals with chronic physical illnesses.
Methods: A total of 10,164 community residents receiving treatment for diabetes or hypertension in Shanghai were arbitrarily assigned to a treatment-as-usual condion (n=2042) or an intervenon condion(n=8122) that included community-wide psychological health promoon, peer support groups, and individual counseling sessions. The self-report Patient Health Questionnaire (PHQ-9), Generalized Anxiety Disorder scale (GAD-7), and 12-item Short-Form Health Survey (SF-12) assessed depressive symptoms, anxiety symptoms, and quality of life at baseline and aer the 6-month intervenon.
Results:Among the 8813 individuals who completed the baseline assessment, 16% had mild or more severe depressive or anxiety symptoms (PHQ-9 or GAD-75) and 4% had moderate or severe depressive or anxiety symptoms (PHQ-9 or GAD-710). The educaon component of the intervenon was e ff ecvely implemented, but only 31% of those eligible for peer-support groups and only 9% of those eligible for individual counseling accepted these interventions. The dropout rate was high (51%), and there were significant differences between those who did and did not complete the follow-up assessment. After adjusng for these confounding factors, the results in individuals who completed both assessments indicated that the intervention was associated with significant improvements in depressive symptoms (F=9.98,p<0.001), anxiety symptoms (F=12.85,p<0.001), and in the Mental Component Summary score of the SF-12(F=16.13,p<0.001). There was, however, no significant change in the self-reported rates of uncontrolled diabetes or hypertension.
Conclusions:These results support the feasibility of implementing community-based interventions to reduce the severity of depressive and anxiety symptoms in persons with chronic medical condions in lowand middle-income countries where psychiatric manpower is very limited. However, there are substanal methodological challenges to mounng such intervenons that need to be resolved in future studies before the widespread up-scaling of this approach will be jusfi ed.
depression; anxiety; community intervention; diabetes; hypertension; community medical service; China
1. Introducon
Diabetes and hypertension are two common chronic illnesses that are quite prevalent in China: 26.7% of the adult population (265 million individuals) has primary hypertension[1]and 11.6% (110 million individuals) has adult-onset diabetes.[2]Studies in other countries report that individuals with diabetes and hypertension are more likely to have depressive disorders and anxiety disorders than individuals without these physical illnesses.[3,4]Moreover, compared to persons with hypertension or diabetes who do not have comorbid depression or anxiety, those with comorbid depression or anxiety are less likely to adhere to medication regimens, have a lower quality of life, experience an earlier onset of complicaons, and have higher mortality rates and higher medical costs.[5,6]
Several studies report the effectiveness of psychological interventions for depression and anxiety in individuals with diabetes or hypertension.[7,8]However, most of these studies suffer from significant limitaons: they (a) are targeted to the relavely small number of individuals who meet diagnostic criteria of major depressive disorder or anxiety disorder, excluding the much larger number of individuals with mild to moderate depressive and anxiety symptoms; (b) involve a single type of individual-based treatment (medicaon,cognitive behavioral therapy, etc.) that requires a high level of expertise to administer; (c) focus on the reducon of depressive or anxiety symptoms with lile consideration of other important outcomes such as quality of life, changes in the severity of the physical disorder, overall treatment costs, and family burden;and (d) have sample sizes that are too small and too unrepresentave to assess the e ff ect of the intervenon on all community members with hypertension or diabetes.
2. Methods
Community health services in Shanghai are provided by community health centers (CHCs) distributed throughout the municipality’s 16 districts. Each community health center has a number of ‘community health service teams’ responsible for monitoring chronic illnesses among residents of several neighborhoods within the service area covered by the community health center. Each service team typically includes a general doctor, a nurse, and a public health clinician;among other responsibilities, they are expected to establish and maintain a registry of all residents with hypertension or diabetes in the neighborhoods; assess their blood pressure, blood sugar, and medication adherence at least four times a year; provide a full medical exam annually; refer those who need more advanced treatment; and provide related health educaon.
2.1 Sample
We estimated the sample size based on the prevalence of clinically significant depressive and anxiety symptoms. Assuming a relatively conservative mean baseline prevalence of 15%, in order to observe a 20% improvement (mean prevalence drop to 12%), a 3:1 rao of intervenon and control subjects, a type I error rate of 5% (i.e., α<0.05), a type II error rate of 80% (i.e.,β>0.80), and a 30% dropout rate over the 6 months of follow-up, there needed to be at least 4233 parcipants in the intervention group and 1409 participants in the control group.
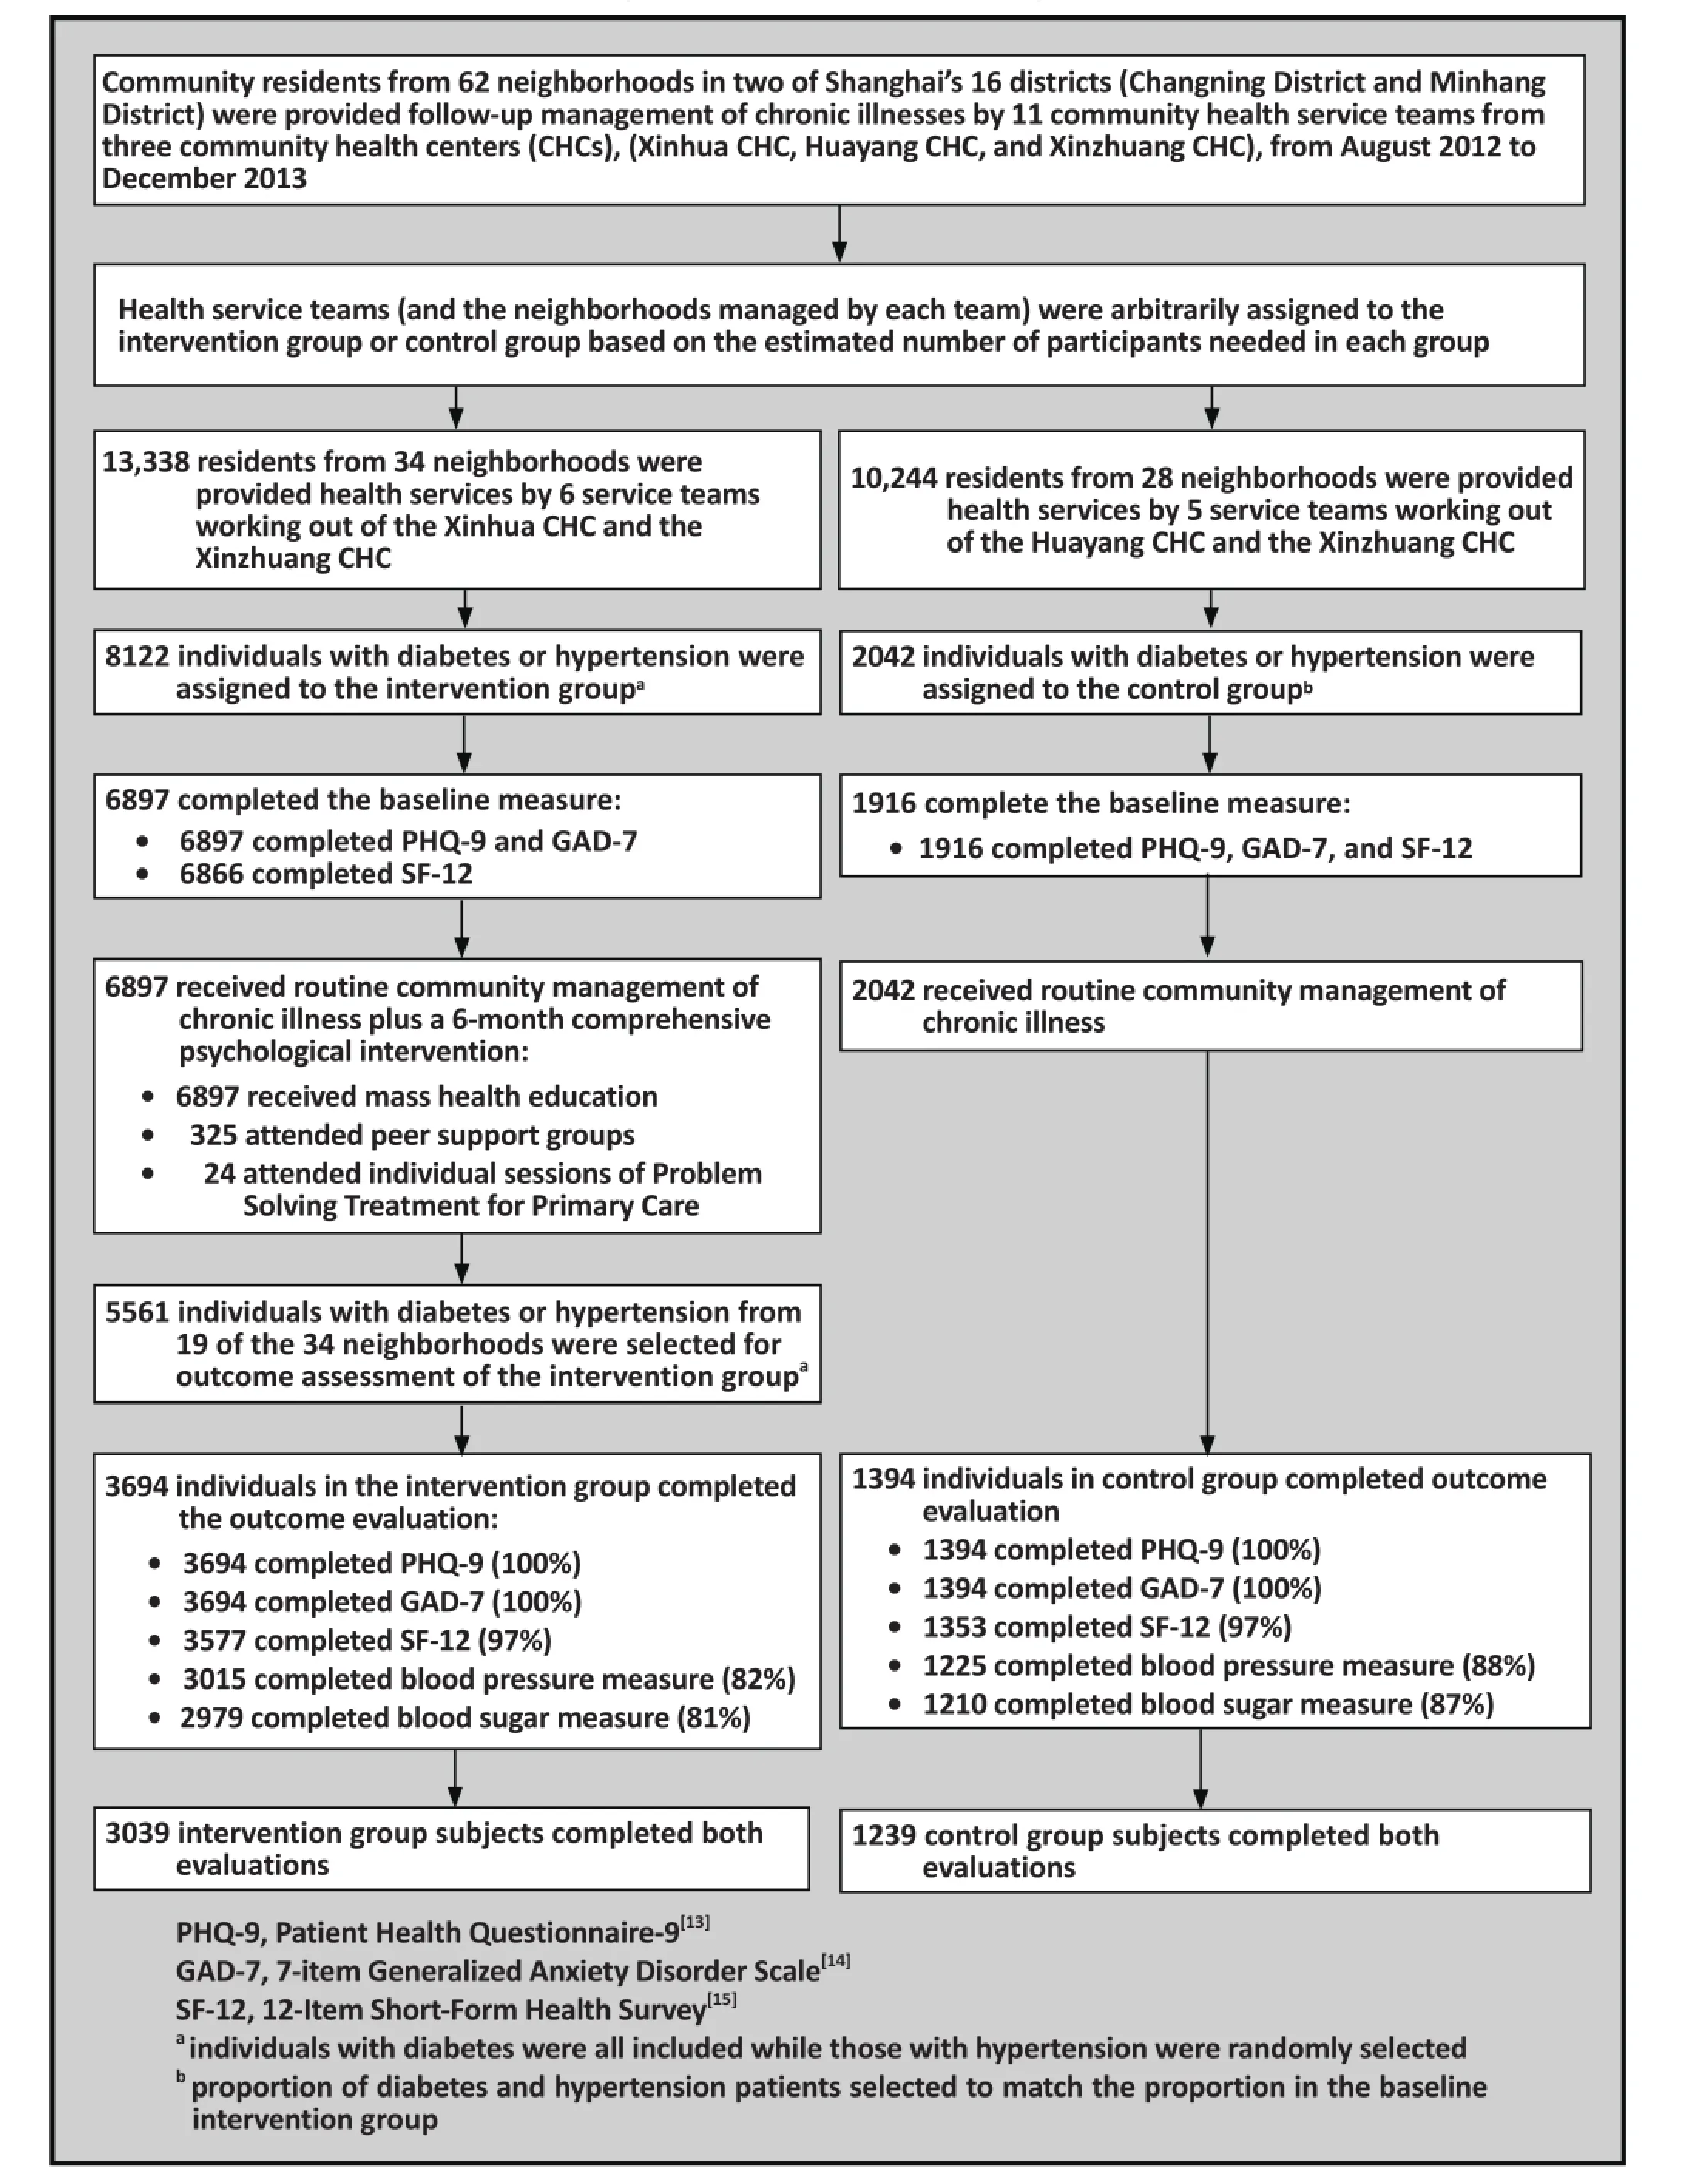
Figure 1. Flowchart of the study
Based on the number of registered individuals with diabetes and hypertension in the neighborhoods in the catchment areas of the three participating CHCs,we arbitrarily assigned the 11 community health service teams from the CHCs to the intervenon group or the control group such that the ratio of potential subjects in the intervention and control groups was approximately 3 to 1. As shown in Figure 1, the active psychological intervenon and standard follow-up care(the intervention group) were provided to residents of 34 neighborhoods (17 neighborhoods provided services by four service teams from Xinhua CHC and 17 neighborhoods provided services by two service teams from Xinzhuang CHC) and standard follow-up care alone (the control condion) was provided to residents of 28 neighborhoods (21 neighborhoods provided services by four service teams from Huayang CHC and 7 neighborhoods provided services by one service team from Xinzhuang CHC).
Research studies indicate that the relationship between diabetes and depressive or anxiety symptoms is stronger than that between hypertension and depressive or anxiety symptoms,[12]so we included all individuals with diabetes from the intervention communities and then increased the sample to the desired size by taking a simple random sample from the residents with hypertension. Based on the rao of diabetes and hypertension among individuals eligible for the intervention group, corresponding proportions of diabetes and hypertension patients were randomly selected from all diabetes and hypertension patients living in the control communities. After the 6-month intervention, limited resources and personnel made it impossible to redo the evaluaon of all intervenon group parcipants, so 19 of the 34 neighborhoods in the intervenon group were selected (those that were most acve in implemenng the psychological intervenon),and all persons registered with diabetes or hypertension from these neighborhoods were selected for follow-up evaluaon. In the control neighborhoods, all individuals assessed at baseline were selected for the 6-month follow-up evaluaon.
All participants received routine management of their chronic illness. As described above, in CHCs in Shanghai this is officially supposed to include registration, complete annual physical examinations,and quarterly follow-up of community residents with adult-onset diabetes and primary hypertension. The quarterly follow-up assessments include assessment of blood pressure and fasting blood glucose, identification of sequelae or comorbid health conditions, health education about lifestyle issues,medication management, and, if necessary, referral to hospital outpatient or inpatient services for more extensive evaluaon or treatment. The degree to which community residents with diabetes and hypertension parcipate in these CHC services varies considerably.
The community-based comprehensive psychological intervention used in this study was an adaptation of the IMPACT model developed in the United States for use in Shanghai.[10,11]In addition to the routine management of their diabetes and/or hypertension, all intervention group subjects also received communitybased education about psychological health. Some individuals in the intervention group also received additional psychological support: individual counseling was offered to individuals whose baseline scores on the Patient Health Questionnaire-9 (PHQ-9)[13](which evaluates depressive symptoms) or the Generalized Anxiety Disorder 7-item scale (GAD-7)[14]were >10; and small-group peer support was offered to individuals whose total score on either scale was >5.
The community-based mental health education component involved distributing brochures,broadcasting educational videos, and hosting lectures about psychosomac health for individuals with chronic illnesses. The content focused on the identification and management of the symptoms of depression and anxiety, the relationship between psychological health and somac health, and the relaonship between stress and depression or anxiety.
The peer support group intervention targeted paents with diabetes or hypertension who had PHQ-9 or GAD-7 scores > 5 but also welcomed the parcipaon of other community members who expressed interest in the groups. This intervention involved monthly 60-90 minute meengs led by community volunteers who had received guidance from counselors. The group meetings, which typically included 9-18 individuals,focused on (a) the management of chronic diseases,(b) healthy lifestyles, (c) psychological coping skills for dealing with diabetes and hypertension, (d) knowledge about depression and anxiety, and (e) self-awareness of negative emotions. In addition to the transmission of crucial information, the meetings also provided emotional and social support to the participants,something that previous research has shown to reduce depressive symptoms and improve the control of diabetes and hypertension.[15]
The individual intervention targeted individuals whose PHQ-9 or GAD-7 score was >10. Counselors(individuals who had a nationally approved Level-2 counseling certificate) provided one 60-minute and six 30-minute sessions of Problem Solving Treatment for Primary Care (PST-PC)[16]to each individual. The counseling focused on alleviating symptoms of depression and anxiety by assisng these individuals to become more self-aware, to learn how to analyze and deal with their problems, to decrease their feelings of frustraon, and to increase their feelings of control over their lives. PST has been found to be effective in the management of emotional problems among patients treated at community health centers.[16]
The three components of this communitybased intervention in the 34 neighborhoods was collaboratively coordinated and provided by 391 individuals, including local administrators, community clinicians, community public health workers, counselors,and volunteers. All individuals who provided each of the three components of the intervention receivedappropriate training before implementing the intervention. We ensured that the group leaders and counselors grasped related skills through the introduction of learning theories, the illustration of examples, discussion, and role-play exercises. During the intervention process, peer support leaders and the counselors also routinely received professional supervision in order to identify and address any problems in amely manner.
2.3 Measures
At baseline all participants completed a detailed demographic and clinical status form, the PHQ-9[13]to assess the severity of depression, the GAD-7[14]to assess the severity of anxiety, and the 12-Item Short-Form Health Survey (SF-12)[17]to assess quality of life. Six months later the PHQ-9, GAD-7, and SF-12 were readministered, and participants were asked to classify the control of their diabetes and/or hypertension as‘very stable’, ‘stable’, or ‘unstable’.
Demographic and clinical variables considered included age, gender, marital status, level of educaon,employment status, age of onset of current illness,course of illness, presence of physical sequelae of diabetes of hypertension, and frequency of hospitalbased treatment (as outpaent or inpaent) in the prior 6 months.
The PHQ-9 and GAD-7 are widely used selfcompleon scales with good reliability and validity[18,19]which assess the frequency of specific depressive and anxiety symptoms over the prior two weeks. The items on both scales are rated on 4-point Likert scales (0=’never’ to 3=’almost every day’), so the total score for 9-item PHQ-9 ranges from 0 to 27 and that for 7-item GAD-7 ranges from 0 to 21, with higher scores representing more severe depressive or anxiety symptoms. The PHQ-9 total score is classified as follows:[18]0 to 4, ‘no depression’; 5 to 9, ‘mild depression’; 10 to 14, ‘moderate depression’; 15 to 19,‘moderate to severe depression’; 20 or above, ‘severe depression’. The GAD-7 total score is classified as follows:[19]0 to 4, ‘no anxiety’; 5 to 9, ‘mild anxiety’; 10 to 14, ‘moderate anxiety’; 15 or above, ‘severe anxiety’.
Research has shown that the SF-12[17]is a valid measure of quality of life in the general Chinese populaon.[20]We use two components from the scale in the current analysis: the Mental Component Summary(MCS) score and the Physical Component Summary (PCS)score. These scores are based on weighng responses to all 12 items, with higher scores indicang beer quality of life.
We used EpiData 3.1 (The EpiData Associaon, Odense,Denmark) to input and manage the data and used SPSS 17.0 (SPSS Inc., Chicago, IL, USA) to analyze the data. Categorical data were compared using Chi-square tests,connuous data were analyzed using parametric or nonparametric tests depending on whether or not the data was distributed normally.
The main analysis was based on the subset of participants who completed both the baseline and 6-month evaluations. Six subgroups of respondents were idenfi ed according to the baseline results on the PHQ-9 and GAD-7: (1) those with PHQ-9 >5; (2) those with GAD-7 >5; (3) those with PHQ-9 >10; (4) those with GAD-7 >10; (5) those with PHQ-9 or GAD-7 >5; and (6)those with PHQ-9 or GAD-7 >10.
3. Results
There were 10,164 individuals with diabetes or hypertension registered in the 62 participating communies and 8813 of them (86.7%) completed the baseline evaluaon; 6897 of the 8122 (84.9%) residents in the intervenon group neighborhoods with diabetes or hypertension completed the baseline assessment and 1916 of the 2042 (93.9%) residents in the control group neighborhoods with diabetes or hypertension completed the baseline assessment. The main reasons for failure to participate in the study were failure to meet the inclusion criteria, refusal to participate, and diffi culty of access to the CHC (some registered residents at the CHCs actually live elsewhere). Comparison of the 1351 who did not participate with the 8813 who did participate found no significant difference by gender(46.7% v. 45.2% male, respectively,X2=1.02,p=0.314)or in the mean (sd) age (70.0 [10.2] v. 69.6 [10.3] years,respecvely,t=1.14,p=0.253).
Only 19 of the 34 intervention communities participated in the 6-month outcome evaluation, but all 28 control communies parcipated in the 6-month follow-up evaluation. In total 7603 individuals were selected to participate in the outcome evaluation and 5088 of them (66.9%) completed the evaluaon; in the intervention group 3694 of the 5561 (66.4%) selected individuals completed the outcome assessment and in the control group 1394 of the 2042 (68.3%) selected individuals completed the outcome assessment.
As shown in Figure 1, 3039 participants in the intervention group and 1239 in the control group completed both the baseline and the outcome evaluaons.
3.2 Comparison of individuals who do and do not complete both evaluaons
Table 1 compares the demographic and clinical characteristics of individuals in the control group and the intervention group who only completed the baseline evaluation with the characteristics of individuals from the two groups who completed both the baseline and 6-month follow-up evaluations (and thus, were included in the outcome assessment for the intervention). In the control group, the mean(sd) age of the 1239 individuals who completed both evaluations was not significantly different from that of the 677 individuals who only completed the baseline assessment (70.4 [10.3] v. 69.6 [10.1] years,respectively,t=1.08,p=0.279), but individuals who
completed both assessments had a higher level of education and had made fewer hospital visits for treatment of their diabetes and/or hypertension in the prior 6 months than individuals who only completed the baseline assessment. In the intervention group,there was also no signi fi cant di ff erence in age between the 3039 individuals who completed both assessments compared to that of the 3858 individuals who only completed the baseline assessment (69.4 [10.3] v. 69.4[10.3] years, respecvely,t=0.11,p=0.916), but several other variables were signi fi cantly di ff erent between the two subgroups of individuals living in the intervention group neighborhoods: compared to individuals who only completed the baseline assessment, those who completed both assessments were more likely to be professionals or managers, had a higher level of educaon, were more likely to be divorced or widowed,were more likely to only have hypertension, were less likely to have complications (sequelae) of diabetes or hypertension, had a longer duraon of illness, and were more likely to have made mulple hospital visits for the management of their illness over the prior 6 months.
Table 1. Comparison of demographic characteriscs and illness characteriscs in the intervenon group and the control group between respondents who only completed the baseline assessment and those who completed both the baseline and the 6-month outcome assessmenta

Table 1. Comparison of demographic characteriscs and illness characteriscs in the intervenon group and the control group between respondents who only completed the baseline assessment and those who completed both the baseline and the 6-month outcome assessmenta
aMISSING DATA FOR RESPONDENTS IN THE CONTROL GROUP: for those who only completed the baseline assessment, there were 1 missing data in employment status, 1 in occupaon, 1 in educaonal level, 2 in marital status, 1 in years duraon of illness, and 4 in hospital-based treatments in the last 6 months; for those who completed both assessments, there were 1 missing data in employment status, 1 in educaonal level, 1 in marital status, 1 in sequelae of diabetes or hypertension, 1 in years duraon of illness, and 3 in hospital-based treatments in the last 6 months;MISSING DATA FOR RESPONDENTS IN THE INTERVENTION GROUP: for those who only completed the baseline assessment, there were 1 missing data in employment status, 5 in occupaon, 2 in educaon level, 2 in marital status, 4 insequelae of diabetes or hypertension,189 in years duraon of illness, and 18 in hospital-based treatments in the last 6 months; for those who completed both assessments,there were 1 missing data in employment status, 1 in occupaon, 2 in educaon level, 1 in sequelae of diabetes or hypertension, 94 in years duraon of illness, and 20 in hospital-based treatments in the last 6 months
characterisc control group intervenon group only completed baseline assessment(n=677)n (%)completed both assessments(n=1239)n (%)X2X2(p-value)only completed baseline assessment(n=3858)n (%)completed both assessments(n=3039)n (%)(p-value)<65 years 215 (31.8) 374 (30.2) 1.25 1302 (33.7)1020 (33.6) 0.03 65- 80 343 (50.7) 623 (50.3) (0.535) 1851 (48.0)1464 (48.2) (0.985)>80 119 (17.6)242 (19.5) 705 (183.)555 (18.3)gender male 302 (44.6) 564 (45.5) 0.15 1770 (45.9)1351 (44.5) 1.39 female 375 (55.4) 675 (54.5) (0.701) 2088 (54.1)1688 (55.5) (0.238)age group employment status rered 611 (90.4) 1138 (91.9) 5.37 3488 (90.4)2748 (90.5) 0.002 working/studying 35 (5.2) 69 (5.6) (0.068) 249 (6.5) 196 (6.5) (0.999)other 30 (4.4) 31 (2.5) 120 (3.1) 94 (3.1)occupaon instuon manager 117 (17.3) 199 (16.1) 8.84 605 (15.7) 536 (17.6) 18.60 professional/technician 170 (25.1) 258 (20.8) (0.065) 951 (24.7) 824 (27.1) (0.001)general worker 105 (15.5) 223 (18.0) 757 (19.6) 502 (16.5)laborer 263 (38.9) 532 (42.9) 1415 (36.7)1093 (36.0)other 21 (3.1) 27 (2.2) 125 (3.2) 83 (2.7)illiterate 66 (9.8) 77 (6.2) 8.10 217 (5.6) 152 (5.0) 12.93 elementary school 111 (16.4) 213 (17.2) (0.044) 595 (15.4) 455 (15.0) (0.005)middle school 376 (55.6) 723 (58.4) 2292 (59.4)1732 (57.0)college degree 123 (18.2) 225 (18.2) 752 (19.5) 698 (23.0)marital status educaonal level never married 9 (1.3) 17 (1.4) 2.47 45 (1.2) 22 (0.7) 7.56 married 539 (79.9) 1023 (82.6) (0.291) 3280 (85.1)2544 (83.7) (0.023)divorced/widowed 127 (18.8) 198 (16.0) 531 (13.8) 473 (15.6)illness only hypertension 396 (58.5) 674 (54.4) 3.18 2341 (60.7)2122 (69.8) 69.56 only diabetes 100 (14.8) 192 (15.5) (0.203) 449 (11.6) 224 (7.4) (<0.001)hypertension + diabetes 181 (26.7) 373 (30.1) 1068 (27.7) 693 (22.8)0 no sequelae 419 (61.9) 783 (63.2) 1.19 2590 (67.2)2143 (70.5) 10.80 1 sequela 166 (24.5) 277 (22.4) (0.551) 771 (20.0) 573 (18.9) (0.005)2+ sequelae 92 (13.6) 178 (14.4) 493 (12.8) 322 (10.6)years duraon of illness sequelae of diabetes or hypertension<6 years 159 (23.5) 285 (23.0) 0.102 887 (24.2) 746 (25.3) 11.77 6-10 years 172 (25.4) 322 (26.0) (0.950) 1024 (27.9) 712 (24.2) (0.003)0 hospital visits 466 (69.2) 860 (69.6) 7.85 2940 (76.6)2322 (76.9) 6.82 1-2 hospital visits 49 (7.3) 131 (10.6) (0.020) 320 (8.3) 205 (6.8) (0.033)3+ hospital visits 158 (23.5) 245 (19.8) 580 (15.1) 492(16.3)>11 years 345 (51.0) 631 (51.0) 1758 (47.9)1487 (50.5)hospital-based treatments in the last 6 months
Comparison of the baseline results for the four primary outcome measures between those who only completed the baseline evaluation and those who completed both evaluations was as follows. In the control group the mean (sd) PHQ-9 for the 1239 individuals who completed both evaluaons and the 677 individuals who only completed the baseline evaluaon were 2.39 (3.42) and 2.26 (3.60), respecvely (t=-0.82,p=0.414); the corresponding results for the GAD-7 were 1.16 (2.36) and 1.12 (2.59) (t=-0.37,p=0.710);those for the PCS of the SF-12 were 45.0 (8.9) and 45.1(9.5), (t=0.30,p=0.765); and those for the MCS of the SF-12 were 54.4 (8.8) and 55.2 (9.1) (t=1.75,p=0.081). In the intervenon group the mean (sd) PHQ-9 for the 3039 individuals who completed both evaluations and the 3858 individuals who only completed the baseline evaluaon were 1.90 (3.17) and 2.18 (3.45), respecvely(t=3.46,p=0.001); the corresponding results for the GAD-7 were 0.88 (2.11) and 1.10 (2.54) (t=3.89,p<0.001); those for the PCS of the SF-12 were 46.2 (8.4)and 45.5 (9.0) (t=-3.52,p<0.001); and those for the MCS of the SF-12 were 55.5 (8.3) and 54.1 (8.4), respecvely(t=-7.02,p<0.001).
3.3 Comparison of characteriscs of the two groups at baseline and aer both assessments
Table 2 shows the comparison of the baseline demographic and clinical variables for individuals who completed the baseline evaluation in the intervention and control groups and for individuals who completed both the baseline and 6-month follow-up evaluaons in the two groups. At baseline, there were no significant di ff erences between the intervenon and control groups by gender, employment status, or duration of illness,but, given the very large sample, several relavely small di ff erences between the groups in other variables were statistically significant. For example, the mean (sd) age in the control group was 70.5 (10.2) years versus 69.7 (10.3) years in the intervention group; this minor difference in mean age of 0.8 years was statistically significant (t=9.18,p=0.002). As shown in the table,compared to control group participants, intervention group participants were also significantly less likely to be manual laborers (36.4% v. 41.5%), more likely to have a college educaon (21.0% v. 18.2%), more likely to be married (84.5% v. 81.7%), much more likely to only have hypertension (64.7% v. 55.8%), less likely to have one or more sequelae of diabetes or hypertension (31.3% v. 37.2%), and less likely to have made one or more hospital visits (as outpatient or inpatient) to manage their illness in the prior 6 months (23.3% v. 30.5%).
Most of the differences between the intervention and control groups seen at the baseline assessment persisted in the subgroup of individuals who completed both baseline and follow-up assessments. Compared to control group participants, intervention group parcipants were less likely to be manual laborers, more likely to have a college educaon, much more likely to only have hypertension, less likely to have one or more sequelae of diabetes or hypertension, and less likely to have made one or more hospital visits to manage their illness in the prior 6 months. Intervention group parcipants who completed both evaluaons were also younger than control group parcipants who completed both evaluations (69.4 [10.2] v. 70.4 [10.3] years,respecvely,t=2.97,p=0.003).
3.4 Prevalence of depressive and anxiety symptoms at baseline
Combining the results of all 8813 community residents with hypertension or diabetes who completed the baseline assessment with PHQ-9 and the GAD-7 from both the intervention and control groups, the prevalence of the six categories of depressive and anxiety condions were as follows: 14.7% (1292/8813)had mild or more severe depressive symptoms(PHQ-9 >5); 7.0% (613/8813) had mild or more severe anxiety symptoms (GAD-7 >5); 16.0% (1409/8813) had mild or more severe depressive or anxiety symptoms(PHQ-9 or GAD-7 >5); 3.9% (344/8813) had moderate or severe depressive symptoms (PHQ-9 >10); 1.6%(140/8813) had moderate or severe anxiety symptoms(GAD-7 >10); and 4.2% (369/8813) had moderate or severe depressive or anxiety symptoms (PHQ-9 or GAD-7 >10).
The 8813 individuals who completed the baseline assessments included 5533 with primary hypertension only, 965 with adult-onset diabetes only, and 2315 with both hypertension and diabetes. The prevalence of mild or more severe depressive or anxiety symptoms (PHQ-9 or GAD-7 >5) in these three groups of respondents was 13.4%, 17.7%, and 21.3%, respectively (X2=78.11,df=2,p<0.001). The prevalence of moderate or severe depressive or anxiety symptoms (PHQ-9 or GAD-7 >10)in the three groups of respondents was 3.3%, 4.9%, and 6.0%, respecvely (X2=29.52, df=2,p<0.001).
Table 2. Comparison of demographic characteriscs and illness characteriscs between the intervenon group and the control group at baseline and among individuals who completed the baseline and the 6-month assessmentsa

Table 2. Comparison of demographic characteriscs and illness characteriscs between the intervenon group and the control group at baseline and among individuals who completed the baseline and the 6-month assessmentsa
aMISSING DATA FOR ALL RESPONDENTS WHO COMPLETED THE BASELINE ASSESSMENT; in the control group, there were 2 missing data in employment status, 1 in occupaon, 2 in educaonal level, 3 in marital status, 1 in sequelae of diabetes or hypertension, 2 in years duraon of illness, and 7 in hospital-based treatments in the last 6 months; and for those in the intervenon group there were 2 missing data in employment status, 6 in occupaon,4 in educaon level, 2 in marital status, 5 in sequelae of diabetes or hypertension, 283 in years duraon of illness, and 38 in hospital-based treatments in the last 6 monthsMISSING DATA FOR RESPONDENTS WHO COMPLETED BOTH ASSESSMENTS; in the control group, there were 1 missing data in employment status, 1 in educaonal level, 1 in marital status, 1 insequelae of diabetes or hypertension, 1 in years duraon of illness, and 3 in hospital-based treatments in the last 6 months; and for those in the intervenon group there were 1 missing data in employment status, 1 in occupaon, 2 in educaon level, 1 in sequelae of diabetes or hypertension, 94 in years duraon of illness, and 20 in hospital-based treatments in the last 6 months
characterisc completed baseline assessment completed both assessments control group(n=1916)n (%)intervenon group(n=6897)n (%)X2X2(p-value)control group(n=1239)n (%)intervenon group(n=3039)n (%) (p-value)<65 years 589 (30.7)2322 (33.7) 5.86 374 (30.2)1020 (33.6) 4.65 65- 80 966 (50.4) 3315 (48.1) (0.053) 623 (50.3)1464 (48.2) (0.098)>80 361 (18.8)1260 (18.3) 242 (19.5)555 (18.3)gender male 866 (45.2)3121 (45.3) 0.002 564 (45.5)1351 (44.5) 0.40 female 1050 (54.8)3776 (54.7) (0.967) 675 (54.5)1688 (55.5) (0.525)age group employment status rered 1749 (91.4)6236 (90.4) 2.68 1138 (91.9)2748 (90.5) 2.35 working/studying 104 (5.4) 445 (6.5) (0.262) 69 (5.6) 196 (6.5) (0.309)other 61 (3.2) 214 (3.1) 31 (2.5) 94 (3.1)occupaon instuon manager 316 (16.5) 1141 (16.6) 19.87 199 (16.1) 536 (17.6) 28.48 professional/technician 428 (22.3) 1775 (25.8) (<0.001) 258 (20.8) 824 (27.1) (<0.001)general worker 328 (17.1) 1259 (18.3) 223 (18.0) 502 (16.5)laborer 795 (41.5)2508 (36.4) 532 (42.9)1093 (36.0)other 48 (2.5) 208 (3.0) 27 (2.2) 83 (2.7)educaonal level illiterate 143 (7.5) 369 (5.4) 20.53 77 (6.2) 152 (5.0) 14.91 elementary school 324 (16.9) 1050 (15.2) (<0.001) 213 (17.2) 455 (15.0) (0.002)middle school 1099 (57.4)4024 (58.4) 723 (58.4)1732 (57.0)college degree 348 (18.2)1450 (21.0) 225 (18.2) 698 (23.0)marital status never married 26 (1.4) 67 (1.0) 9.39 17 (1.4) 22 (0.7) 4.29 married 1562 (81.7)5824 (84.5) (0.009) 1023 (82.6)2544 (83.7) (0.117)divorced/widowed 325 (16.9) 1004 (14.5) 198 (16.0) 473 (15.6)Illness only hypertension 1070 (55.8)4463 (64.7) 66.45 674 (54.4)2122 (69.8) 110.64 only diabetes 292 (15.2) 673 (9.8) (<0.001) 192 (15.5) 224 (7.4) (<0.001)hypertension + diabetes 554 (28.9) 1761 (25.5) 373 (30.1) 693 (22.8)0 no sequelae 1,202 (62.8)4,733 (68.7) 23.79 783 (63.2)2143 (70.5) 23.04 1 sequela 443 (23.1)1,344 (19.5) (<0.001) 277 (22.4) 573 (18.9) (<0.001)2+ sequelae 270 (14.1) 815 (11.8) 178 (14.4) 322 (10.6)years duraon of illness sequelae of diabetes or hypertension<6 years 444 (23.2)1633 (24.7) 2.58 285 (23.0) 746 (25.3) 3.11 6-10 years 494 (25.8) 1736 (26.2) (0.275) 322 (26.0) 712 (24.2) (0.211)>11 years 976 (51.0)3245 (49.1) 631 (51.0)1487 (50.5)hospital-based treatments in the last 6 months 0 hospital visits 1326 (69.5)5262 (76.7) 42.99 860 (69.6)2322 (76.9) 28.71 1-2 hospital visits 180 (9.4) 525 (7.7) (<0.001) 131 (10.6) 205 (6.8) (<0.001)3+ hospital visits 403 (21.1) 1072 (15.6) 245 (19.8) 492(16.3)
3.5 Fidelity of the implementaon of the communitybased psychological intervenon
In the intervention group almost all individuals with diabetes or hypertension were exposed to the mass education effort. We delivered 20,000 brochures and 5,000 DVDs with psycho-educaonal content to homes in the intervention neighborhoods. Each DVD had two to eight lectures. The DVDs were also broadcast for a total of 514 days in community venues for a totalme of approximately 4000 hours.
A total of 325 individuals parcipated in the smallgroup peer support intervenon, that is, only 30.8% of the 1055 parcipants who were eligible (baseline PHQ-9 or GAD-7 score5) for this intervention. They were divided into 28 peer support groups that met a total of 575mes. The mean (sd) aendance by each of these parcipants was 17.3 (8.6)mes.
A total of 24 individuals received individualized sessions of PST, that is, only 8.9% of the 269 parcipants who were eligible (baseline PHQ-9 or GAD-7 score >10)for this intervention. In total, 83 individual counseling sessions were held; the mean (sd) frequency of counseling sessions for these individuals was 4.3 (2.4)mes.
The results of the intervention are shown in Tables 3 and 4. Table 3 compares the continuous outcome measures, that is, the total scores for the PHQ-9, GAD-7,and the Physical Component Summary (PCS) and Mental Component Summary (MCS) scores of the SF-12. In the control group, the self-reported level of depression and anxiety became more severe over the 6-month follow-up, the PCS score did not change significantly,and the MCS score got worse. Over the same period in the intervention group, the level of depression did not change signi fi cantly, the level of anxiety improved,the PCS score did not change signi fi cantly, and the MCS score improved signi fi cantly. At both baseline and at the 6-month follow-up assessment the intervention group had significantly less severe depression, less severe anxiety, and beer PCS and MCS scores than the control group. Aer adjusng for the baseline di ff erences of the measures and for the demographic variables that were significantly different between the groups at baseline,at the 6-month follow-up the intervention group still had signi fi cantly less severe depression, signi fi cantly less severe anxiety, and a significantly higher MCS scores than the control group.
Table 4 compares the dichotomous outcome measures between the groups. Among the 1239 individuals who completed both assessments in the control group and the 3039 individuals who completed both assessments in the intervention group, the classification of the subtypes of depressive and anxiety symptoms at baseline was as follows: (a) the prevalence of mild or more severe depressive symptoms(PHQ-9 >5) was 17.6% versus 12.5%, respectively;(b) the prevalence of moderate or severe depressive symptoms (PHQ-9 >10) was 4.6% versus 5.6%,respecvely; (c) the prevalence of mild or more severe anxiety symptoms (GAD-7 >5) was 8.1% versus 3.5%,respecvely; (d) the prevalence of moderate or severe anxiety symptoms (GAD-7 >10) was 1.4% versus 1.2%,respecvely; (e) the prevalence of mild or more severe depressive or anxiety symptoms (PHQ-9 or GAD-7 >5)was 19.0% versus 13.7%, respectively; and (f) the prevalence of moderate or severe depressive or anxiety symptoms (PHQ-9 or GAD-7 >10) was 4.8% versus 3.7%, respectively. At baseline the prevalence of mild(or more severe) depressive symptoms, mild anxiety symptoms, and mild depressive or anxiety symptoms was signi fi cantly greater in the control group than in the intervenon group.
Table 3. Comparison of mean (sd) results in the intervenon group subjects and control group subjects who completed both the baseline and the 6-month follow-up assessments

Table 3. Comparison of mean (sd) results in the intervenon group subjects and control group subjects who completed both the baseline and the 6-month follow-up assessments
PHQ-9, 9-item Paent Health Quesonnaire[13]GAD-7, 7-item General Anxiety Disorder scale[14]SF-12-PCS, Physical Component Summary score computed by weighng items of the 12-item Short Form Health Survey[15]SF-12-MCS, Mental Component Summary score computed by weighng items of the 12-item Short Form Health Survey[15]aF-test for analysis of covariance that controls for baseline value and for demographic variables that were di ff erent at baseline (i.e., occupaon,occurrence of sequelae, and hospital-based treatment in prior 6 months).
control group intervenon group comparison of control and intervenon groups scale at 6 months F-test (p)aPHQ-9 1239 2.39(3.42)n baseline at 6 months paired t-test (p) n baseline at 6 months paired t-test (p)at baseline t-test (p)at 6 months t-test (p)9.98(<0.001)GAD-7 1239 1.16(2.36)3.04(3.44) (<0.001)3039 1.90 (3.17)5.641.81(3.25)1.30(0.194)4.36(<0.001)10.81(<0.001)12.85(<0.001)SF-12-PCS 1207 44.9(8.7)1.74(2.58) (<0.001)3039 0.88 (2.11)6.670.73(1.96)3.41(0.001)3.65(<0.001)12.48(<0.001)1.03(0.306)SF-12-MCS 1207 54.4(8.8)45.1(8.0) (0.664) 2954 46.2(8.4)0.4446.0(8.5)1.55(0.121)4.26(<0.001)3.26(0.001)16.13(<0.001)51.9(8.5) (<0.001)2954 55.6 (8.3)8.0356.5(7.5)5.28(<0.001)3.87(<0.001)16.46(<0.001)
Table 4. Comparison of proporons of respondents with mild or or more severe depression or anxiety(PHQ-9 or GAD-7 total score5) or moderate or severe depression or anxiety (PHQ-9 or GAD-7 total score10) among intervenon group and control group respondents who completed both the baseline and 6-month follow-up assessments

Table 4. Comparison of proporons of respondents with mild or or more severe depression or anxiety(PHQ-9 or GAD-7 total score5) or moderate or severe depression or anxiety (PHQ-9 or GAD-7 total score10) among intervenon group and control group respondents who completed both the baseline and 6-month follow-up assessments
PHQ-9, 9-item Paent Health Quesonnaire[13]GAD-7, 7-item General Anxiety Disorder scale[14]SF-12-PCS, Physical Component Score of 12-item Short Form Health Survey[15]SF-12-MORCS, Mental Component Score of 12-item Short Form Health Survey[15]OR, Odds Rao95% CI, 95 percent Con fi dence IntervalaOdds rao adjusted for baseline values value and for demographic variables that were di ff erent at baseline (i.e., occupaon, occurrence of sequelae,and hospital-based treatment in prior 6 months,).
control group intervenon group comparison of control and intervenon groups scale n baseline n (%)6 months n (%)McNemar test (p) n baseline n (%)6 months n (%)McNemar test (p)at baseline OR(95% CI)at 6 months OR(95% CI)at 6 months OR(95% CI)aPHQ-9 >5 1239 218(17.6) (<0.001)3039 379 (12.5)322(26.0)32.00332(10.9)4.29(0.043)0.67(0.56-0.80)0.35(0.29-0.41)0.36(0.30-0.43)GAD-7 >5 1239 100(8.1) (<0.001)3039 106(3.5)167(13.5)22.11120(3.9)0.90(0.343)0.68(0.53-0.88)0.34(0.27-0.42)0.34(0.27-0.43)PHQ-9 >10 1239 57(4.6) (0.021) 3039 171(5.6)83(6.7)5.30151(5.0)1.38(0.240)0.75(0.54-1.04)0.57(0.43-0.76)0.60(0.45-0.81)GAD-7 >10 1239 17(1.4) (0.511) 3039 36(1.2)22(1.8)0.4329(1.0)0.68(0.410)0.86(0.48-1.54)0.53(0.31-0.93)0.60(0.34-1.07)GAD-7 >5 1239 236 (19.0)PHQ-9 or(<0.001)3039 416 (13.7)336(27.1)28.74345(11.4)9.42(<0.001)0.67(0.57-0.80)0.34(0.29-0.41)0.36(0.30-0.43)GAD-7 >10 1239 60 (4.8)PHQ-9 or(0.016) 3039 111 (3.7)88(7.1)5.79122(4.0)0.51(0.474)0.74(0.54-1.03)0.55(0.41-0.73)0.58(0.43-0.78)self-report of unstable blood pressure control 1225 --- 37(3.0) --- 3015 --- 101(3.3) --- --- 0.90(0.61-1.32) ---self-report of unstable diabetes control 1210 --- 59(4.9) --- 2979 --- 107 (3.6) --- --- 1.38(0.99-1.90) ---
In the control group, the prevalence of mild or more severe depressive symptoms, mild or more severe anxiety symptoms, moderate or severe depressive symptoms, and mild or moderate depressive or anxiety symptomsincreasedsignificantly over the 6-month follow-up period. Over the same period in the intervenon group the prevalence of mild or more severe depressive symptoms decreased significantly and the prevalence of mild or more severe depressive or anxiety symptoms also decreased significantly. The prevalence of all six measures was signi fi cantly lower in the intervenon group than in the control group at the 6-month follow-up assessment. Five of the 6 measures(with the exception of the prevalence of moderate or severe anxiety symptoms) remained significantly different between groups even after adjusting for the baseline prevalence and for demographic and clinical variables that were significantly different between the groups at baseline.
At the 6-month follow-up the self-reported rate of unstable hypertension and unstable diabetes was not signi fi cantly di ff erent between individuals in the control and intervenon groups.
4. Discussion
4.1 Main fi ndings
This 6-month community-based study was a large-scale effort aimed at assessing the feasibility of reducing the severity of depressive and anxiety symptoms of individuals with diabetes or hypertension in an environment where mental health personnel are extremely limited. At baseline the prevalence of selfreported mild or more severe depressive or anxiety symptoms (assessed using the PHQ-9 and the GAD-7)in 8813 community residents receiving treatment for diabetes or hypertension was 16% and the prevalence of moderate or severe depressive or anxiety symptoms(i.e., clinically significant symptoms) was 4%. We encountered substantial difficulties in implementing such a large intervention project (described below),but the overall outcome - based on the self-report of participants - indicates that the multi-component intervention substantially reduced the severity of both depressive and anxiety symptoms in individuals receiving roune care for diabetes or hypertension. We also found that the intervenon was associated with an improvement in the mental health component of quality of life (assessed by the Mental Component Summary score of the SF-12), but not in the physical health component of quality of life (assessed by the Physical Component Summary score of the SF-12) or in the selfreported rates of uncontrolled diabetes or hypertension.
Our results about changes in depressive and anxiety symptoms associated with the psychological intervention (primarily community-based mental health educaon campaign) are largely consistent with results from other countries. The rapid epidemiological transion (and aging of the populaon) in high-income countries and many low- and middle-income countries is resulting in dramatic increases in the prevalence of non-communicable diseases such as diabetes and hypertension, a trend that is particularly evident in China. One potential approach to reducing the health burden of such condions in high-income countries is to manage the psychological symptoms that oen co-exist with these chronic physical condions.[21]The results of studies in this area are not enrely consistent, but the weight of the evidence supports the value of alleviang symptoms of depression and anxiety in individuals with chronic medical condions.[22,23]Based on these fi ndings,internaonal pracce guidelines, such as those proposed by the Internaonal Diabetes Federaon (IDF),[24]stress the need to address psychological disorders in the management of individuals with diabetes.
Previous studies in the international and Chinese literature suggest that psychological interventions can significantly improve the indicators of somatic health such as blood pressure[23,25]and blood sugar levels,[23,26]but the conclusions from systematic reviews of these studies are inconclusive.[6,27-29]In this study we did not find differences in the change in the clinical status of diabetes or hypertension between the intervention and control groups, but our assessment of the somac effects of the intervention were limited to selfreports of having ‘unstable’ hypertension or ‘unstable’control of blood sugar levels, and to self-reports of the Physical Component Summary score of the SF-12, so the study may not have been sensitive to changes in these physical conditions. Previous studies about the correlation of objective measures of blood pressure and blood sugar levels with self-reports of blood pressure monitoring[30]and self-reports of blood sugar monitoring[31]show variable results, so basing a decision about the e ff ecveness of an intervenon on such selfreport measures is probably unwise. At the very least,future studies need to include assessment of baseline and post-intervenon blood pressure and fasng blood glucose levels.
Depression, anxiety, and chronic illness all negavely a ff ect an individuals’ quality of life. Several authors[23,32]suggest that psychological interventions that alleviate symptoms of depression or anxiety in individuals with chronic medical condions can simultaneously improve the individuals’ quality of life. The present study found that our community-based psychological intervention was associated with improvement in the psychological component of quality of life (the MCS score for the SF-12) but not in the somac component of quality of life (the PCS score of the SF-12). This result is consistent with the fi ndings of a systemac review of collaborave care[21]and with a study on the treatment of depression in individuals with coronary artery disease.[5]
This study has several major limitaons that should be considered when interpreng the results. We included community residents registered at three community health centers (CHCs) in Shanghai with diabetes or hypertension, but the included CHCs may not be representative of all CHCs in Shanghai, and, more importantly, the management rates of hypertension and diabetes in Shanghai communities is only about 40%,[33]so there may be a selection bias which limits the generalization of the results. Other factors that affect the representativeness of the sample on which the assessment of the outcome of the intervention was based (i.e., individuals who completed both the baseline and follow-up evaluations) included: (a)relatively high dropout rates for both the intervention group (56%) and the control group (35%); (b) signi fi cant differences in the demographic characteristics, clinical characteristics, and baseline results for the outcome variables of interest between those who those who do and do not complete the study; and (c) restricon of the outcome assessment for the intervenon group to the 19 neighborhoods (out of 34 neighborhoods) where the intervention was considered most effective. The initial intention to balance the proportion of participants with hypertension and diabetes in the intervention and control groups was not e ff ecve: the much higherproportion of intervention group participants than control group participants with hypertension (without comorbid diabetes) who completed the study (70% v. 54%) is particularly concerning because most reports suggest that hypertension is less likely to be associated with depressive and anxiety symptoms than diabetes.[12]
Another major problem with the study was the low participation rate in the small-group peer support effort (31% of eligible individuals participated) and in the PST counseling component of the intervenon (9% of eligible individuals participated). Only 349 of the 6897 (5%) individuals in the intervenon neighborhoods who completed the baseline assessment participated in these components of the intervention, so it is unlikely that these components of the intervenon had much effect on the overall results; thus the outcome assessment primarily reflected the outcome of the mass educaon campaign. Potenal reasons for the low participation in these components of the intervention include: (a) patients were invited to participate by the community clinicians, some of whom were unable or unwilling to take the time to explain the potential value of the psychological intervention to the target recipients; (b) concerns about privacy, confidentiality,and the sgma of being labeled as ‘mentally ill’ limited participants’ willingness to join peer support groups;and (c) the volunteer counselors who provided PST were unknown to the participants and, moreover, had little experience in working with elderly paents.
Other limitations of the study include: (a)assignment to the intervention and control groups was based on the community health service teams (6 assigned to the intervenon group and 5 to the control group) and this assignment was not done randomly,so strictly speaking the analysis should be based on comparing the mean results in these 11 ‘clusters’, not on the results of all individuals who are in the intervenon and control communities; (b) all the evaluations of outcome were based on self-compleon forms; (c) there was no clinical assessment of parcipants to determine the proportion who meet diagnostic criteria for depression or anxiety disorders; (d) all the evaluaons were non-blinded; and (e) we did not have data on blood pressure and fasting blood glucose before and after the intervention, so it was not possible to assess the effect of the program on the clinical status of the parcipants.
4.3 Signi fi cance
We find that clinically significant depressive and anxiety symptoms are relavely common in community residents in Shanghai being treated at local CHCs for diabetes or hypertension. Given the negative effect of these psychological problems on the quality of life and prognosis of individuals with these common chronic physical disorders,[5,6]developing effective strategies to reduce the prevalence of depressive and anxiety symptoms in these individuals is an important public health objective. But the severe lack of mental health manpower and the stigma associated with receiving mental health treatment in low- and middle-income countries (including Shanghai), makes the individualbased psychiatric and psychotherapeutic approaches employed in high-income countries impractical. As a first step to address this problem, we implemented a 6-month multi-component community-based intervention in 62 neighborhoods in Shanghai that had a total of 10,164 individuals registered with hypertension and/or diabetes at local community health centers. There were several methodological challenges in the implementaon of such a huge project - selecon bias in the evaluaon of the outcome, poor fidelity in the implementation of the intervention,and lack of objective measures to assess changes in the clinical status of parcipants - but the outcome of the study suggests that the intervention can result in improvement of both depressive and anxiety symptoms in individuals with diabetes or hypertension. Further,more rigorously implemented studies will be needed to con fi rm these results, but our results suggest that largescale community-based e ff orts in sengs where mental health resources are very limited can have beneficial results.
Acknowledgement
We acknowledge the support by the Changning District Health and Family Planning Commission of the Shanghai Municipality, the Changning District Mental Health Center, the Changning District Xinhua Community Center, the Changning District Community Center Health Service Division, the Changning District Huayang Community Center Health Service Division, the Minhang District Health and Family Planning Commission of the Shanghai Municipality, the Minhang Mental Health Center, the Xinzhuang Government of the Minhang District, and the Minhang District Xinzhuang Community Center Health Service Division.
Funding
This study was supported by the Key Population Psychological Health Service program (GWIII-30; this is a three-year action plan of the Shanghai public health system, 2011-2013). The funder is the Shanghai Municipal Commission of Health and Family Planning. The funder did not participate in the research design,implementation, data analysis, or drafting of the manuscript.
Con fl ict of interest statement
The authors declare no con fl ict of interest.
Informed consent
Ethics approval
The ethics committee of the Shanghai Mental Health Center approved the study (number: 2013-36).
Authors' contribuons
综合心理干预对社区慢性病患者的效果评价:一项源于社区的整群、随机、对照试验
曾庆枝,何燕玲,石振宇,刘威青,陶华,卜时明,缪栋蕾,刘萍,张煊昭,李晓萍,齐雪君,周琴
1. Li D, Lv J, Liu F, Liu P, Yang X, Feng Y, et al. Hypertension burden and control in mainland China: analysis of nationwide data 2003-2012.Int J cardiol. 2015; 184: 637-644. doi: hp://dx.doi.org/10.1016/j.ijcard.2015.03.045
2. Xu Y, Wang L, He J, Bi Y, Li M, Wang T, et al. Prevalence and control of diabetes in Chinese adults.JAMA. 2013; 310(9):948-959. doi: hp://dx.doi.org/10.1001/jama.2013.168118
3. Khuwaja AK, Lalani S, Dhanani R, Azam IS, Ra fi que G, White F. Anxiety and depression among outpatients with type 2 diabetes: a mul-centre study of prevalence and associated factors.Diabetol Metab Syndr. 2010; 2: 72. doi: http:// dx.doi.org/10.1186/1758-5996-2-72
4. DeJean D, Giacomini M, Vanstone M, Brundisini F. Patient experiences of depression and anxiety with chronic disease:a systematic review and qualitative meta-synthesis.Ont Health Technol Assess Ser. 2013; 13(16): 1-33
5. Baumeister H, Hutter N, Bengel J. Psychological and pharmacological intervenons for depression in paents with coronary artery disease.Cochrane Database Syst Rev. 2011;9: CD008012. doi: http://dx.doi.org/10.1002/14651858. CD008012.pub3
6. Baumeister H, Hutter N, Bengel J. Psychological and pharmacological interventions for depression in patients with diabetes mellitus and depression.Diabet Med. 2014;31(7): 773-786. doi: hp://dx.doi.org/10.1111/dme.12452
7. Coventry P. Multicondition collaborative care intervention for people with coronary heart disease and/or diabetes,depression and poor control of hypertension, blood sugar or hypercholesterolemia improves disability and quality of life compared with usual care.Evid based med. 2012; 17(6): e13. doi: hp://dx.doi.org/10.1136/ebmed-2012-100570
8. Duan S, Xiao J, Zhao S and Zhu X. [E ff ect of andepressant and psychological intervention on the quality of life and blood pressure in hypertensive patients with depression].Zhong Nan Da Xue Xue Bao Yi Xue Ban. 2009; 34(4):313-317. Chinese. doi: http://dx.chinadoi.cn/10.3321/ j.issn:1672-7347.2009.04.007
9. Li YJ. [The Situation and Affected Factors of Anxiety and Depression in The Patients with Hypertension].(Master's Thesis). Beijing: Beijing University of Chinese Medicine;2013. Chinese
10. Katon W, Unutzer J, Wells K, Jones L. Collaborative depression care: history, evolution and ways to enhance dissemination and sustainability.Gen Hos Psychiatry. 2010; 32(5): 456-464. doi: http://dx.doi.org/10.1016/ j.genhosppsych.2010.04.001
11. Simon G. Collaborative care for mood disorders.Curr Opin Psychiatry. 2009; 22(1): 37-41. doi: http://dx.doi. org/10.1097/YCO.0b013e328313e3f0
12. Long J, Duan G, Tian W, Wang L, Su P, Zhang W, et al. Hypertension and risk of depression in the elderly: a metaanalysis of prospective cohort studies.J Hum Hypertens. 2015; 29(8): 478-482. Epub 2014 Nov 20. doi: hp://dx.doi. org/10.1038/jhh.2014.112
13. Kroenke K, Spitzer RL, Williams JB. The PHQ-9: validity of a brief depression severity measure.J Gen Intern Med. 2001;16(9): 606-613. doi: http://dx.doi.org/10.1046/j.1525-1497.2001.016009606.x
14. Spitzer RL, Kroenke K, Williams JB, Lowe B. A brief measure for assessing generalized anxiety disorder: the GAD-7.Arch Intern Med. 2006; 166(10): 1092-1097. doi: http://dx.doi. org/10.1001/archinte.166.10.1092
15. Dale J, Williams S, Bowyer V. What is the effect of peer support on diabetes outcomes in adults? A systematic review.Diabet Med. 2012; 29(11): 1361-1377. doi: http:// dx.doi.org/10.1111/j.1464-5491.2012.03749.x
16. Hegel M, Areán P.Problem-solvingTreatment for Primary Care: A Treatment Manual for Project Impact. (Thesis dissertaon). Dartmouth University; 2003
17. Ware JE, Kosinski M, Keller SD.How to Score the SF-12 Physical and Mental Health Summary Scales. 3rd ed. Boston:The Health Instute, New England Medical Center; 1998
18. Bian CD, He XY, Qian J, Wu WY, Li CB. [Effect of andepressant and psychological intervenon on the quality of life and blood pressure in hypertensive patients with depression].Tong Ji Da Xue Xue Bao (Yi Xue Ban). 2009;34(4): 136-140. Chinese. doi: hp://dx.chinadoi.cn/10.3321/ j.issn:1672-7347.2009.04.007
19. He XY, Li CB, Qian J, Cui HS, Wu WY. [Reliability and validity of a generalized anxiety disorder scale in general hospital outpatients].Shanghai Arch Psychiatry. 2010; 22(4):200-203. Chinese. doi: http://dx.chinadoi.cn/10.3969/ j.issn.1002-0829.2010.04.002
20. Lam CL, Tse EY, Gandek B. Is the standard SF-12 health survey valid and equivalent for a Chinese population?Qual Life Res. 2005; 14(2): 539-547. doi: http://dx.doi.org/10.1007/ s11136-004-0704-3
21. Archer J, Bower P, Gilbody S, Lovell K, Richards D, Gask L, et al. Collaborave care for depression and anxiety problems.Cochrane Database Syst Rev. 2012; 10: CD006525. doi:hp://dx.doi.org/10.1002/14651858.CD006525.pub2
22. Whalley B, Thompson DR, Taylor RS. Psychological interventions for coronary heart disease: Cochrane systemac review and meta-analysis.Int J Behav Med. 2014;21(1): 109-121. doi: hp://dx.doi.org/10.1007/s12529-012-9282-x
23. Katon WJ, Lin EH, Von Kor ff M, Ciechanowski P, Ludman EJ,Young B, et al. Collaborave care for paents with depression and chronic illnesses.New Engl J Med. 2010; 363(27): 2611-2620. doi: hp://dx.doi.org/10.1056/NEJMoa1003955
24. IDF Clinical Guidelines Task Force.Global Guideline for Type
2 diabetes. Brussels: Internaonal Diabetes Federaon; 2005
25. Dai L, Wang K, Wang WJ. [E ff ect of psychological intervenon on anxiety or depression and blood pressure of elderly patients with hypertension in a community].Zhong Hua Ji Bing Kong Zhi Za Zhi. 2010; 14(11): 1126-1128. Chinese
26. Huang XF, Song L, Li TJ, Li JN, Li N, Wu SL. [E ff ect of health education and psychosocial intervention on depression in paents with type 2 diabetes].Zhongguo Xin Li Wei Sheng Za Zhi. 2002; 16(3): 149-151. Chinese. doi: hp://dx.chinadoi. cn/10.3321/j.issn:1000-6729.2002.03.002
27. Ontario HQ. Screening and management of depression for adults with chronic diseases: an evidence-based analysis.Ont Health Technol Assess Ser. 2013; 13(8): 1-45
29. Fu MM, Dong YJ. [Effect of psychological intervention on depression symptoms and blood glucose level of patients with diabetes mellitus in China: a meta-analysis].Zhongguo Quan Ke Yi Xue. 2013; 16(4): 436-439. Chinese. doi: hp:// dx.chinadoi.cn/10.3969/j.issn.1007-9572.2013.02.025
30. Gee ME, Pickett W, Janssen I, Campbell NR, Birtwhistle R. Validity of self-reported blood pressure control in people with hypertension aending a primary care center.Blood Press Monit. 2014; 19(1): 19-25. doi: http://dx.doi. org/10.1097/MBP.0000000000000018
31. Quan C, Talley NJ, Cross S, Jones M, Hammer J, Giles N,et al. Development and validation of the Diabetes Bowel Symptom Questionnaire.Aliment Pharmacol Ther. 2003;17(9): 1179-1187. doi: http://dx.doi.org/10.1046/j.1365-2036.2003.01553.x
32. Von Kor ff M, Katon WJ, Lin EH, Ciechanowski P, Peterson D,Ludman EJ, et al. Functional outcomes of multi-condition collaborative care and successful ageing: results of randomised trial.BMJ. 2011; 343: d6612. doi: hp://dx.doi. org/10.1136/bmj.d6612
33. Wu Y, Zhao YP, Huang XX, Wang JY, Xu HL, Su HL.[Management mode of urban community public health services within the family doctor system].Zhongguo Quan Ke Yi Xue. 2015; 13: 1504-1509. Chinese.
(received, 2016-03-16; accepted 2016-04-15)

Qingzhi Zeng obtained a master's degree from the Fudan University School of Public Health in 2006. She has been working at the Clinical Epidemiology Research Instute of the Shanghai Mental Health Center and the Mental Health Division of the Shanghai Municipal Center for Disease Control and Prevenon since then. She works in the areas of mental health educaon and health promoon. Her main research interests are psychiatric epidemiology, community mental health, and the development and evaluaon of scales related to mental health.
背景:抑郁与焦虑经常出现在慢性躯体疾病患者中,通常这会加深这些躯体疾病所造成的损失,但是在中低等收入国家中这一问题却很少受到关注。
目标:评估非专业临床人员和志愿者进行以社区为基础的心理干预对缓解慢性躯体疾病患者抑郁和焦虑症状的疗效。
方法:将共计10,164名接受糖尿病或高血压治疗的上海社区居民任意分配到常规治疗组 (n=2042) 或干预组 (n=8122),对干预组的干预包括社区范围的心理健康教育、同伴支持小组和个人咨询。采用自评患者健康问卷 (Paent Health Quesonnaire, PHQ-9)、广泛性焦虑量表 (Generalized Anxiety Disorder scale, GAD-7)和12项健康状况调查问卷 (12-item Short-Form Health Survey, SF-12) 来评定基线和干预6个月后的抑郁症状、焦虑症状和生活质量。
结果:8813人完成了基线评估,其中16%的人有轻度或较严重的抑郁或焦虑症状(PHQ-9或GAD-7>5),并有4%的人伴有中度或重度抑郁或焦虑症状(PHQ-9或GAD-7>10)。本研究有效实施了干预内容中的健康教育部分,但是在符合条件成为同伴支持小组的成员中仅31%的对象接受了干预措施,接受个人咨询的仅9%。本研究脱落率较高 (51%),并且在完成和没有完成随访评估的人群之间存在显著差异。经过这些混杂因素的调整后,在完成两项评估的对象中,结果表明抑郁症状 (F=9.98,p<0.001)、焦虑症状 (F=12.85,p<0.001) 以及SF-12中的心理部分总分 (F=16.13,p<0.001) 均得到显著改善。然而,自我报告未受控制的糖尿病或高血压的率没有显著变化。
结论:这些结果支持了以社区为基础的干预措施的可行性,以降低在精神科人力资源有限的中低等收入国家中慢性疾病患者抑郁和焦虑症状的严重程度。然而,在确认该措施广泛大规模实施前还有大量方法学上的挑战需在未来研究中解决。
抑郁;焦虑;社区干预;糖尿病;高血压;社区医疗服务;中国
nghai Arch Psychiatry. 2016;28(2): 72-85.
hp://dx.doi.org/10.11919/j.issn.1002-0829.216016]
1Shanghai Mental Health Center, Shanghai Jiao Tong University School of Medicine, Shanghai, China
2Shanghai Pudong New Area Mental Health Center, Shanghai, China
3Xinhua Community Health Center of the Changning District, Shanghai, China
4Changning District Mental Health Center, Shanghai, China
5Minhang District Mental Health Center, Shanghai, China
6Jiangsu Community Health Center of the Changning District, Shanghai, China
7Xinzhuang Community Health Center of the Minhang District, Shanghai, China
8Jiangchuan Community Health Center of the Minhang District, Shanghai, China
9 Corning Hospital, Shenzhen, China
10Hangzhou Seventh People’s Hospital, Hangzhou, China
11Fudan University School of Public Health, Shanghai, China
*correspondence: Professor Yanling He, Shanghai Mental Health Center, Shanghai Jiao Tong University School of Medicine, 600 Wan Ping Nan Road,Shanghai 200030, China. E-mail: heyl2001@163.com
A full-text Chinese translaon of this arcle will be available at hp://dx.doi.org/10.11919/j.issn.1002-0829.216016 on August 25, 2016.
本文全文中文版从2016年8月25日起在