Effects of Agitating Intensity on Anaerobic Digestion Performance of Corn Straw Silage
2016-01-12,,,,,,*,
, , , , , , *,
1. Agricultural College of Yanbian University, Yanji 133002, China; 2. College of Agronomy and Bio-technology / Biological Engineering Center, China Agricultural University, Beijing 100193, China; 3. Heilongjiang Bayi Agricultural University, Daqing 163319, China
1 Introduction
Agitating is an essential control factor in the anaerobic fermentation and also one of the most effective and feasible means[1]. For anaerobic fermentation of crop straws, weeds and poultry and livestock dung, if without agitating, 3 layers of fermentation liquid are clearly visible. However, using agitating, it can effectively solve the layer problem, and the problem of uneven physical, chemical and biological traits due to poor contact. Through agitating, it is feasible to increase the effective contact area, promote methane bacteria to obtain nutrients in the manner of forced diffusion, so as to accelerate biogas production and increase the biogas production of anaerobic fermentation. Thus, agitating is of great significance in anaerobic fermentation.
Agitating methods generally include pneumatic, hydraulic and mechanical agitating. From the perspective of saving power consumption, mechanical agitating is most effective[2]. In self-made anaerobic fermentation reaction system, Wang Xinetal. analyzed effect of three agitating types of anaerobic fermentation of cow dung at high temperature and results indicate that mechanical agitating is optimal process and brings the highest biogas production[3]. Khursheedetal. found that agitating can significantly increase the biogas production effect of anaerobic fermentation of cow dung at high concentration, and the demand for agitating becomes higher with increase in fermentation concentration in the anaerobic fermentation process[4]. Successful biogas projects in Germany, Denmark and Austria prove that when the viscosity of anaerobic digested materials is high, pneumatic agitating or hydraulic agitating plays a weak role, while mechanical agitating is the development trend of mixing agitator for large-scale biogas project[5]. Joseetal. studied sequencing batch reactor and pointed out that at 50 r/min agitating speed, the removal rate of reactor to filtered and non-filtered materials is 80% and 88% respectively, and there is no break of particulate sludge in solid retention time[6]. However, Hashimoto pointed out that continuous agitating brings higher biogas production than intermittent agitating for waste water biogas fermentation of beef cattle farm[7]. At present, most scholars accept active role of agitating in anaerobic digestion and believe that intermittent agitating is better than continuous agitating[8,9]. However, there are few researches about optimal agitating intensity and energy consumption in CSTR reactor biogas project.
Taking corn straw silage as material, at temperature of 35℃, using CSTR reactor in intermittent mechanical agitating mode, through pH value, biogas production, methane content, volatile fatty acid (VFA), chemical oxygen demand (COD), energy consumption, principal component analysis (PCA), and modified Gompertz model, we analyzed effects of three agitating intensity levels on anaerobic digestion performance of corn straw silage. It is expected to provide theoretical basis for agitating intensity and energy consumption of large and medium-sized straw biogas projects.
2 Materials and methods
2.1FermentationconditionsCorn straws were collected from experimental base of Yanbian University, cut into 1 cm slices, added with little lactic acid bacteria, compacted and sealed to store in 10 L fermentation bottle for silage, nitrogen source was new cow dung collected from cow breeding base of Yanbian University. Anaerobic fermentation device was 3 CSTR reactors and the active volume was 6L, as shown in Fig. 1. Three agitating intensity levels were used (200 r/min as standard, and 30 min/1 h, 30 min/2 h, and 30 min/4 h for each reactor respectively). The solid content ratio of 3 reactors was 6% TS, organic load was 3 g TS/L·d, and the temperature was set at 30℃. Active sludge for reactors was domesticated in 100 L anaerobic reactor taking cow dung and corn straws as materials, the pH value of sludge was 8.0, and total solid (TS) was 2.87%, and volatile solid (VS) was 2.09%. The fermentation time was 50 days.
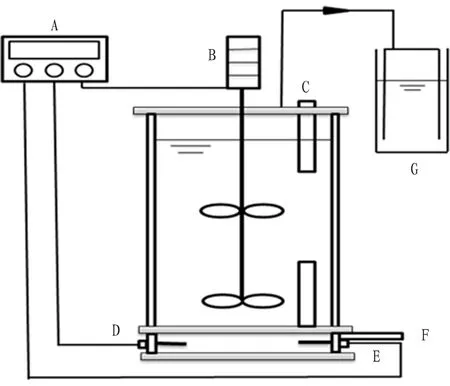
Fig.1SchematicdiagramforCSTRreactor
A: automatic control system; B: agitating system; C: feed port; D: temperature probe; E: heating rod; F: discharging port; G: gas collection
2.2Measurementmethod
2.2.1Biogas production and methane content measurement. The biogas production was measured by water discharge method, and methane content was measured by gas analyzed (Biogas-5000) of Geotech Company.
2.2.2Measurement of pH value. Everyday, fermentation liquid was taken out from fermentation tank and the pH value of inlet and outlet water was measured with pH meter (Shanghai Rex Electric Chemical PHS-3C).
2.2.3Measurement of chemical oxygen demand (COD). COD analysis was carried out by potassium dichromate method[10]. 2 mL suitably diluted water was taken, added with 2 mL digestion solution (5g Ag2SO4was dissolved in 500 mL concentrated sulfuric acid and 0.25 mol/L potassium dichromate solution, mixed at 3∶1 ratio), put into COD rapid digestion system (Shanghai Rex Electric Chemical COD-571-digestion device), after the samples were cooled, COD was measured using Rex-571 COD measuring instrument.
2.2.4Measurement of volatile fatty acid (VFA). The high-performance liquid chromatograph (HPLC) was used, chromatographic column HITACHI LaChrom C18-AQ (5 μm), column temperature 25℃, mobile phase 1 mmol/L H2SO4and 8 mmol/L Na2SO4, flow rate 0.6 ml/min, sample size 10 μL, and collection time 60 min; samples were placed in 2 mL centrifugal pipe, and centrifuged for 10 minutes at 12000 rpm, supernatant was taken and membrane was filtered for measurement. 5 kinds of standard acid (methanoic acid, acetic acid, propionic acid, butyric acid, and lactic acid) were prepared and standard curves were plotted, then quantitative analysis was carried for samples[11].
2.2.5Evaluation on anaerobic digestion performance of corn straws. We applied modified Gompertz equation to fit treated curves of cumulative biogas and methane production[12].
(1)
whereBdenotes cumulative biogas production (mLg-1VSadded),B0is potential biogas production of raw material (mLg-1VSadded),Rmsignifies maximum daily biogas production rate (mLg-1VSaddedd-1),λis the lag period (day) of anaerobic reaction of raw material, and e is the constant term (2.718).B0,Rmandλare used to evaluate nature of produced gas.
2.2.6Data analysis. We used Origin 8.0 and SPSS 17.0 software to analyze data.
3 Results and analyses
3.1EffectsofagitatingintensityondailybiogasproductionandcumulativebiogasproductionEffects of agitating intensity on daily biogas production were illustrated in Fig. 2(A). At 20 min/h agitating intensity, the daily biogas production firstly rose then declined, and finally became stabilized; at 30 min/2 h agitating intensity, the daily biogas production firstly declined and then rose, reached the peak value (2.42 L) in the 6th day, and declined and rose to stable state; at 30 min/4 h agitating intensity, the daily biogas production firstly rose, then fluctuated slighted. In the 49th day, 3 reactors reached the stable state, the biogas production of 30 min/2 h stabilized at 1.9 L, higher than 30 min/4 h agitating intensity (1.7 L) and 30 min/h agitating intensity (1.6 L). This was because proper agitating can make organic matters and microorganisms evenly distributed in reactors, accordingly increase the degradation and conversion rate of organic matters and increase the biogas production. The changes in cumulative biogas production were shown in Fig. 2(B). In the beginning 20 days, the volume of cumulative biogas production was agitating intensity 2 h>1 h>4 h; after 20 days, the volume of cumulative biogas production was agitating intensity 2 h>4 h>1 h; with increase in samples, the organic load of 1 h reactor increased, too high agitating intensity led to break of anaerobic sludge granule, and biogas production dropped[9, 13], reflecting that higher agitating intensity does not necessarily bring higher biogas production.
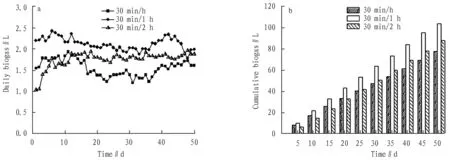
Fig.2Effectsofagitatingintensityondailybiogasproductionandcumulativebiogasproduction
3.2EffectsofagitatingintensityonpHvalueChanges in pH values at different agitating intensity took on the trend of high, low and high, and the fluctuation was not high, as shown in Fig. 3. The pH value at starting stage of reactor was 30 min/h>30 min/2 h>30 min/4 h. With operation of the reactor, anaerobic microorganism became gradually adapted to environment, pH value at different agitating intensity tended to become stable, 6.65 at 30 min/h, 6.52 at 30 min/2 h, and 6.46 at 30 min/4 h. pH values of 3 reactors were in the suitable range of pH of anaerobic fermentation, manifesting excellent reactor operation and smooth operation of anaerobic digestion reaction.
3.3EffectsofagitatingintensityonmethanecontentAt 30 min/h agitating intensity, the peak value of methane content was 56.7% and appeared in the 46th day; at 30 min/2 h agitating intensity, the peak value of methane content was 57.8% and appeared in the 29th day; at 30 min/4 h agitating intensity, the peak value of methane content was 63.2% and appeared in the 39th day. In the entire operation state, the changes of methane content were relatively stable at 2h agitating intensity. In the 45th day, the methane content of 3 reactors became stable, 55% for 1 h agitating intensity, 50% for 2 h agitating intensity, and 49% for 4 h agitating intensity respectively. At 1 h agitating intensity, the contact area of microorganisms and organic matters was increased, realizing better use of organic acid by methane bacteria, to form methane. At each agitating intensity, there were no huge changes in methane content, indicating that the effects of agitating intensity on biogas production were little, as shown in Fig. 4.
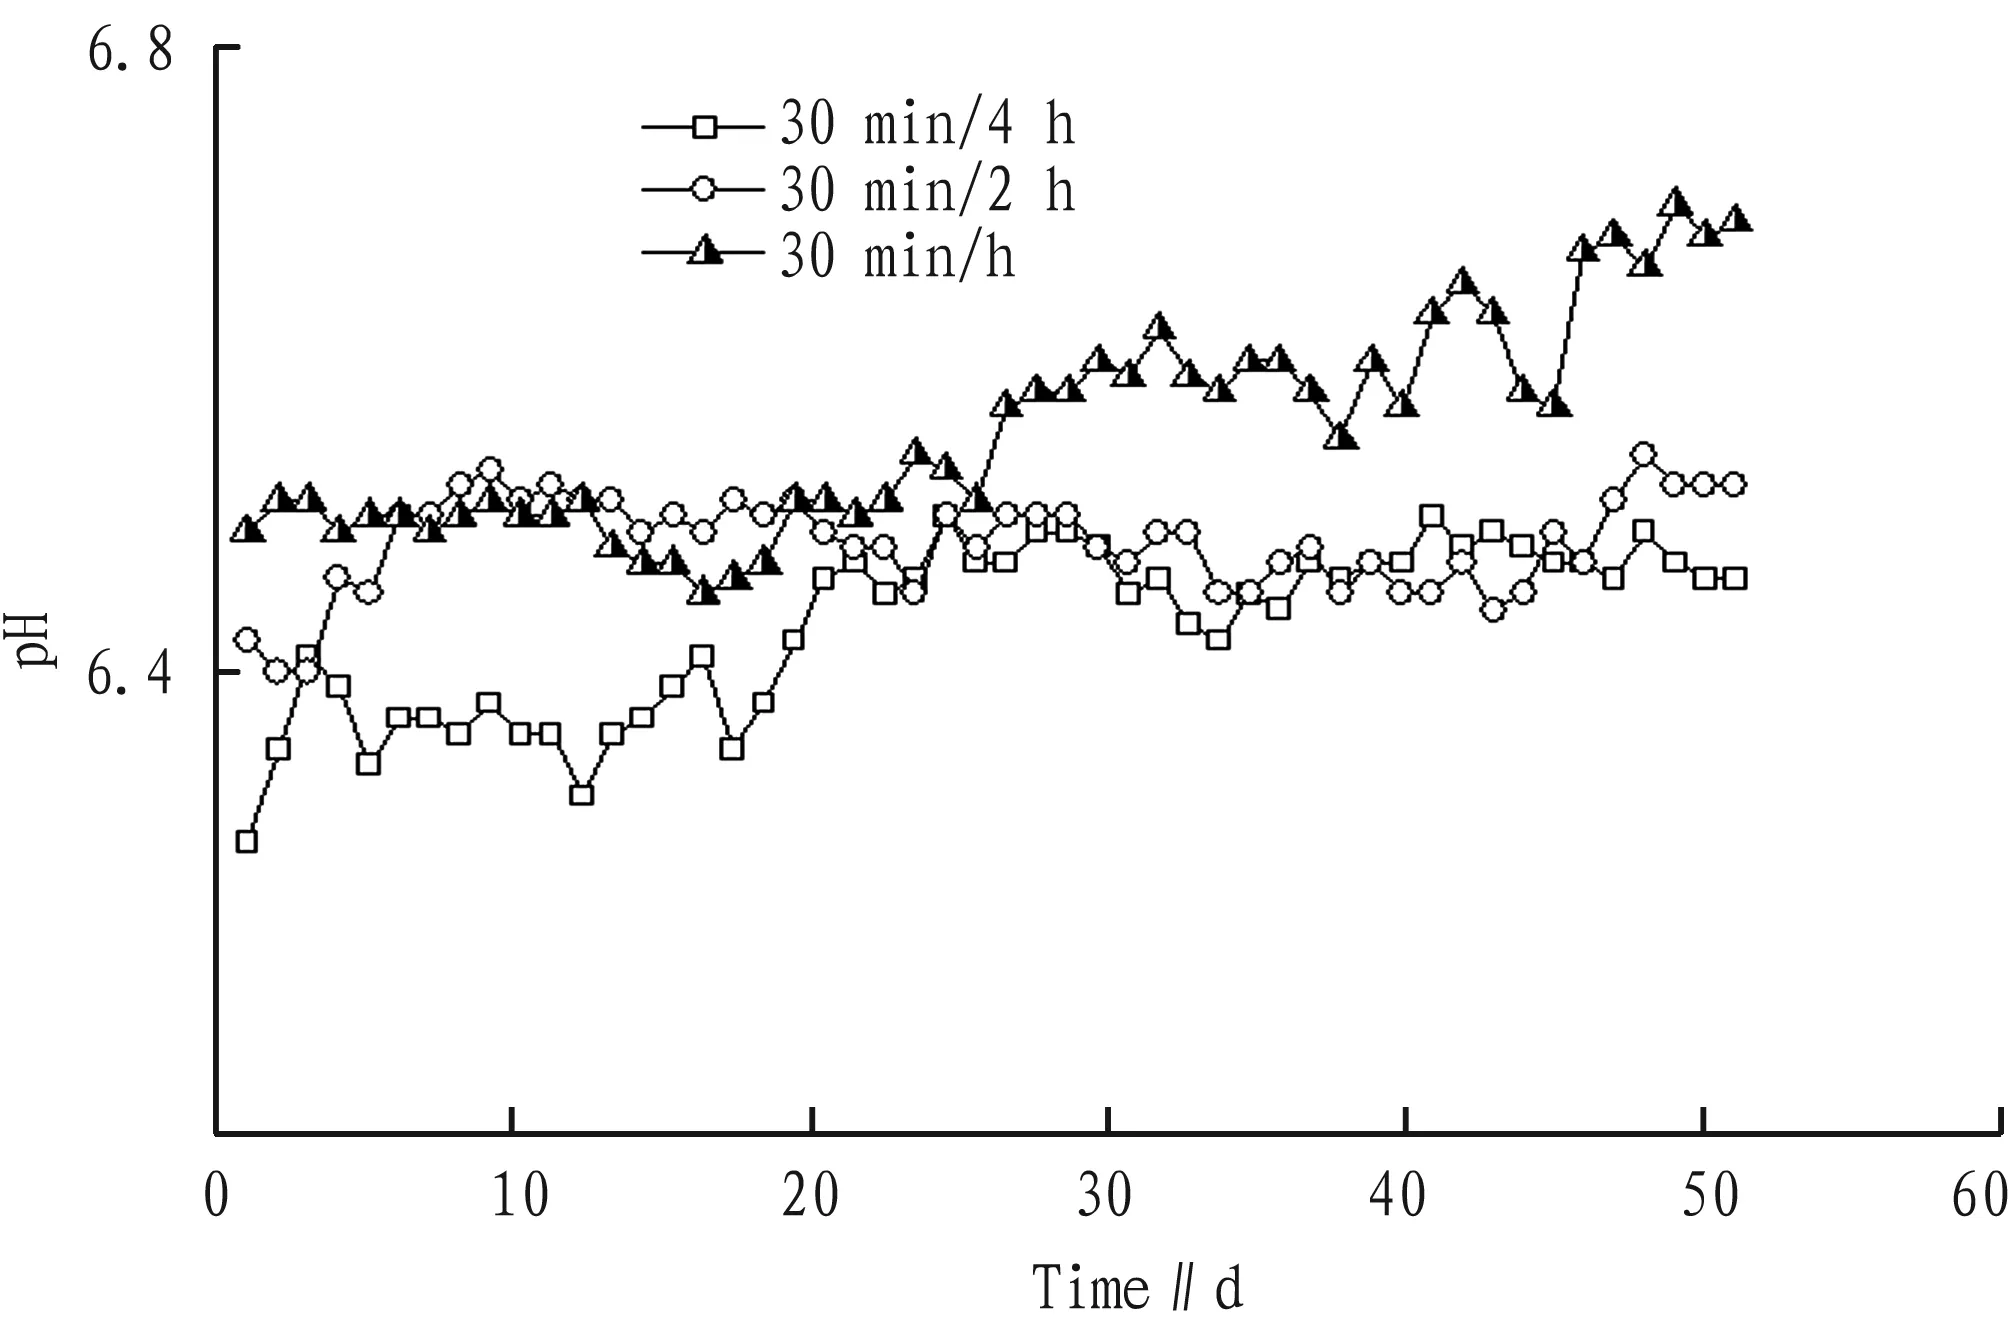
Fig.3EffectsofagitatingintensityonpHvalue
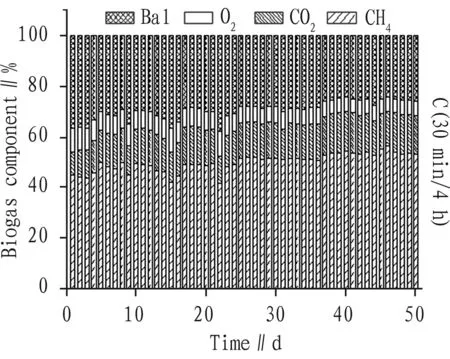
Fig.4Effectsofagitatingintensityonmethanecontent
3.4EffectsofagitatingintensityonVFAEffects of agitating intensity on VFA were illustrated in Fig. 5. VFA content at three agitating intensity levels had different degree of accumulation. At the starting state of reaction, acetic acid had accumulation at three agitating intensity levels. With increase in the reaction time, the acetic acid was constantly decomposed and the accumulation rate gradually declined to the completion of reaction. The acetic acid content was 0.77 g/L, 0.89 g/l and 0.86 g/L at 30 min/4 h, 30 min/2 h, and 30 min/h agitating intensity respectively. In the reaction, only 30 min/4 h discharge material contained methanoic acid and the content was little, it was not decomposed in the reaction. At 30 min/2 h, in the 30th day, lactic acid appeared, and in the 35th day, lactic acid was completely decomposed and utilized. The discharge liquid at three agitating intensity contained propionic acid. At 30 min/4 h, propionic acid appeared in the 25th day till the end of reaction; at 30 min/2 h and 30 min/h, propionic acid appeared in the whole process, mainly because pH environment was not suitable for decomposition of propionic acid and accumulation of organic acid was excessive at the early stage of reaction. Compared with 30 min/2 h and 30 min/h agitating intensity, the decomposition effect at 30 min/4 h was better, indicating that proper agitation is favorable for anaerobic fermentation, but higher agitating intensity will not necessarily bring better anaerobic digestion.
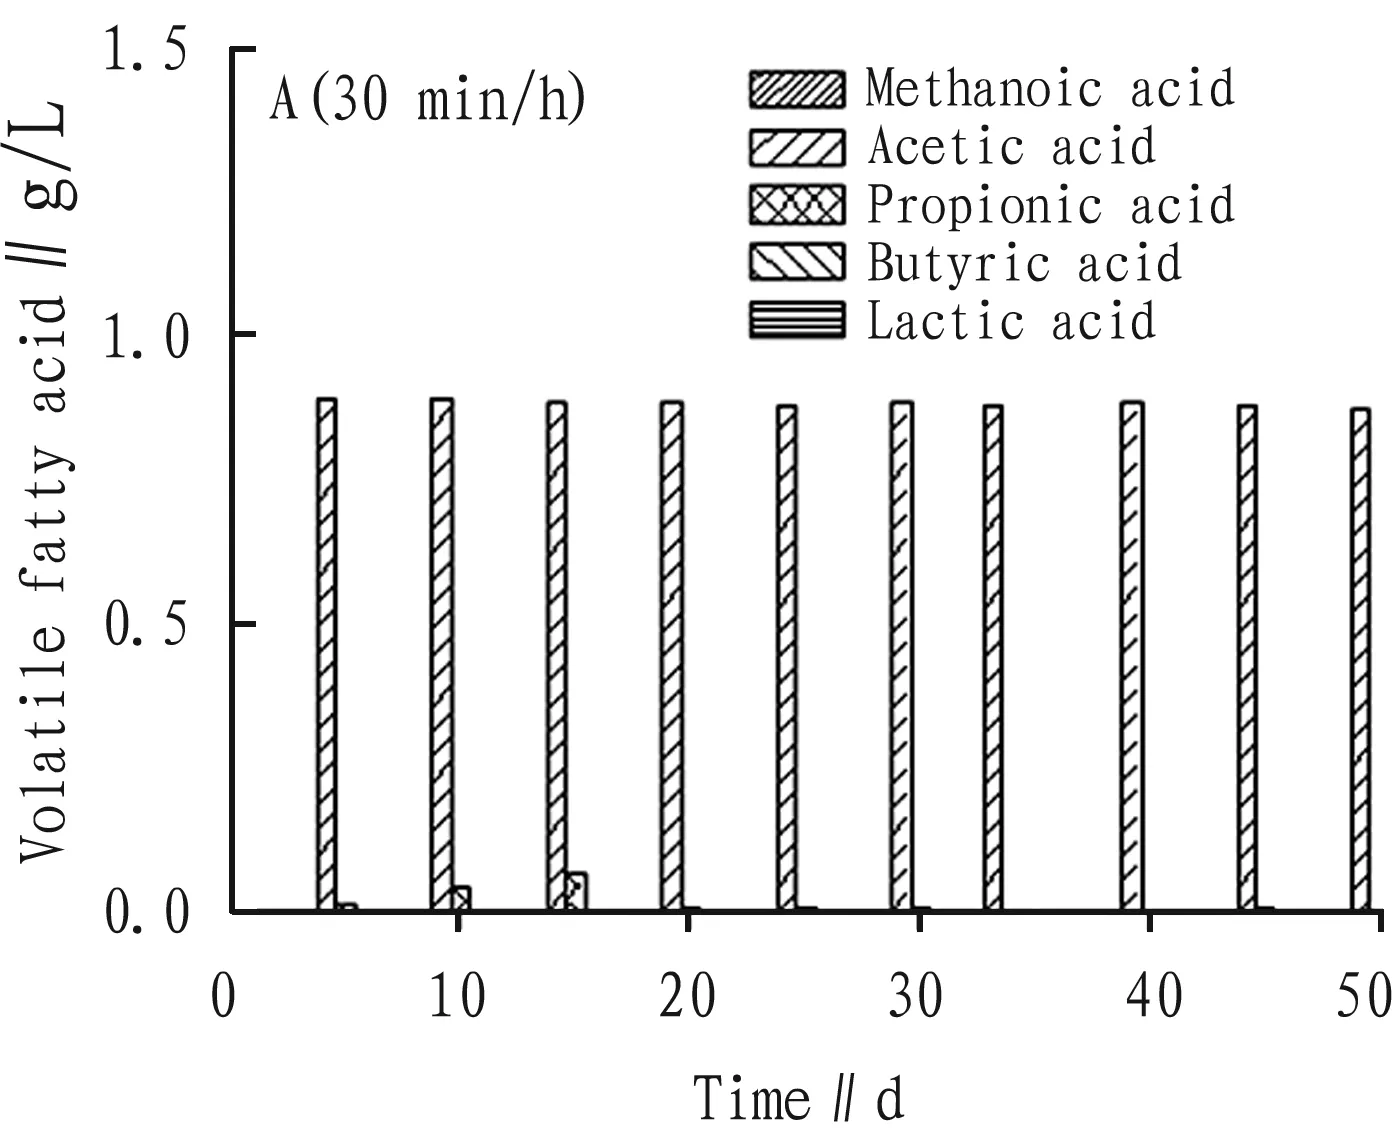
Fig.5EffectsofagitatingintensityonVFAofcornstraws
3.5EffectsofagitatingintensityonCODremovalrateAs shown in Fig. 6, the changes in COD removal rate at different agitating intensity had high fluctuation, but the COD removal rate basically remained above 60%. With increase in feeding samples, organic matters in the reactor increased, microorganisms became gradually adapted to anaerobic environment, and the metabolic capability increased, fluctuation of COD removal rate declined. In the 45th day, the operation of reactors became stable, and the COD removal rate remained above 85%. At this time, the digestion ability of microorganisms to organic matters strengthened and the reactor operation remained in excellent state.
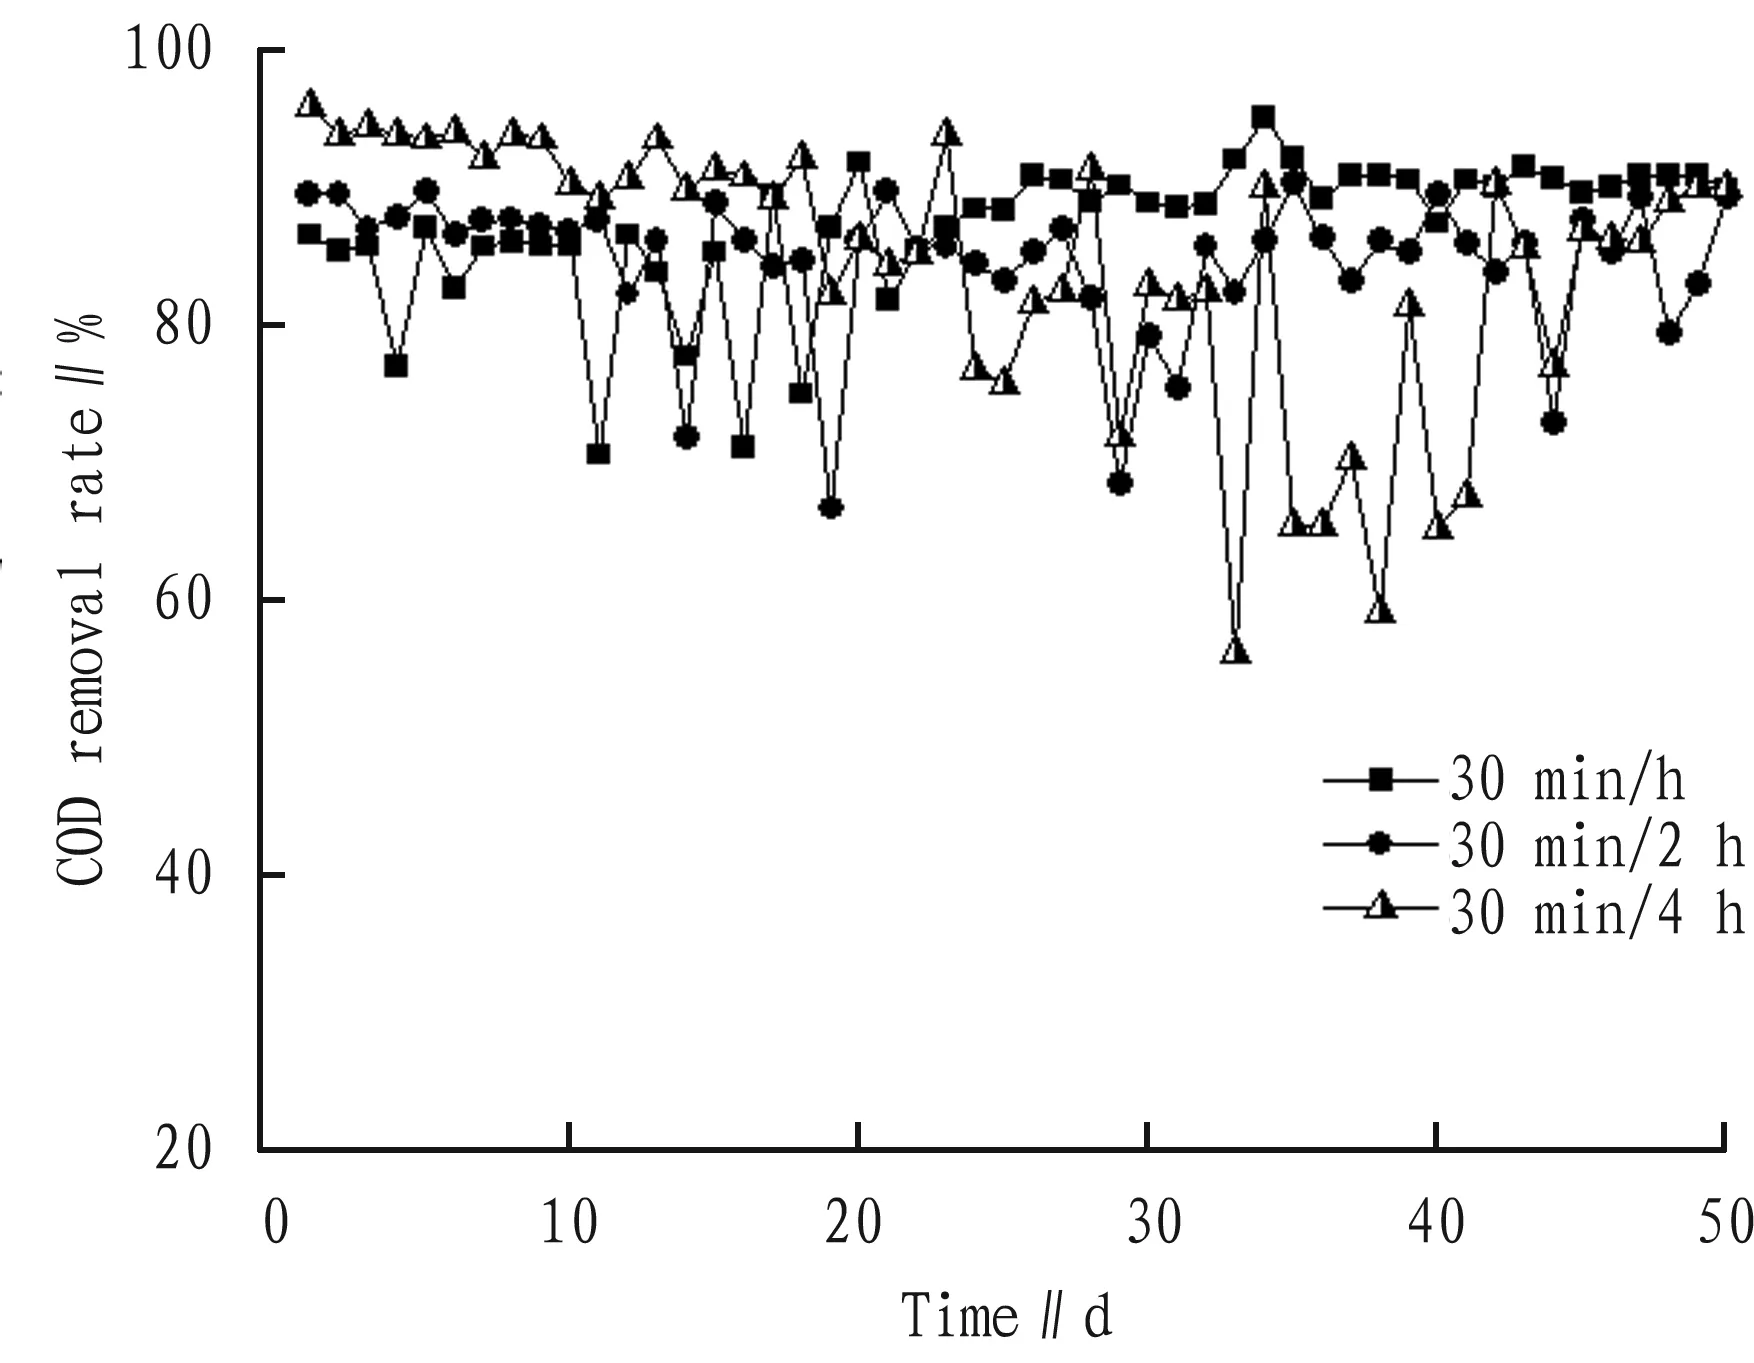
Fig.6EffectsofagitatingintensityonCODremovalrate
3.6CorrelationbetweenfactorsandagitatingintensityandbiogasproductionpotentialofcornstrawsilagePrincipal component analysis (PCA) results were shown in Fig.7. Principal components include fermentation time, biogas production, cumulative biogas, methane content, VFA, and COD removal rate.
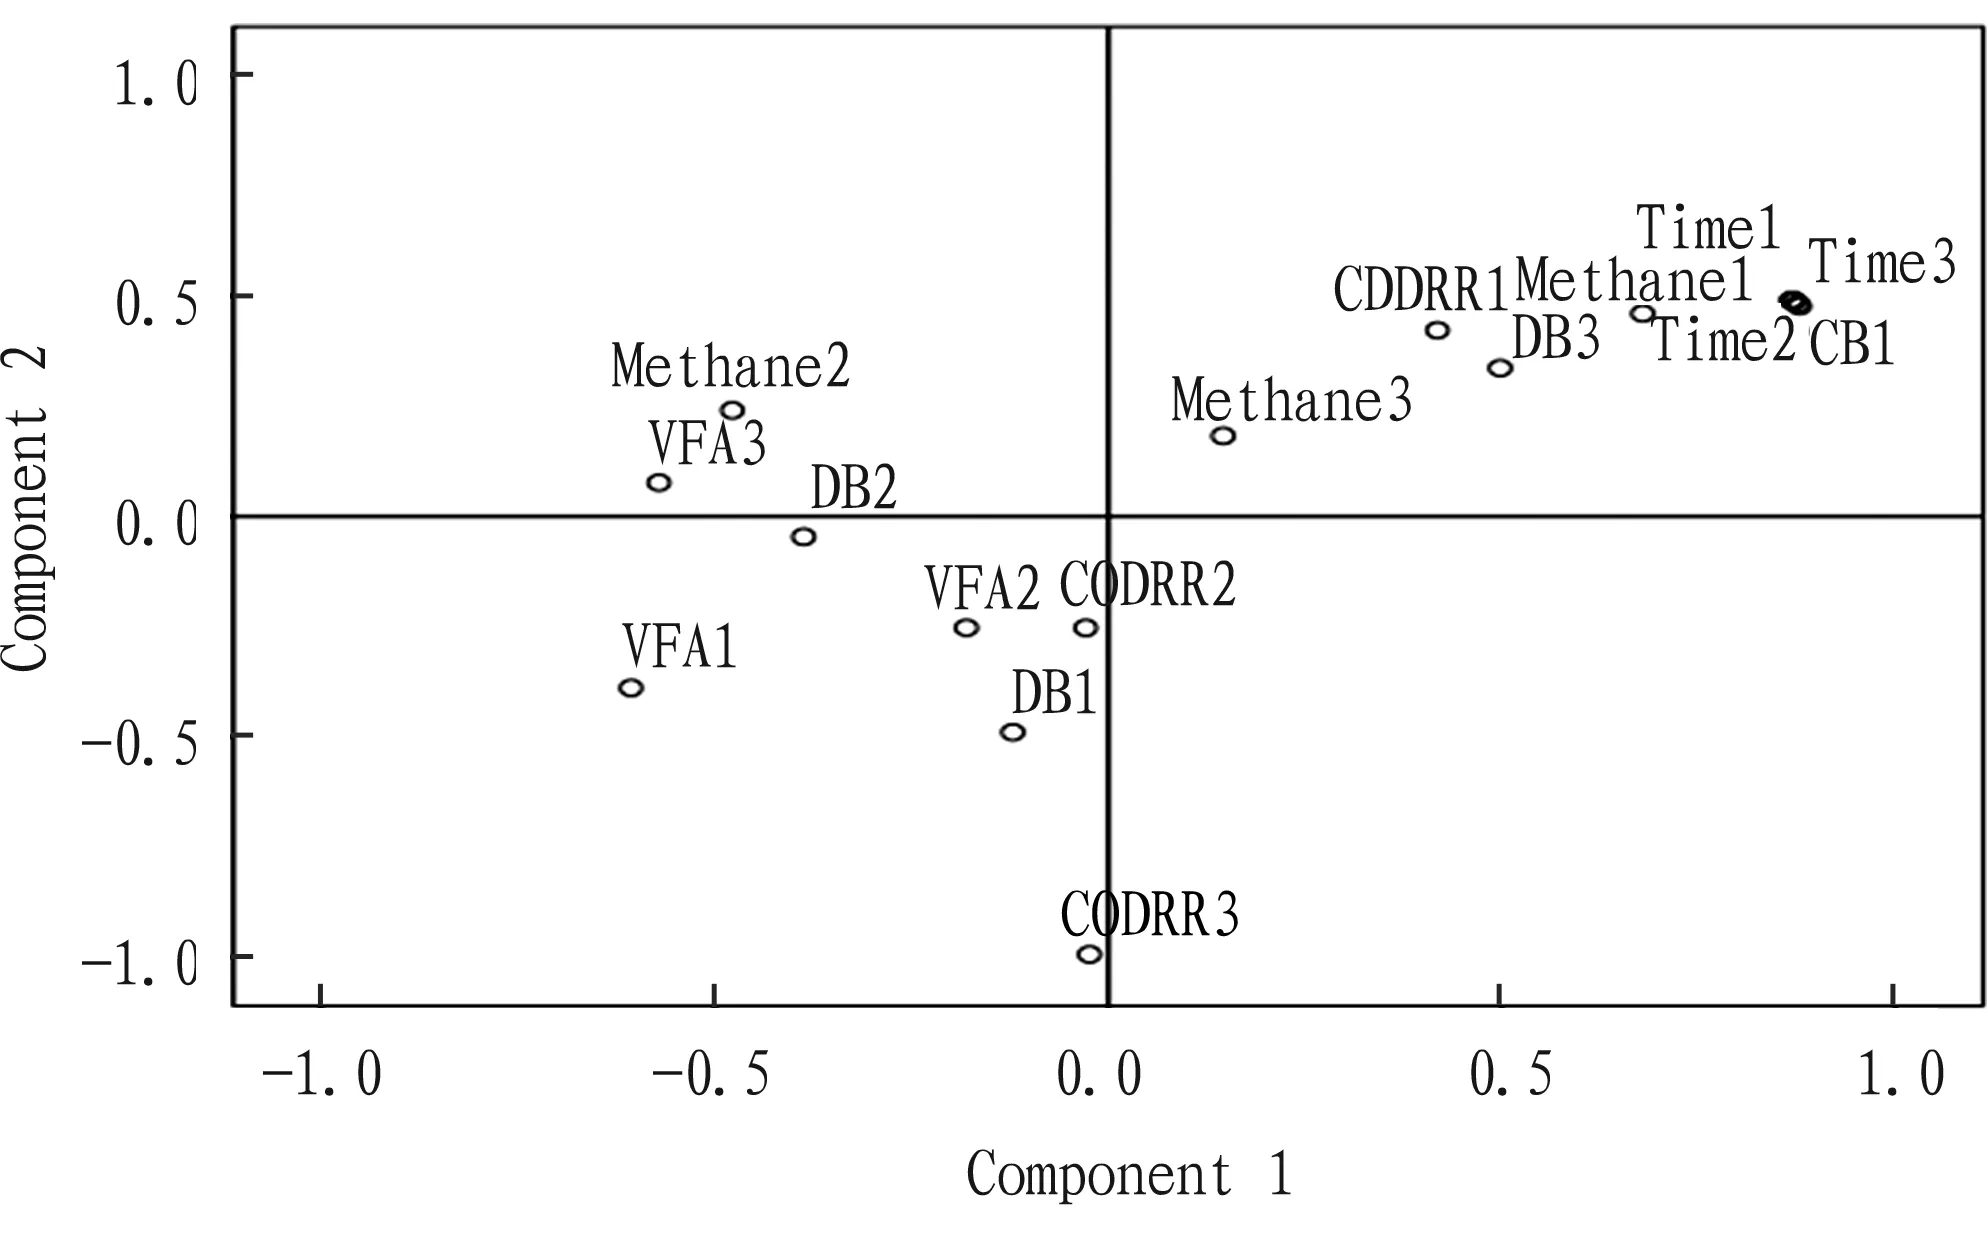
Fig.7Correlationbetweenfactorsandcornstrawbiogasproductionpotential
Note: 1 denotes 30 min/h; 2 denotes 30 min/2 h; 3 denotes 30 min/4 h; CODRR stands for COD removal rate; CB signifies cumulative biogas production; DB signifies daily biogas production.
The fermentation time was positively correlated with methane content and cumulative biogas production, indicating increase in the fermentation time can effectively increase the biogas production. At 30 min/h agitating intensity, the daily biogas production was negatively correlated with fermentation time, methane content, and COD removal rate; at 30 min/2 h and 30 min/4 h, the fermentation time was negatively correlated with methane content and COD removal rate, indicating that 1 h agitating intensity increased contact of un-decomposed and anaerobic sludge granules, which was favorable for decomposition and utilization of organic matters. At 30 min/1 h and 30 min/2 h agitating intensity, the methane content was negatively correlated with VFA, mainly because excessive agitating intensity influenced sludge structure, reduced conversion efficiency of VFA, and led to accumulation of acid.
3.7EvaluationoneffectsofagitatingintensityonanaerobicdigestionperformanceofcornstrawsilageWith the aid of the modified Gopertz model, we effectively predicted the methane production potential, maximal methane production rate, and raw material fermentation lag period at different agitating intensity. As listed in Table 1, the fitting effect of cumulative biogas production was excellent and higher than 98%. The maximal biogas production rate was 30 min/2 h>30 min/4 h>30 min/h,λwas 30 min/4 h>30 min/2 h>30 min/h, reflecting that reducing the time could increase the biogas production. By comparison, 30 min/2 h agitating intensity had better prospect of biogas production. The fitting coefficient of methane content was higher than 80%. The fitting effect was not excellent largely because the early stage of agitation influenced metabolic activity of methane bacteria in the reactor and the methane production process was not stable.
Table1Evaluationoneffectsofagitatingintensityonanaerobicdigestionperformanceofcornstrawsilage

SampleCumulativebiogasB0BmλR2MethanecontentB0BmλR230min/h97.521.721.650.9850.7852.920.120.8330min/2h134.002.392.690.9950.8165.990.170.8130min/4h118.152.054.780.9950.2469.490.150.81
3.8OptimizationofagitatingmethodsTaking horizontal helical ribbon agitator as an example, the relational expression of agitating power and rotation speed is[14]:
P2=P1(N2/N1)1+n
(2)
whereP1andP2are agitating power at rotation speedN1andN2,nis the non-Newtonian coefficient of liquid, and non-Newtonian coefficient at high concentration is 0.35-0.47[14].
Combined with actual agitating frequency and time, we could deduce the power consumption relation of agitating for 3 groups of experiment:
P30 min/h : P30 min/2 h : P30 min/4 h = 4∶2∶1
(3)
According to this formula, the power consumption at 30 min/4 h was a half at 30 min/2 h, and one fourth at 30 /h. Combined with the daily biogas production, we could obtain biogas production at the same power consumption and different agitating intensity, the average biogas production was 30 min/4 h>30 min/2 h>30 min/h. At the same energy consumption, the biogas production at 30 min/4 h was much higher than that at 30 min/1 h. In the 50 days of the operation, the reactor at 30 min/h agitating intensity consumed power up to 2816 kWh, the reactor at 30 min/2 h agitating intensity consumed power up to 1689.6 kWh, while the reactor at 30 min/4 h agitating intensity consumed power of 939.136 Wh. Combined with cumulative biogas production and power consumption, we could obtain the biogas volume for 1 kWh at different agitating intensity. From Table 2, the average biogas production was 30 min/4 h>30 min/2 h>30 min/h. In the same power consumption, the biogas production at 30 min/h was much higher than that at 30 min/1 h.
In current biogas projects, without considering the initial investment, the biogas price should be 0.75 yuan/m3to 3.6 yuan/m3, to ensure economic income of subsequent management[15]. In the 49th day, 3 reactors reached the stable state, the biogas production of 30 min/2 h stabilized at 1.9 L, higher than 30 min/4 h agitating intensity (1.7 L) and 30 min/h agitating intensity (1.6 L). Therefore, when the biogas production at 30 min/2 h was higher than that at 30 min/4 h for 300 mL, calculated at price of 3.6 yuan/m3, the economic benefit of 200 mL biogas was 0.072 yuan. The biogas production at 30 min/2 h was the highest, so 200 mL biogas production consumed 3.2 kWh power. Now, the electricity price in Jilin Province is 0.38 yuan/m3(tax included), the economic benefit of 3.2 kWh power will be 1.22 yuan. This is much higher than the economic benefit obtained from 200 mL biogas. In sum, 30 min/4 h agitating intensity has the highest economic benefit. In other words, from the perspective of power consumption, higher agitating intensity will not necessarily bring higher biogas production and higher economic benefit.
Table2Comparisonofaveragebiogasproductionatdifferentagitatingintensity

AgitatingintensityBiogasproductionatthesamepowerconsumption∥mL/℃BiogasproductionofonekWhelectricity∥mL/℃30min/h40027.530min/2h95061.530min/4h170093.4
4 Conclusions and discussions
We set three reaction intensity levels in this experiment: 30 min/h, 30 min/2 h, and 30 min/4 h. Results of daily biogas production and cumulative biogas production indicate that the biogas production at 30 min/2 h is higher than 30 min/4 h and 30 min/h. We can arrive at the conclusion that proper agitation is favorable for anaerobic fermentation, but higher agitating intensity will not necessarily bring better anaerobic digestion. From the COD removal rate, we could see, when the reactor operation is stable, agitation can increase digestion ability of microorganisms to organic matters, to obtain excellent state of reactor. Proper agitation can fully mix old and new liquid, render microorganisms to fully contact nutrients, so as to promote biochemical reaction. Besides, it can increase the contact area of solid matters with microorganisms in the liquid, strengthen the biological chain between microorganisms, improve the sludge activity, and promote decomposition of these matters, and also avoid crusting of solid matters due to sedimentation or float. Taking pig dung as material (TS 8%), Liu Yietal. applied intermittent agitating (8 times, 4 times, and 2 times daily), and results indicate that higher agitating frequency brings slight decline in biogas production[16], which was also proved by conclusion of Samantha[17].
Besides, too high agitating intensity influences the sludge structure, reduces VFA conversion efficiency, and leads to acid accumulation, which was proved by research of Prasad Kaparaju (2008)[18]. Violent agitating intensity leads to accumulation of VFA, hinders growth of microorganisms, and restricts biogas production. Previous research results also indicate that excessive agitation influences microorganism activity, break of sludge, and anaerobic digestion reactor presents lower operation performance compared with no agitation, it fails to bear the perturbation brought about by impact load, and the most direct macro result is decline in biogas production[1].
There is a close relationship between biogas production effect, agitating methods, and power consumption[4, 9, 19]. Through comparison of biogas production effect, at the same power consumption, the average biogas production is 30 min/4 h>30 min/2 h>30 min/h, and the biogas production at 30 min/4 h is much higher than that at 30 min/1 h. Power consumption of agitation takes up about 50% of power consumption of the entire biogas project, and takes up 2.7%-20.6% of the output power consumption of the project[20]. Therefore, under the premise of saving energy, the agitating mode should reach agitation effect and satisfy the demand of minimum power consumption. Our experiment took 30 min/4 h agitating intensity as the operation mode of biogas tank. This intensity can satisfy normal fermentation and also can greatly save power consumption. Qin Feng took biogas jet agitating mode and studied anaerobic digestion of sludge[21], and his results indicate that in this agitating mode, agitation every 4 hours is most appropriate. This is consistent with our experiment results.
In conclusion, 30 min/4 h intermittent mechanical agitating mode is suitable for large-scale biogas fermentation. It not only promotes normal operation of methane process, but also satisfies the demand of minimum power consumption, to realize maximum economic benefit.
[1] LIU Y,WANG ZY, KONG CX,etal. Research progress of mixing and stirring process in biogas fermentation [J] China Biogas, 2009(3): 26-30. (in Chinese).
[2] BRADE CE, NOONE GP. Ansgrobic digestion-need it be expensive [J].Water Pollution Control,1981,80:70-76.
[3] WANG X, WANG YP, LIU W,etal. Research on the effect of different mixing methods of scum layer on the gas production rate of thermophilic anaerobic fermentation [J]. Heilongjiang Academy of Sciences, 2014(9): 6-8, 11. (in Chinese).
[4] KHURSHEED K, REBECCA H, THOMAS K,etal. Anaerobic digestion of animal waste: waste strength versus impact of mixing [J].Bioresource Technology,2005,96(16):1771-1781.
[5] GAN RH. Study on the stirring reactor for the poultry and livestock manure digestion [D]. Wuhan: Huazhong Agricultural University, 2004. (in Chinese).
[6] JOSE ADR, SUZANA MR, EDUARDO FMDC,etal.Influence of agitation rate on the performance of an anactobit sequencing batch reactor containing granulated biomass treating low-strength wastewater [J].Advances in Environmental Research,2003(7):405-410.
[7] HASHIMOTO AG. Effect of mixing duration and vacuum on methane production rate from beef cattle waste [J]. Biotechnology and Bioengineering,1983,24(1): 9-23.
[8] XIONG XF, JIA LJ, NING P,etal. Jet mixing improving biogas production performance of mesophilic anaerobic fermentation with cow manure [J]. Transactions of the Chinese Society of Agricultural Engineering (Transactions of the CSAE), 2015, 31(19): 222-227. (in Chinese).
[9] YANG H, DENG LW, LIU Y,etal. A review on effects of stirring on biogas production of anaerobic digestion [J]. China Biogas, 2010(4):3-9, 18. (in Chinese).
[10] ZHANG YD,LIU S. Comparison and analysis of two methods for COD measurement [J]. Journal of Beijing Institute of Civil Engineering and Architecture, 2003,19 (3): 16-19. (in Chinese).
[11] YUAN XF, GAO RF, LI PP,etal. Improvmentof anaerobic biogasification efficiency by pretreatment of corn straw with composite microbial system of MC1 [J]. Transactions of the Chinese Society of Agricultural Engineering (Transactions of the CSAE), 2011, 27(9):266-270. (in Chinese).
[12] GINKEL SV, SUNG SW, LAY JJ. Biohydrogen production as a function of pH and substrate concentration. Environmental science and technology, 2001, 35(2): 472-480.
[13] ALASTAIR JW, PHIL JH, PETER JH,etal. Optimization of the anaerobic digestion of agri-culture resources[J]. Bioresource Technology, 2008, 99: 7928-7940.
[14] YU L, MA J,CHEN S. Numerical simulation of mechenical mixing in high solid anaerobic digester [J]. Bioresource Technology, 2011, 102(2): 1012-1018.
[15] XIONG FL, ZHU HG, SHI HX, WU JH. Analysis on the price of the biogas for rural centralized biogas plant [J].China Biogas,2011(4):16-19.
[16] LIU Y. The study of mixing and stirring for high solids biogas fermentation and its influence factors [D]. Chinese Academy of Agricultural Sciences, 2009. (in Chinese).
[17] SAMANTHA CP, SUZANA MR, JOSE AD,etal. Feasibility of treating partially soluble wastewater in anaerobic sequencing batch biofilm reator (ASBBR) with mechanical stirring [J]. Bioresource Technology, 2005, 96(4): 517-519.
[18] KAPARAJU P. Effects of mixing on methane production during thermophilic anaerobic digestion of manure:Lab-scale and pilot-scale studies[J]. Bioresource Technology,2008(99):4919-4928.
[19] FU GZ,LI XJ,YUAN HR,etal. Investigation on effect of stirring on anaerobic digestion performance of wheat straw [J]. Renewable Energy Resources,2011(2):65-68, 73. (in Chinese).
[20] LI DY, LI SJ, LIU TS,etal.Effect of mixing on dry anaerobic digestion of dairy manure[J].Transactions of the Chinese Society of Agricultural Machinery,2013(2):117-120. (in Chinese).
[21] QIN F. The experimental research for the sludge anaerobic digestion mixing technology [J]. Wastewater Engineering, 1996(2): 61-62. (in Chinese).
杂志排行
Asian Agricultural Research的其它文章
- Empirical Study on the Relationship between Organizational Flexibility and Performance of Agricultural Enterprise
- Correlation between Employment Quality and Skill Training of Land-expropriated Farmers
- A Study on Spatial Distribution of Commercial Housing Prices in Xiangtan City
- Design and Experiment of Fluid Dynamic Ultrasonic Water Aerator
- The Relation between Age Structure of Population and Resident Consumption Based on Endogenous Growth Theory
- Effect of Different Pretreatments on Explosion Puffing Drying of Hami Melon at Modified Temperature and Pressure in Xinjiang
