A Study on Spatial Distribution of Commercial Housing Prices in Xiangtan City
2016-01-12,
,
School of Architecture and Art Design, Hunan University of Science and Technology, Xiangtan 411201, China
1 Introduction
Commercial housing is an important part of the real estate market, and since China began its reform of housing system, housing prices have become the focus of attention for the government, residents, developers, and academics. There are significant differences in housing prices between cities, and even in different areas of the same city, the housing prices show significant differences[1]. It is an urgent problem to study the spatial differentiation of housing prices within city and its mechanism. The domestic empirical analysis on spatial distribution pattern of housing prices within city is mainly concentrated in first-tier and second-tier cities such as Beijing, Shanghai, Guangzhou and Nanjing[2-7]. In this paper, with Xiangtan City as the research object, we use ArcGIS spatial analysis method to analyze the spatial pattern of housing prices and its driving mechanism, in order to explore the spatial variation characteristics of urban housing in China’s four-tier cities, and provide a reference for the development of housing industry in Xiangtan City.
2 Study area, data sources and correction
2.1OverviewofthestudyareaXiangtan (111°58′-113°05′ E, 27°21′-28°05′ N) is a prefecture-level city in Hunan Province, China, located on the lower reaches of Xiangjiang River, with a total area of 5015 km2. At the end of 2015, the city’s permanent population was 2.813 million, and GDP was 170.31 billion yuan. Xiangtan’s city center is the most active region in terms of economic development and urban construction, including Yuetang District, Yuhu District, High-tech Industrial Development Zone, and Economic and Technological Development Zone. In this paper, the study area only includes the two districts and two development zones in Xiangtan’s city center. Since 2006, in the context of new round of rapidly rising national housing prices, Xiangtan’s housing prices have also begun to rise. After a brief standstill in 2008, Xiangtan’s housing prices rose rapidly during 2009-2010. In 2010, the state adopted a series of regulatory policies, and Xiangtan’s housing prices still maintained a steady rising trend. The housing price changes in Xiangtan are not only due to real estate industrial development, but also related to the Chang-Zhu-Tan urban agglomeration construction, economic restructuring, regional economic policies, urban planning and construction and other factors.
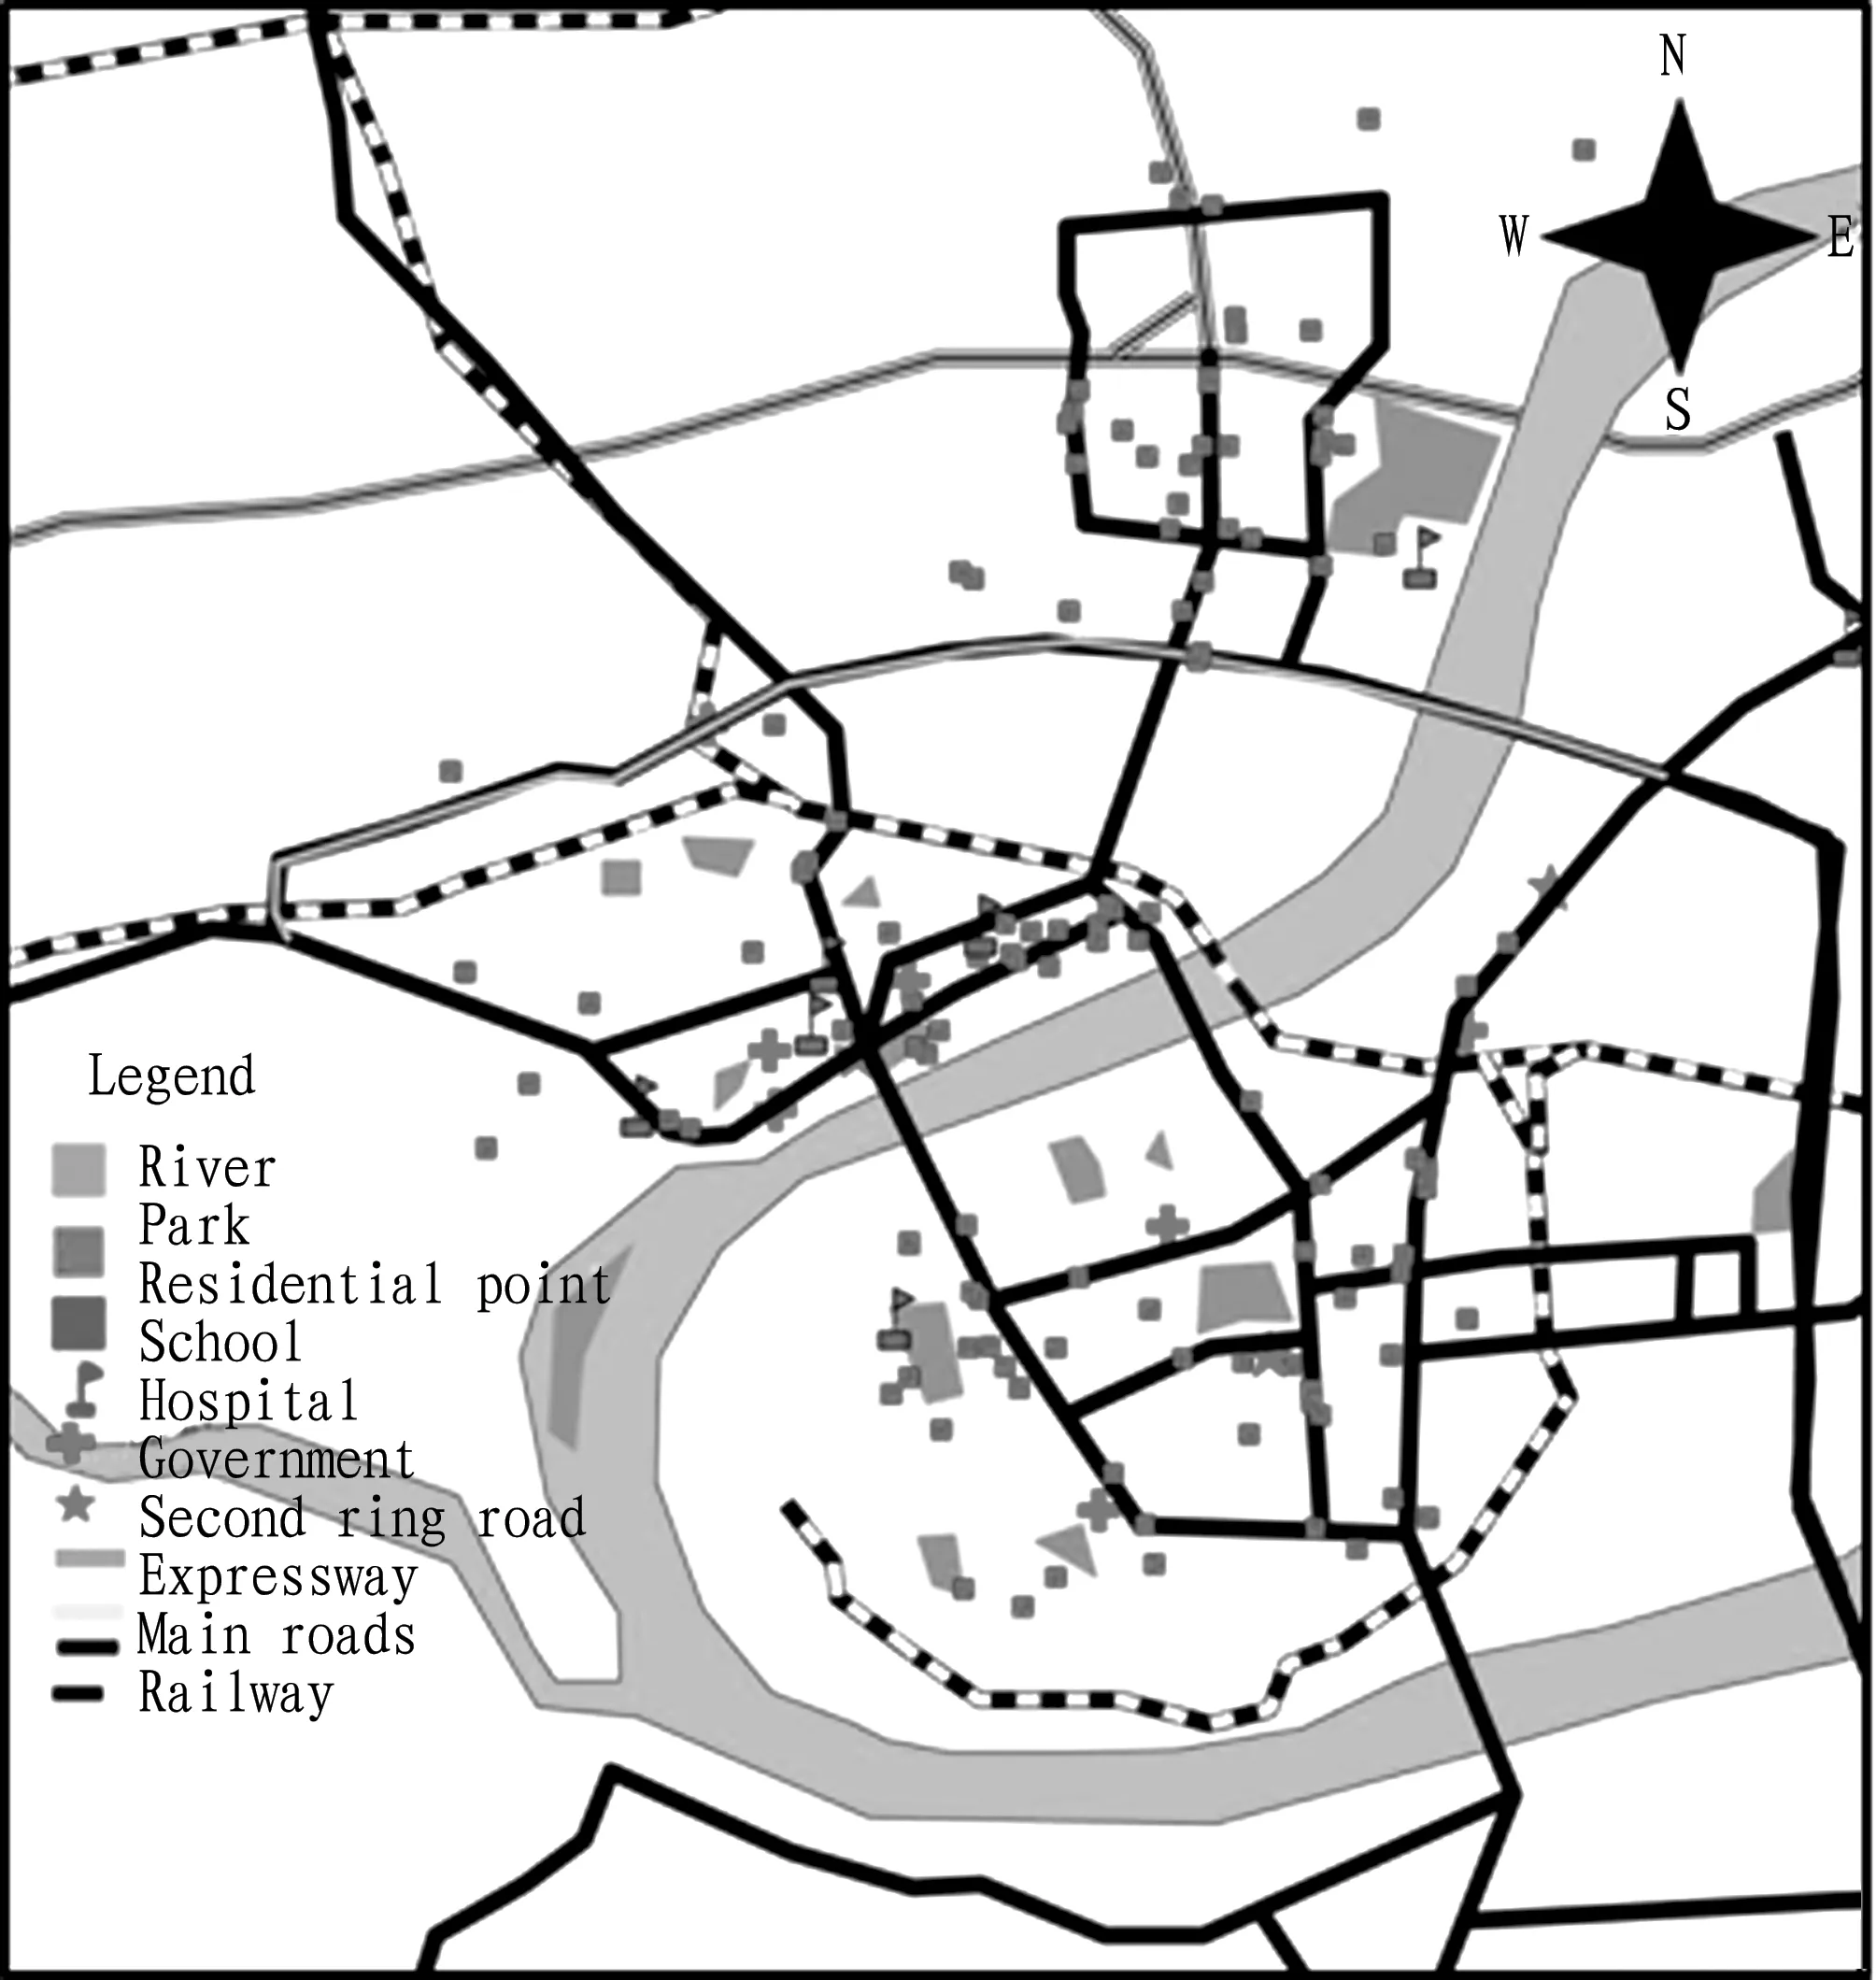
2.2DatasourcesandcorrectionWe obtain the price data of 116 new buildings opened in Xiangtan City during 2006-2015 from House 365, Anjuke and Fang. We use GoogleEarth to get the latitude and longitude of each sample point, and use ArcGIS software to establish the spatial property database of Xiangtan City. To enable the average housing price in different years to be comparable, we use the housing sales price index in Xiangtan City during 2006-2015 to correct the commercial housing prices during 2006-2015 to the comparable prices in 2015. The final results are denoted by the comparable prices in 2015. We use the mode of building coordinates as a batch in ArcGIS to mark the above information on the vector land use map in Xiangtan City, and establish spatial data map of housing project in Xiangtan City during 2006-2015 (see Fig. 1). The spatial data map can accurately reflect the spatial distribution of commodity housing projects in Xiangtan’s city center during 2006-2015.

Fig.1Residentialsampledistribution
3 The spatial interpolation analysis of housing prices in Xiangtan City
3.1Analysisofthespatialcharacteristicsofresidentialpoints
3.1.1Average nearest neighbor analysis. Average nearest neighbor analysis is a method used to judge the point space state. The judgment is based on the nearest neighbor index. If the index is smaller than 1, it is the spatial concentration mode; if the index is greater than 1, it is the spatial discretization mode[1]. We select the location information of residential points, and use ArcToolbox tool of ArcGIS to analyze the location information of residential points. The results are shown in Table 1, and the nearest neighbor index is 0.659787, less than 1, so it is the spatial concentration mode. AndZvalue is -7.00987, significantly less than the significance test value of -2.58 at 1%. Based on the above comprehensive analysis, it can be found that the residential agglomeration is very obvious in Xiangtan City.
3.1.2Spatial autocorrelation analysis. Global spatial autocorrelation is the spatial characteristics description of samples in the study area, and tests whether there is agglomeration effect in variables[8]. There are many indicators and methods to describe the global spatial autocorrelation, and here we use Moran’s I. It is calculated as follows:

(1)
whereyiis the value of pixeli;yjis the adjacent pixel value of pixelj;ymis the mean of raster pixel;aijis the coefficient, and whenjis closest toi, the value is 1, otherwise 0;nis the number of all pixels in a raster.
The results calculated according to Equation (1) are shown in Table 2. From Table 2, it is found thatI=0.082159>0, indicating that housing prices show the spatial aggregation of similar values on the whole, that is, the closer the values, the more similar the prices.Zvalue is 7.702127, greater than the bilateral test value of 2.58 at 99% confidence interval, so there is spatial autocorrelation, and the agglomeration is significant.
Table1ThenearestneighboranalysisofXiangtan’shousing

NumberofsamplesAverageobservationdistance∥mAveragedesireddistance∥mNearestneighborindexZscorePvalue1160.0034750.0052670.659787-7.0098790.000000
Table2GlobalautocorrelationanalysisofhousesinXiangtanCity

NumberofsamplesMoranIindexExpectedindexVarianceZ-scorePvalue1160.082159-0.0086960.0001397.7021270.000000
3.2Geostatisticalanalysis
3.2.1Normal distribution analysis. Using the histogram and normal QQ plot tool in geostatistical module, the position information of 116 residential points is loaded for data analysis. The results are shown in Fig. 2. From the distribution results, it is found that some points deviate far from straight line, not following normal distribution. By changing the data, it is found that the data log transformation results approximate to normal distribution (see Fig. 3). This provides a theoretical basis for the later use of Kriging interpolation method.
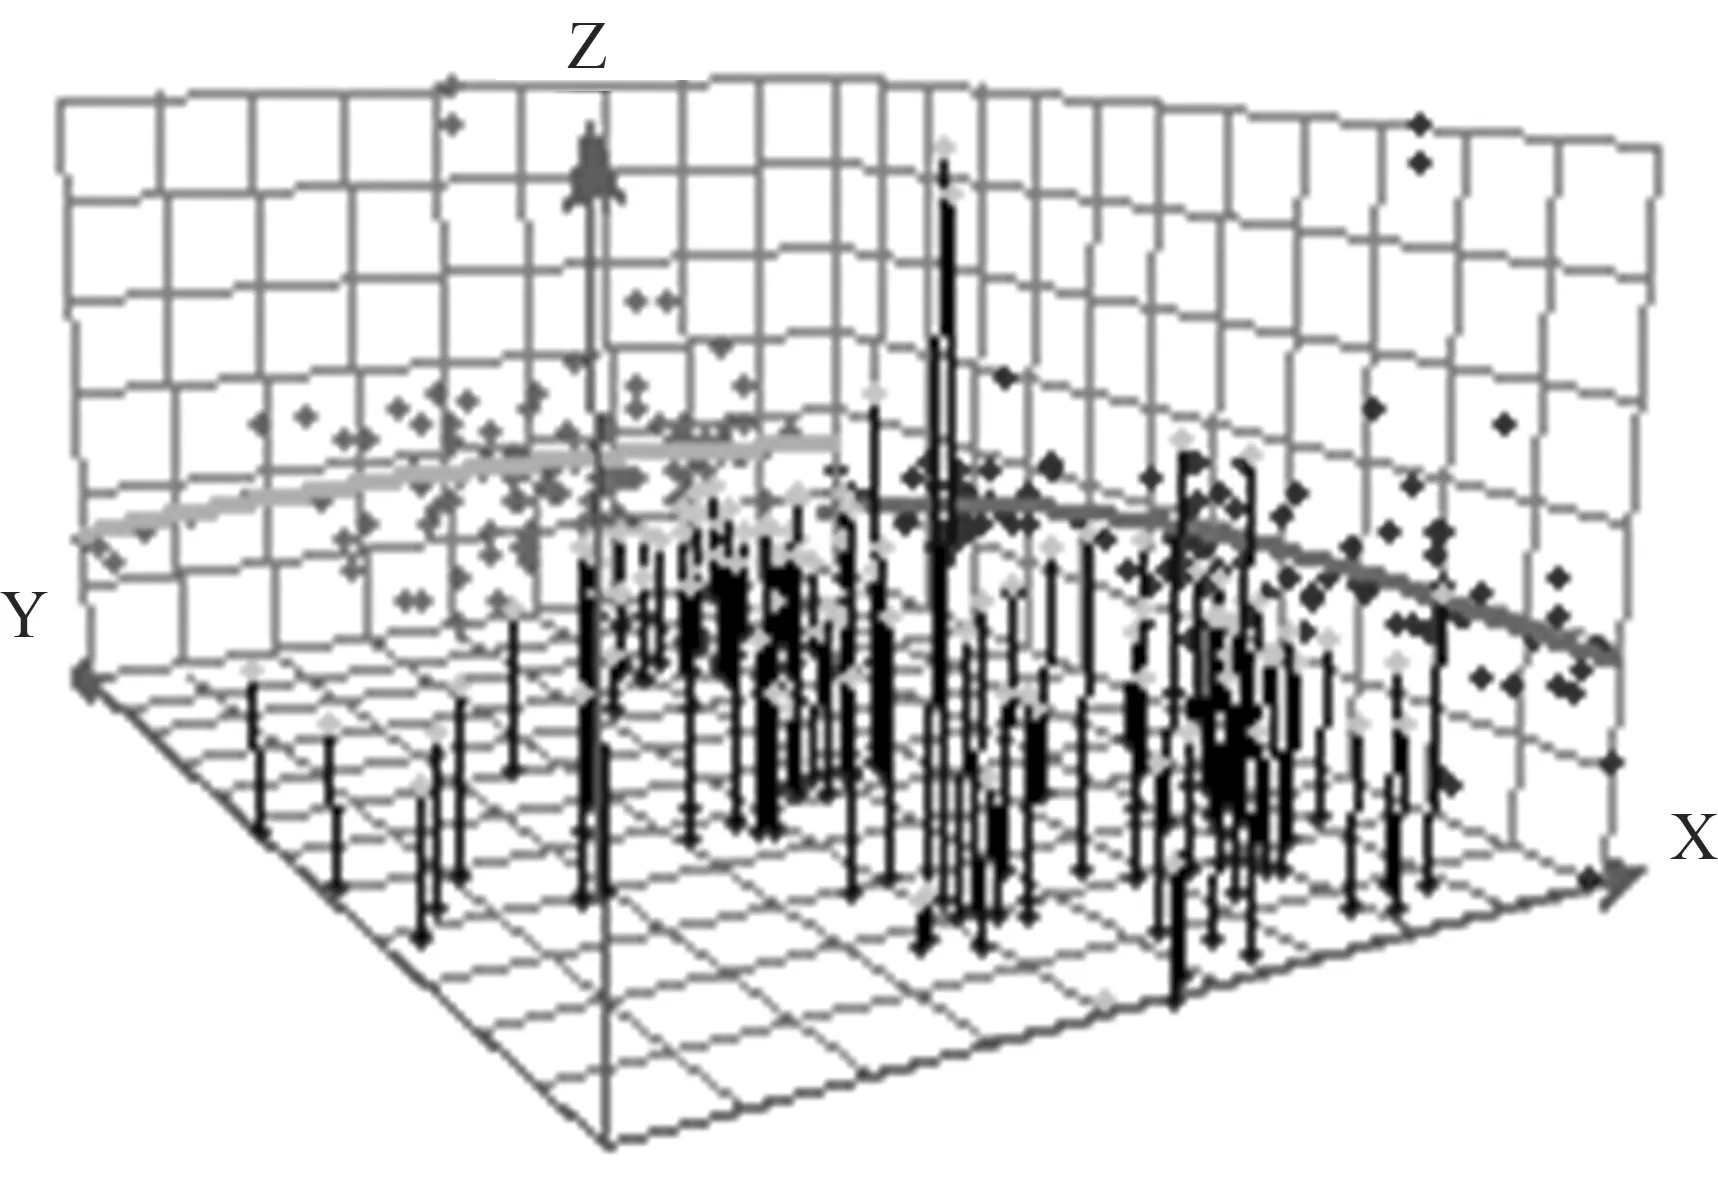
3.2.2Trend analysis. Global trend analysis can reflect the spatial changes in data, and it ignores individual outliers, looks for trends in overall data distribution in the space, and finally draw the fitting curve. If the fitting curve is not a horizontal line, it indicates a trend. The trend analysis in geostatistical module is used, and the results are shown in Fig. 4.
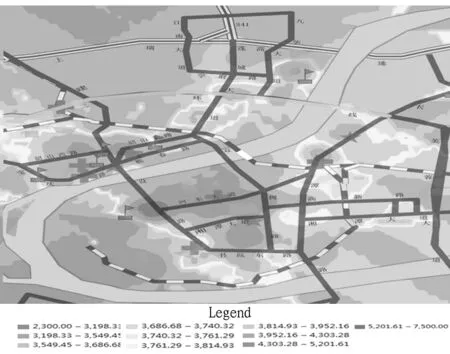
3.2.3Kriging interpolation. In this paper, the Kriging interpolation method is based on the trends in regionalized variable data, and spatial autocorrelation. Using Kriging interpolation, we get the interpolation map (see Fig. 5).
4 The spatial distribution characteristics and driving mechanism of housing prices in Xiangtan City
4.1Thetwo-centerringdistributionpatternofhousingpri-cesandthedrivingfactorsAs shown in Fig. 5, it can be found that Xiangtan’s spatial pattern of housing prices shows two-center ring distribution, but not regular concentric distribution. The main center ring (5200 yuan/m2or more) is located near Hedong Jianshe Road. The sub-center ring (4300 yuan/m2or more)is located near Hexi Jijianying. The two-center ring distribution pattern is mainly driven by the following two factors. (i) Urban commercial center. Urban commercial center is the place where high-end commercial buildings and department stores are concentrated, and buyers have distinct willingness to pay for living in the vicinity of urban commercial center. The urban commercial center can significantly improve the housing prices in the surrounding regions. Xiangtan City is a fourth-tier city in Central China, and commercial centers play a more prominent role in raising housing prices of the surrounding regions. (ii) Residential environment advantages. The residential environment includes natural environment, and education, culture, business and medical public facility environment. The Hedong area covered by the secondary ring of housing prices (4300-5200 yuan/m2) is located on the both sides of Hedong Avenue from Jianshe Road to Shuangyong Road. In this area, there are central park, university, large themed plaza, leisure and entertainment shopping center, municipal government, radio and television center, and other administrative departments. The Hexi area covered by the secondary ring of housing prices is located in the place where Shaoshan Road, Jianshe Road and Chezhan Road intersect and the surrounding regions. In this area and the surrounding regions, there are Yuhu Park, Heping Park, many schools such as Xiangtan Education College, many shopping centers, as well as the most famous hospital in Xiangtan City—Central Hospital. High housing prices (4300-5200 yuan/m2) appear on both sides of North Second Ring Road, in the east of Liancheng Avenue, and near Jiuhuahu De Cultural Park. In this area, there are Jiuhuahu De Cultural Park, Jiuhua Heping Elementary School, and BBK Commercial Complex. It is adjacent to the scenic belt along Xiangjiang River. Low housing price (3100-3800 yuan/m2) appears in the area from Jianshe Road to Shuangyong Road along the railway, because the trains on the railway bring much noise and do a great damage to human health.

Fig.2Normaldistributionofrawdata

Fig.3Normaldistributionafterlogprocessing

Fig.4Trendofcommercialhousingprices

Fig.5SpatialinterpolationresultscommercialhousingpricesinXiangtanCity
4.2RegionaldifferencesinhousingpricechangesandthedrivingfactorsXiangtan’s housing prices decreases from urban primary and secondary centers to the suburbs, but the housing price changes are not consistent in various directions. It decreases most rapidly in the Hedong main center-southwest direction; it decreases slowly in the main center-northwest, southeast direction; it decreases most slowly in the main center-northeast direction. The regional differences in Xiangtan’s housing price changes are mainly driven by the following two factors. (i) Traffic condition differences. From the road network structure of Xiangtan City, it is found that the east-west trunk roads are Hedong Avenue, Xiangtan Avenue and Shaoshan Road, and the south-north trunk roads are Jianshe Road and Shuangyong Road. Xiangtan’s high housing price areas are mainly concentrated on both sides of these trunk roads. For the regions in the west of Jianshe Road, there is no trunk road, and west, north and south are surrounded by Xiangjiang River, leading to poor transportation. The traffic condition differences in this region are an important cause of low housing prices in the region. (ii) Urban land layout differences. There are both positive and negative effects for different types of land in the city. Xiangtan Xiangjiang River Scenic Belt Construction Plan covers both sides of Xiangjiang River in Xiangtan City, from 50-100 m inner side of Riverside Avenue to the surface of the river, with the planning area of about 15 km2, and it aims to create ecological civilization corridor and cultural inheritance link reflecting Huxiang cultural characteristics. This is the main reason for slow reduction of housing prices from urban centers along Xiangjiang River. Xiangtan is an old industrial city, and affected by air pollution, noise and other factors, the industrial land is dense, and the housing prices are generally low.
5 Conclusions
This paper uses ArcGIS technology to study the spatial pattern of housing prices in Xiangtan City, and finds that the spatial pattern of housing prices shows primary and secondary two-center rings. In Hedong Jianshe Road and near Hexi Jijianying, there are primary and secondary polar nuclei, respectively; the secondary housing price area is located near the east-west and south-north trunk road in the urban area; there are significant regional differences in housing price changes (fastest reduction of prices in the Hedong main center-southwest direction; slow reduction of prices in the main center-northwest, southeast direction; slowest reduction of prices in the main center-northeast direction). In Hexi sub-center, except slow reduction of prices in the Xiangjiang River direction, the prices decline rapidly in other directions. The housing prices exhibit an obvious overall decreasing trend from primary and secondary centers to the suburbs, but there are also exceptions. On this basis, this paper analyzes the driving factors for spatial pattern of housing prices in Xiangtan City, and finds that the spatial pattern of housing prices is mainly influenced by commercial centers, residential environmental conditions, traffic conditions, and urban land layout differences.
[1] JIANG JJ, HUA XH, QIU WN,etal. Spatial distribution of the real estate prices based on ArcGIS [J]. Journal of Geomatics, 2014, 39(3): 27-30. (in Chinese).
[2] LIU Y, ZHANG PY, LI J. Spatial pattern of newly built housing’s price in Changchun City [J]. Scientia Geographica Sinica, 2011(1): 95-101. (in Chinese).
[3] MA ML, LV B, FENG CC. Study on space pattern of housing price of Beijing be based upon GIS [J]. Natural Resource Economics of China,2008, 21(12):26-28. (in Chinese).
[4] WANG X, ZHU DL. The application of geostatistics in the study on spatial distribution discipline of metropolitan house prices—A case study of Beijing [J]. China Soft Science, 2004(8):152-155. (in Chinese).
[5] XU XH. An analysis on the spatial distribution characters of commercial residence price in Shanghai [J]. Economic Geography,1997,17(1): 80-87. (in Chinese).
[6] ZHOU CS, LUO Y. On the spacial distribution of real estate price in Guangzhou in recent 10 years and its influence [J]. City Planning Review, 2004, 28(3): 52-56. (in Chinese).
[7] ZHOU M, ZHEN F. The spatial distribution of commodity housing and price in Nanjing based on the spatial analysis [J]. Urban Research,2008,23(7):47-53. (in Chinese).
[8] MEI ZX, HUANG L. Spatial autocorrelation analysis of housing prices distribution:A case study of Dongguan [J]. China Land Science, 2008, 22(2): 49-54. (in Chinese).
杂志排行
Asian Agricultural Research的其它文章
- Empirical Study on the Relationship between Organizational Flexibility and Performance of Agricultural Enterprise
- Correlation between Employment Quality and Skill Training of Land-expropriated Farmers
- Design and Experiment of Fluid Dynamic Ultrasonic Water Aerator
- The Relation between Age Structure of Population and Resident Consumption Based on Endogenous Growth Theory
- Effect of Different Pretreatments on Explosion Puffing Drying of Hami Melon at Modified Temperature and Pressure in Xinjiang
- Design and Implementation of National Meteorological Service Platform
