Spatial Structure of Tourism Resources in Liaoning Province
2016-01-12,
,
School of Business Administration, University of Science and Technology Liaoning, Anshan 114051, China
1 Introduction
Spatial structure of tourism resources refers to the combination relationship between distribution, quality, and quantity of tourism resources in a region. It can directly bring about spatial behavior of tourists, and also plays an essential role in development speed, scale, benefits and temporal and spatial arrangement of tourism resources, thus it is of great significance to studying the spatial structure of tourism resources. At present, researches about spatial structure of tourism resources focus on evaluation of abundance of tourism resources at national level. For example, Huang Chenglin selected absolute quantity, per capita density, and per area density of 6 types of tourism resources, using the sequence scoring method, made a quantitative evaluation of major tourism resources[1]; Li Jinglong made a quantitative evaluation and grade division of tourism resources in provinces of China through selecting 19 major types of tourism resources[2]. Besides, Xu Xiantangetal., Hou Xiaofei and Shao Xiuyun[4]studied spatial structure characteristics of tourism resources in Hubei Province and Shanxi Province. These studies provide new ideas for spatial structure of regional tourism resources, but they lack analysis about combination and relatively superior resources of regional tourism resources. Therefore, taking 14 prefecture level cities of Liaoning Province as research objects, we make a quantitative study on overall characteristics of spatial structure of tourism resources in cities of Liaoning Province.
In Liaoning Province, there are many objects of tourism resources. At present, there are 547 objects of tourism resources. According toClassification,InvestigationandEvaluationofTourismResources(GB/TI8972-2003), there are 8 main types, 31 sub-types, and 155 fundamental types. In Liaoning Province, there are 8 main types, 31 sub-types, and 155 fundamental types. In other words, Liaoning Province has all of types specified in GB/TI8972-2003, accounting for 100%, 100% and 100% respectively. Since the scenic spots are numerous, we only make analysis of 4A and above scenic spots with point type distribution at the macro level. In this way, there are 51 objects of tourism resources, and the regional area is 148000 km2.
2 Analysis on abundance of tourism resources
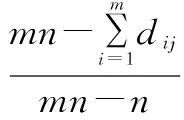
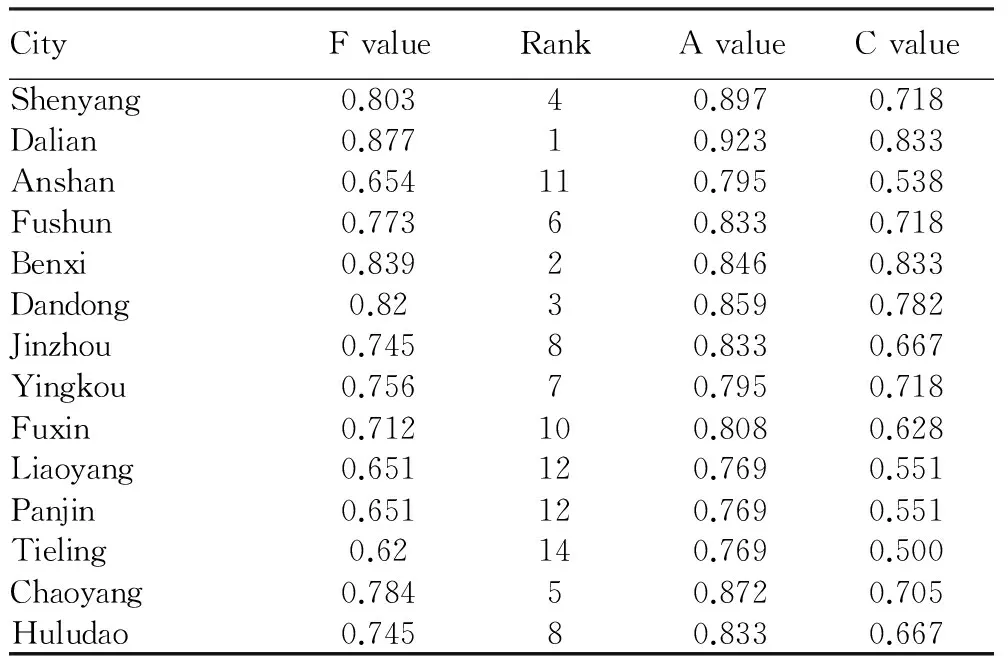
Using the sequence scoring method, we calculate absolute abundance index (A), relative abundance index (C) and total abundance (F) of tourism resources in city level of Liaoning Province. Values of A, C and F are listed in Table 1.
The calculation formula is as follows:

From Table 1, we can see that Dalian, Benxi, Dandong, and Shenyang cities have higher total abundance of tourism resources, while Liaoning, Panjin and Tieling have lower total abundance of tourism resources. The advantages of Liaoning Province in abundance of tourism resources are concentrated in southern, central and eastern regions, where there are many types of tourism resources and the abundance of tourism resources is high, favorable for organizing high density tourism industry, and forming fully developed tourism economic belt and tourism economic zones.
3 Measurement of spatial distribution types of tourism resources
With reference to researches of Wu Bihu and Tang Ziying[5]and Bian Xianhongetal.[ 6], we measured overall spatial distribution of tourism resources of fifty one 4A and above level scenic spots in 14 cities of Liaoning Province by the shortest distance formula.

Table1TotalabundanceoftourismresourcesincitiesofLiaoningProvince
CityFvalueRankAvalueCvalueShenyang0.80340.8970.718Dalian0.87710.9230.833Anshan0.654110.7950.538Fushun0.77360.8330.718Benxi0.83920.8460.833Dandong0.8230.8590.782Jinzhou0.74580.8330.667Yingkou0.75670.7950.718Fuxin0.712100.8080.628Liaoyang0.651120.7690.551Panjin0.651120.7690.551Tieling0.62140.7690.500Chaoyang0.78450.8720.705Huludao0.74580.8330.667


4 Analysis on balance of spatial distribution of tourism resources
4.1ConcentrationdegreeofthedistributionofscenicspotsThe geographical concentration index is an essential indicator measuring the concentration degree of research object. In this study, we use the geographical concentration index to measure the spatial distribution of resource type scenic spots in prefecture-level cities of Liaoning Province. The formula is as follows:
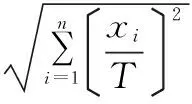
where G refers to geographical concentration index of a scenic spot,Xisignifies the number of scenic spots in the prefecture level cityi, T is the total of scenic spots (51 in this study), andnis the number of prefecture-level cities (14 in this study). G values are within the range of 0-100, the higher the G value, the more concentrated distribution scenic spots; the lower the G value, the more scattered distribution of scenic spots. Through calculation, the geographical concentration index of 4A level resource type scenic spots is 51.361. From the perspective of the city level, the distribution of resource type scenic spots is relatively concentrated.
4.2ThedegreeofbalanceindistributionofscenicspotsIn geography, Gini coefficient is an important indicator for studying spatial distribution of discrete regions. It is used for comparison of differences between different research objects, to find out rules of changes in regional distribution. In this study, we use Gini coefficient to measure the spatial distribution of resource type scenic spots in main geographical regions of the whole province. The calculation formula for Gini coefficient is as follows:

wherePisignifies the proportion of the scenic spots in prefecture-level cityito total scenic spots in the whole province, N is number of regions, and C is the uniformity of distribution. Gini coefficient remains in the range of 0 to 1, and the higher Gini coefficient means the higher concentration degree. We carry out Gini coefficient analysis on national level 4A grade scenic spots in 14 cities of Liaoning Province, to evaluate the distribution of scenic spots in Liaoning Province.
Through calculation,H= 0.9264,Hm= 1.1461,Gini= 0.8083, andC= 0.1917, thusGinicoefficient is 0.8083, and the distribution uniformity C is 0.191687. Results indicate that national level 4A grade scenic spots of Liaoning Province takes on concentrated distribution, and the distribution uniformity is relatively low. Researches of Wu Bihu and Tang Ziying[5]indicate that Gini coefficient for 8 geographical regions of the first national level 4A grade scenic spots in central China is 0.8561, and the distribution uniformity is 0.1439; researches of Bian Xianhong show that Gini coefficient of national level 4A grade scenic spots in the Changjiang Delta is 0.8442, and the distribution uniformity is 0.1558[6]; researches of Wang Heng indicate that Gini coefficient for spatial structure of tourism system of Dalian City is 0.7985, and the distribution uniformity is 0.2015[7]. Comparison indicates that the concentrated distribution degree of scenic spots in Liaoning Province is relatively low, but still takes on concentrated distribution, and scenic spots are mainly distributed in Shenyang and Dalian.
Table2Comparisonofconcentrateddistributionanduniformdistributionof4AgradescenicspotsinLiaoningProvince
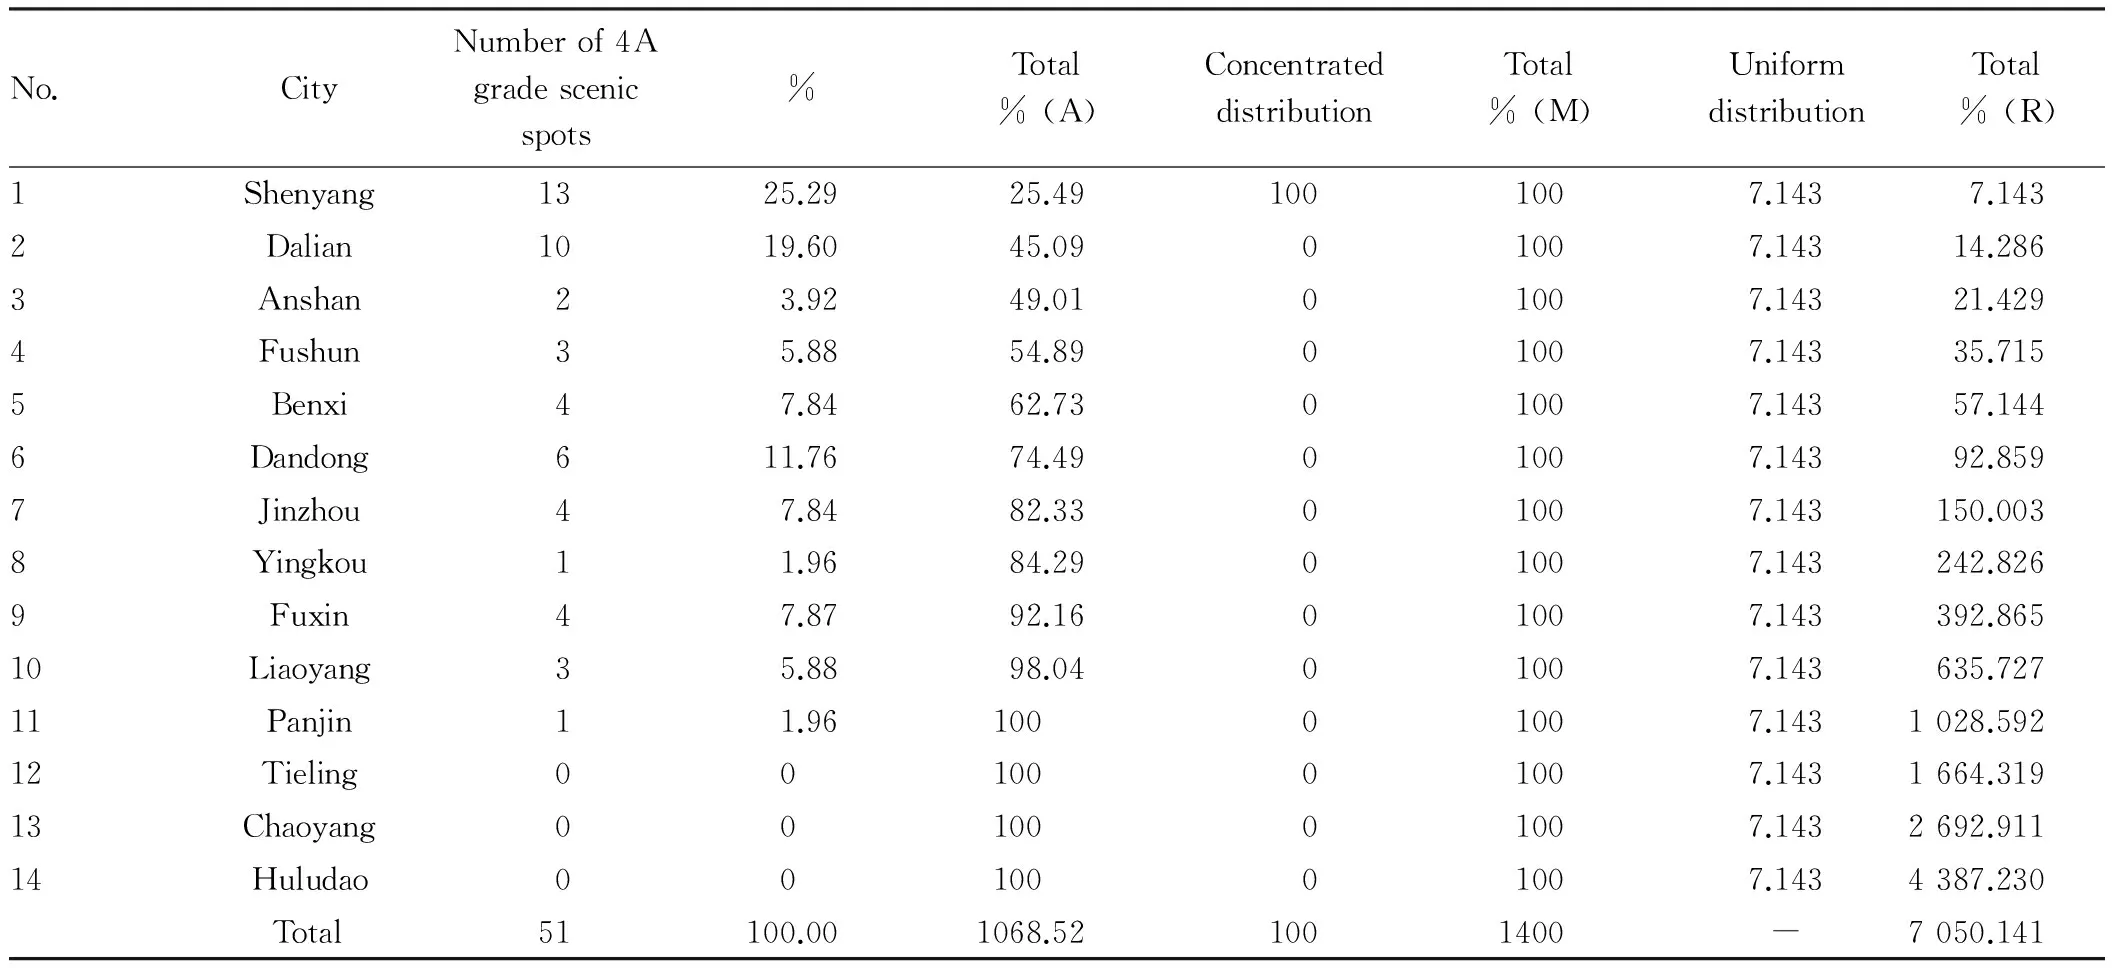
No.CityNumberof4Agradescenicspots%Total%(A)ConcentrateddistributionTotal%(M)UniformdistributionTotal%(R)1Shenyang1325.2925.491001007.1437.1432Dalian1019.6045.0901007.14314.2863Anshan23.9249.0101007.14321.4294Fushun35.8854.8901007.14335.7155Benxi47.8462.7301007.14357.1446Dandong611.7674.4901007.14392.8597Jinzhou47.8482.3301007.143150.0038Yingkou11.9684.2901007.143242.8269Fuxin47.8792.1601007.143392.86510Liaoyang35.8898.0401007.143635.72711Panjin11.9610001007.1431028.59212Tieling0010001007.1431664.31913Chaoyang0010001007.1432692.91114Huludao0010001007.1434387.230Total51100.001068.521001400-7050.141
5 Conclusions
From the above analysis, we arrive at the following conclusions: (i) Spatial distribution of resource type scenic spots is agglomerative, and the closest point indexR=0.765<1. (ii) The distribution of scenic spots in 14 prefecture-level cities of Liaoning Province is relatively concentrated, and the balance degree is relatively low; the geographical concentration index of fifty one 4A grade resource type scenic spots G = 51.361. (iii) Resource type scenic spots take on concentrated distribution in 14 prefecture-level cities of Liaoning Province, and the distribution uniformity is relatively low, while Gini coefficient is up to 0.80836. (iv) Shenyang, Dalian, and Dandong cities have higher density of distribution of resource type scenic spots.
[1] HUANG CL. Provincial comparison on the main tourism resources in mainland China[J].Journal of Anhui Normal University(Humanities and Social Sciences), 2001,29(1):135-137.(in Chinese).
[2] LI JL, ZHENG SJ. Spatial distribution of brand tourism resources in China[J].Resources Science,2006,28(1):174-179.(in Chinese).
[3] XU XT, HU J, CHEN TT. A comprehensive evaluation on spatial variation of traveling resources gift in Hubei Province[J].Statistics & Decision,2015(5):107-110.(in Chinese).
[4] HOU XF, SHAO XY. The spatial distribution of ancient villages and the inspiration for the development and protection of tourism in Shanxi Province[J].Journal of Shanxi Teachers University,2014,(4):112-115.(in Chinese).
[5] WU BH, TANG ZY. A study on spatial structure of national 4a grade tourism attractions in China[J].Human Geography,2003,18(1):1-5.(in Chinese).
[6] BIAN XH. Research on spatial configuration of national grading-AAAA tourist districts in the Yangtze River Delta[J] .Economic Geography,2007,27(1):157-160.(in Chinese).
[7] WANG H, LI YZ. A study on spatial structure of scenic areas in Dalian City and its optimization[J].Areal Research and Development,2010,29(1):84-89.(in Chinese).
杂志排行
Asian Agricultural Research的其它文章
- Economic Analysis on the Rational Allocation of Agricultural Production Factors in Henan Province
- Special Space and Plant Landscape Design of Urban Ecological Buildings
- Main Methods Applied in Fertigation Technology
- A Study on the Ultrasonic Extraction and Antioxidant Activity of Lychee Pericarp Polysaccharides
- The Fishery Industrial Structure in China Based on the Application of Shift-Share Analysis
- Analysis on Technical Efficiency and Influencing Factors of Rapeseed Production
