Measurement on the Harmony Coefficient of Agro-eco-economic System in the Arid Region
2016-01-12,
,
School of Economics, Beifang University of Nationalities, Ningxia 750021, China
1 Introduction
Agriculture has long been regarded as a strategic industry for people, and the construction of ecological environment is also fundamental to the sustainable economic development in arid inland areas. However, in these areas, the agricultural production pattern is backward, there are extreme water shortages, and the mode of farming is extensive, which has led to increasingly intensified soil erosion, desertification and resource depletion. Agro-eco-economic system is a complex ecosystem integrating society, economy and nature, and how to handle the relationship between agricultural economic development and environmental protection is an issue to be urgently studied and solved for sustainable development in the water scarcity areas. With Ziyang District of Yiyang City, Wuhu City, Xinxing County and Guanzhong Area as the empirical study areas, some scholars have done relevant systematic measurement[1-4]. But so far, few studies have been reported about the middle reaches of Heihe River in the northwest inland arid region. This region has developed oasis agriculture, but the ecological environment is fragile, water resources are scarce, and agricultural water accounts for more than 85%. The irrigation water use efficiency is only 44.55%, well below the level of 70%-80% in some countries which efficiently use water[5]. In view of this, with the middle reaches of Heihe River as the typical study area, this paper builds the evaluation function model, and considers regional feature to select the evaluation indicator system for measurement on rank of harmony coefficient of agro-eco-economic system, in order to provide a scientific basis and theoretical reference for making strategy about coordinated development of agro-eco-economic system in the arid inland region.
2 Study area and data sources
2.1StudyareaThe regions in the middle reaches of Heihe River include Shandan County, Minle County, Ganzhou District, Linze County, Gaotai County and Sunan County in Zhangye City of Gansu Province, having 95% of arable land, 91% of population and 89% of GDP in the whole basin. They are the main irrigated agricultural areas, and also the main water use areas in the Heihe River valley[6]. Thus, this paper takes Minle County and Linze County in the middle reaches of Heihe River as the typical study areas. Minle County is located in the southeast of Zhangye City, with an elevation of 1589-5027 m. The annual average total amount of water resources is 439 million m3, the average rainfall is 89-293 mm, and the average evaporation is 1638.4 mm. It features a temperate continental desert and steppe climate, with scarce rainfall and strong evaporation. The total area of arable land is 62500 ha, and the irrigated land accounts for more than 60%. It is a typical oasis irrigated agricultural area. It now has jurisdiction over 6 towns, 4 townships, and 1 eco-industrial park. The permanent population is 0.2422 million, and the agricultural population is 0.188 million. Linze County is located in the central plains region of Gansu Corridor, with an altitude of 1380-2278 m. The annual average total amount of water resources is 1.382 billion m3, the average annual rainfall is 108.4 mm, and the average evaporation is 1830.4 mm. It also has a typical continental desert and steppe climate characterized by dry climate, rare rainfall and strong evaporation. The region is dominated by flat oasis plain with fertile soil, and it is an irrigated agricultural area with a long history, and now the arable land area is 19000 ha. It has jurisdiction over 5 towns and 2 townships, with a total population of 0.148 million.
2.2DatasourcesThe rural socio-economic statistics are fromStatisticalYearbookofMinleCounty,StatisticalYearbookofLinzeCounty, relevant statistical data of local bureau of water resources, field survey data, and questionnaire survey data.
3 Building of evaluation model and selection of evaluation indicators
3.1BuildingofevaluationmodelBased on the evaluation theory system for the agricultural ecological harmony coefficient presented by Yang Shiqi[1], this paper builds the evaluation model system for harmony coefficient, including efficacy function, function of harmony coefficient, interval of harmony coefficient, and rank of harmony coefficient.
3.1.1Efficacy function. Typically, according to the different influence of indicator efficacy on system harmony coefficient, the efficacy function can be divided into positive and negative efficacy function[7-8].
WhenEC(χij) has positive efficacy, the system harmony coefficient will increase with increase ofχij.
(1)
WhenEC(χij) has negative efficacy, the system harmony coefficient will decrease with increase ofχij.
(2)
In the above formula,EC(χij) is the efficacy coefficient of evaluation indicators, with range of 0 ≤EC(χij)≤ 1. WhenEC(χij) = 0, the objective is the worst; whenEC(χij) =1, the objective is most satisfactory.iis the subsystem subscript;jis the subsystem evaluation indicator subscript;αijandβijare the maximum and minimum value of evaluation indicators, respectively.
3.1.2Function of harmony coefficient. The system is usually a complex multi-index system, and the single efficacy coefficient is not sufficient to indicate the coordination status of system, so there is a need to establish the function with index efficacy coefficient as the independent variable to evaluate the overall coordination level of system. This function is function of harmony coefficient (FHC), and its value is harmony coefficient (HC). The basic model of function of harmony coefficient is as follows:
(3)

(4)
Harmony coefficient (HC) is an important basis for assessing the calculation results and judging the system coordination, and its range is[0, 1]. Based on the actual situation of the study area, this paper also considers the case ofHC<0, and regards it as the extreme system imbalance.
3.1.3Rank of harmony coefficient. Currently, there is no uniform classification standard for the harmony coefficient about agro-eco-economic system. Based on the connotation of coefficient of variation, this paper draws on the existing research results on harmony coefficient division interval[3-4], and each interval represents a level, to finally form a continuous rank of harmony coefficient. The classification is shown in Table 1.
Table1Classificationofharmonycoefficientandrankofharmonycoefficient
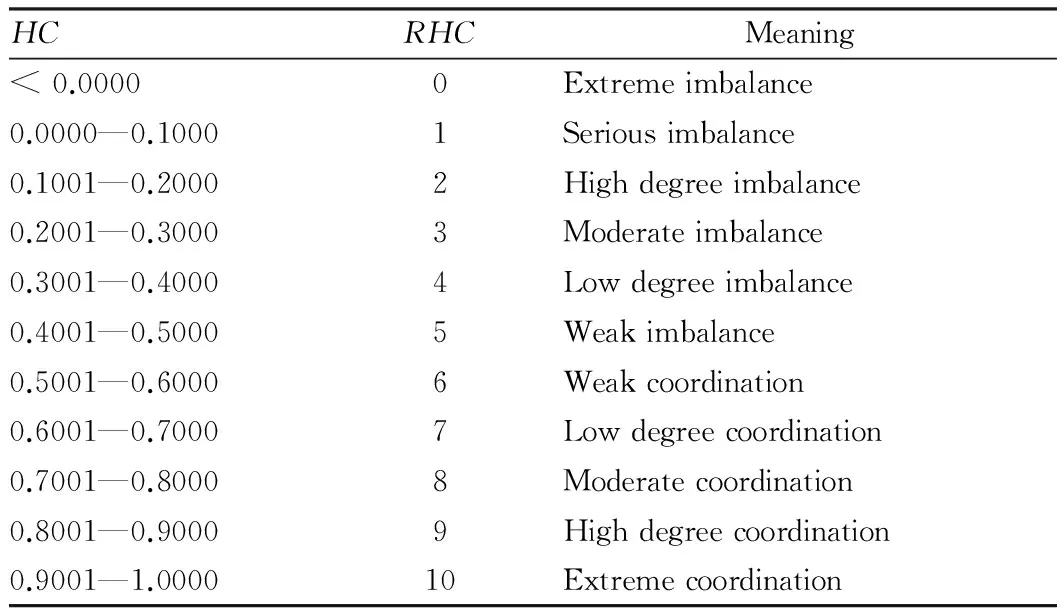
HCRHCMeaning<0.00000Extremeimbalance0.0000—0.10001Seriousimbalance0.1001—0.20002Highdegreeimbalance0.2001—0.30003Moderateimbalance0.3001—0.40004Lowdegreeimbalance0.4001—0.50005Weakimbalance0.5001—0.60006Weakcoordination0.6001—0.70007Lowdegreecoordination0.7001—0.80008Moderatecoordination0.8001—0.90009Highdegreecoordination0.9001—1.000010Extremecoordination
Table2Theevaluationindicatorsystemforharmonycoefficientofagro-eco-economicsystem
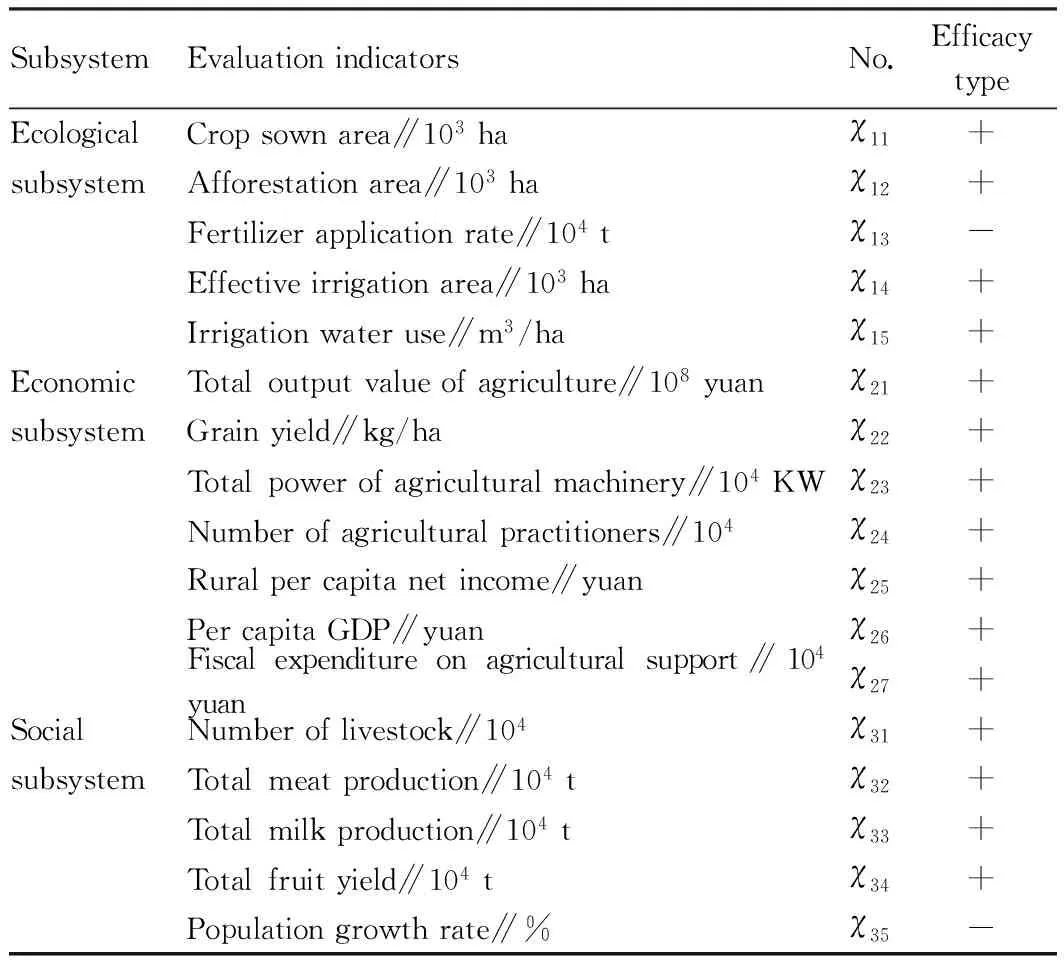
SubsystemEvaluationindicatorsNo.EfficacytypeEcologicalCropsownarea∥103haχ11+subsystemAfforestationarea∥103haχ12+Fertilizerapplicationrate∥104tχ13-Effectiveirrigationarea∥103haχ14+Irrigationwateruse∥m3/haχ15+EconomicTotaloutputvalueofagriculture∥108yuanχ21+subsystemGrainyield∥kg/haχ22+Totalpowerofagriculturalmachinery∥104KWχ23+Numberofagriculturalpractitioners∥104χ24+Ruralpercapitanetincome∥yuanχ25+PercapitaGDP∥yuanχ26+Fiscalexpenditureonagriculturalsupport∥104yuanχ27+SocialNumberoflivestock∥104χ31+subsystemTotalmeatproduction∥104tχ32+Totalmilkproduction∥104tχ33+Totalfruityield∥104tχ34+Populationgrowthrate∥%χ35-
3.2SelectionofevaluationindicatorsAs mentioned above, agro-eco-economic system is a complex system involving ecology, economy and society. Based on the indicator selection by Yang Shiqi (2008) and Niu Yuanyuan (2010), combined with the actual level of agricultural economic development in the study area, this paper takes into account indicator accessibility, and establishes the following evaluation indicator system for the coordinated development of agro-eco-economic system (Table 2).
4 Empirical analysis
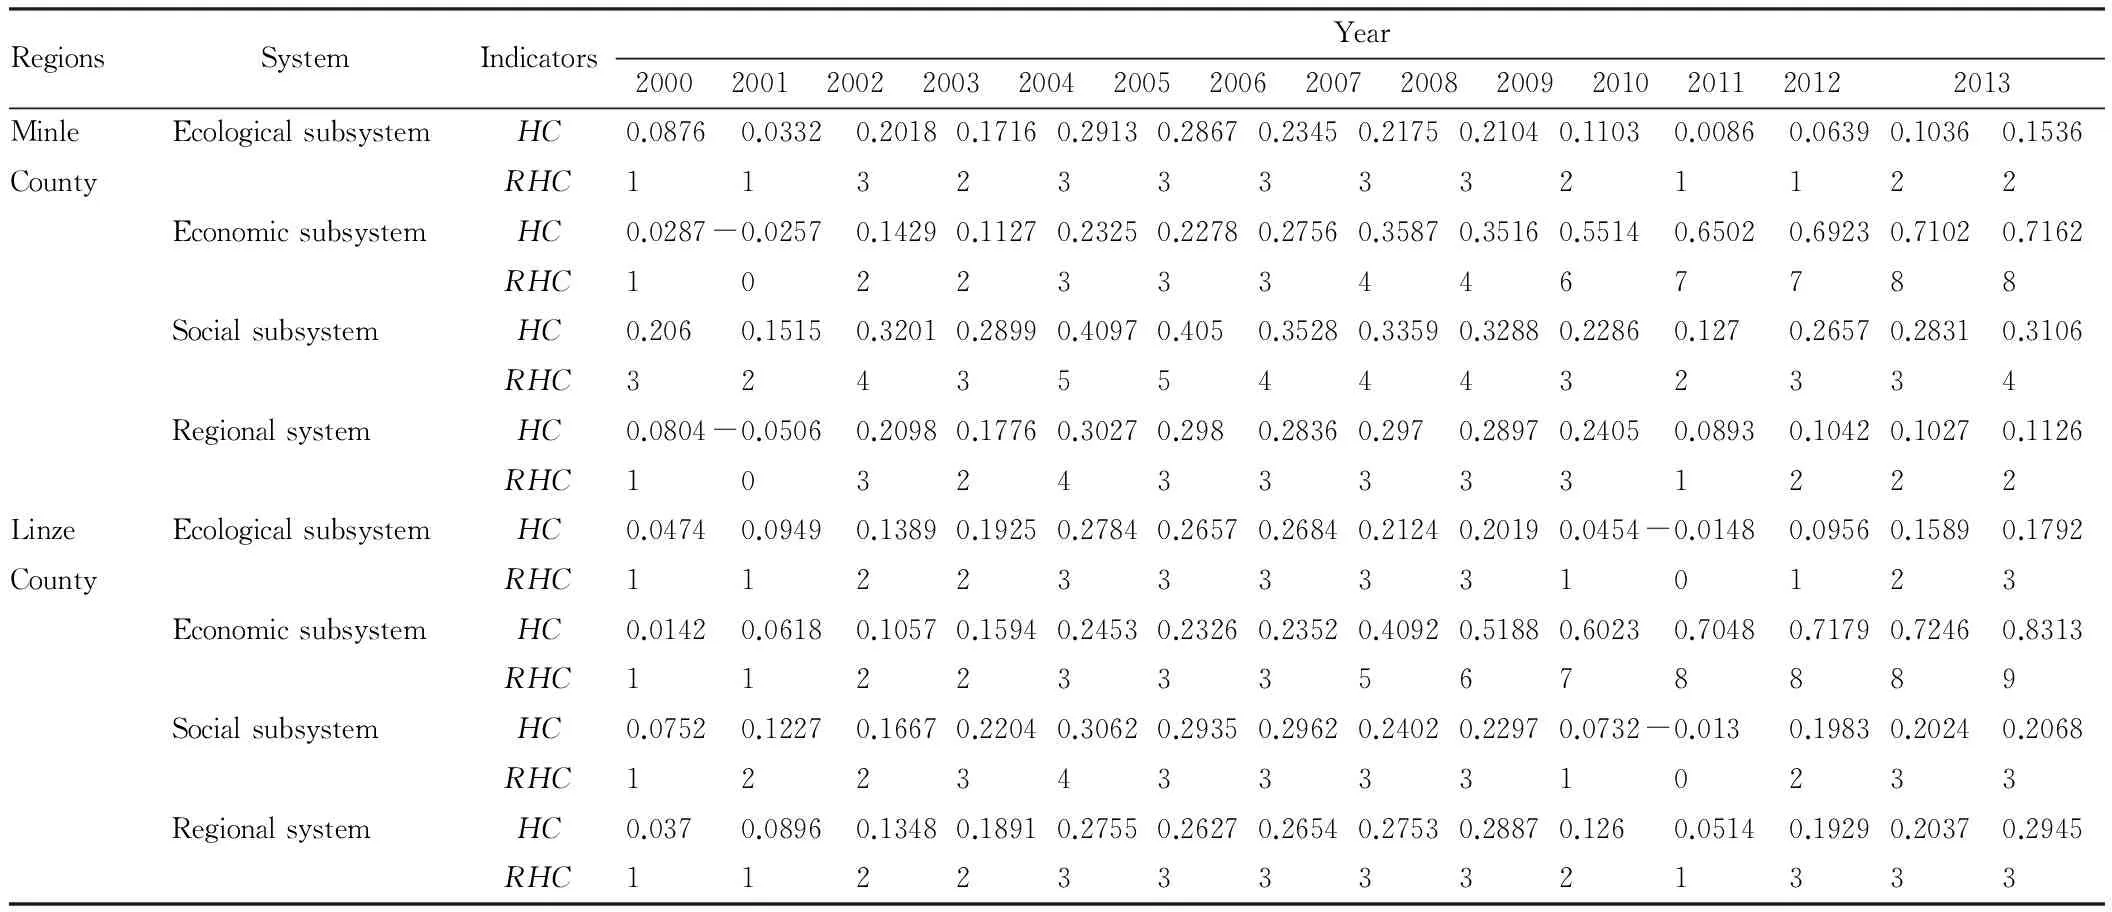
Based on the evaluation indicator system, we use formula (1), (2) and (3) to calculate the efficacy coefficient, harmony coefficient and rank of harmony coefficient about agro-eco-economic system in Minle County and Linze County during 2000-2010, respectively (Table 3-5). In calculating the efficacy coefficient, in order to avoid the coefficient of 0 and 1, we properly adjust the extreme value with reference to the approach of Yang Shiqietal. (2006). We amplify the maximum value by 1% and reduce the minimum value by 1%, so that the efficacy coefficient of extreme value tends to 0 and 1. Based on the tables and figures concerning harmony coefficient and rank of harmony coefficient of agro-eco-economic system, it can be found that the harmony coefficient of agro-eco-economic system in the study area is in a state of serious imbalance on the whole, showing a trend from rise to fall. The regional harmony coefficient of Minle County rose from 0.0804 in 2000 to 0.3027 in 2004, and then went through a fluctuating decline. It dropped to 0.0893 in 2010, and it rose slightly compared with the early study period, but they were generally at the same level. The harmony coefficient level also experienced the process of "serious imbalance—extreme imbalance— moderate imbalance—low degree imbalance—serious imbalance". As can be seen from Fig. 1, the harmony coefficient level declined from serious imbalance in 2000 to extreme imbalance in 2001; the harmony coefficient peaked to 0.3027 in 2004, and the harmony coefficient level increased to a certain extent, but it was still the low degree imbalance; subsequently, it dropped to the state of moderate imbalance, and finally reverted to the serious imbalance level in the early study period. This is mainly due to the decreasing or constant afforestation area, irrigation water use and effective irrigation area in ecological subsystem having positive efficacy for the regional system. It was improved slightly in 2003, but it was still in a state of high degree imbalance. Similarly, the regional harmony coefficient of agro-eco-economic system in Linze County also showed a similar trend like in Minle County. Its harmony coefficient peaked to 0.2887 in 2008, less than the maximum harmony coefficient of Minle County, and its harmony coefficient level (moderate imbalance) was also lower than the level in Minle County when the harmony coefficient was maximal. In 2013, the harmony coefficient dropped to 0.2945, but it rose greatly compared with 0.037 in 2000, and it was at the moderate imbalance level, which was related to the "eco-city" strategy promoted by the local government. The regional agro-eco-economic system showed a gradual improvement trend, which was further illustrated by Fig. 1. The agro-eco-economic system is a complex system constituted by a plurality of variables, so its coordination degree is also related to the coordination degree of other subsystems. In terms of the ecological subsystem, it shows imbalance state in Minle County and Linze County. The harmony coefficient of ecological subsystem in Minle County and Linze County reaches the highest level of III (moderate imbalance); the harmony coefficient of ecological subsystem in Minle County rose from 0.0876 in 2000 to 0.1536 in 2013, and the harmony coefficient level also increased to II, namely high degree imbalance; the rank of harmony coefficient of ecological subsystem in Linze County rose from I to III, going from serious imbalance to moderate imbalance, mainly because of increase in afforestation area and effective irrigation area having positive effect on agricultural subsystem and decline in the fertilizer application rate. At the same time, the economic subsystem in the two counties showed a growing trend. Fig. 2 shows that the harmony coefficient of economic subsystem in Minle County increased from 0.0287 in 2000 to 0.7162 in 2013, and the rank of harmony coefficient also rose from I to VIII, indicating that the state of economic subsystem was optimized from original serious imbalance to moderate coordination. However, in 2001, the values of some indicators with positive efficacy (such as total output value of agriculture, grain yield, total power of agricultural machinery, number of agricultural practitioners and rural per capita net income) in Minle County decreased compared with the previous year, and the rank of harmony coefficient declined from I to 0, showing extreme imbalance. Similarly, the harmony coefficient of economic subsystem in Linze County increased from 0.0142 in 2000 to 0.8313 in 2013, and the rank of harmony coefficient also rose from I to IX, achieving the shift from serious imbalance to high degree coordination, primarily because Heihe River runs through Linze County and the farmland irrigation convenience is much higher than in Minle County. Fig. 2 further shows this trend. The constantly optimized economic subsystem in the two counties is related the increase in the value of some indicators having a positive effect on the system coordination, such as total output value of agriculture, total power of agricultural machinery, rural per capita net income, per capita GDP and fiscal expenditure on agricultural support. In addition, the social subsystem of the two counties shows a state of imbalance. However, the harmony coefficient of social subsystem in Minle County is slightly higher than in Linze County. The harmony coefficient of social subsystem in Linze County decreased to -0.013 in 2010, reaching a state of extreme imbalance, due to fast-growing population having negative efficacy and declining fruit yield with positive efficacy. With the decrease in the value of negative efficacy indicators and slight increase in the value of positive efficacy indicators, the rank of harmony coefficient of social subsystem in Linze County rose to III in 2013. Thus, the market orientation and optimization of industrial structure are also important factors that affect rural social development. Overall, the harmony coefficient of economic subsystem in the two counties exhibits an optimizing trend, while the ecological subsystem and social subsystem are uncoordinated, which affects the overall coordination of regional agro-eco-economic system. The foregoing analysis shows that agro-eco-economic system contains many elements; the ecological subsystem and social subsystem inhibit the harmony coefficient of agro-eco-economic system in Minle County and Linze County; economic subsystem plays a role in promoting harmony coefficient of agro-eco-economic system in Minle County and Linze County. Only when the three subsystems are in a state of harmony can the regional agricultural economy achieve coordinated development.
Table3Theefficacycoefficientoftheevaluationindicatorsforagro-eco-economicsysteminMinleCounty

SubsystemIndicatorsYear20002001200220032004200520062007200820092010201120122013EcologicalCropsownarea∥103ha0.08930.13800.18990.07470.63150.46590.64610.65750.70130.86530.90260.83100.91900.8123subsystemAfforestationare∥103ha0.13410.16000.42190.98970.35010.06050.05140.03180.07710.09060.00010.28260.25310.2123Fertilizerapplicationrate∥104t0.95810.75930.72460.61560.45560.44000.35840.25190.22680.05390.04790.12150.21580.0661Effectiveirrigationarea∥103ha0.32890.33020.27920.27920.27920.71230.71230.71230.71230.71230.71230.96410.81340.9236Irrigationwateruse∥m3/ha0.58700.06110.59740.65670.67580.87630.86420.97510.66700.65830.01540.36310.36810.3734EconomicTotaloutputvalueofagriculture∥108yuan0.10150.00600.12850.17210.32060.39630.42540.59150.67460.81680.98400.83920.93210.8306subsystemGrainyield∥kg/ha0.58570.00770.21690.35920.43350.57110.58240.68200.73030.83550.98250.23140.32540.3687Totalpowerofagriculturalmachinery∥104KW0.02870.02240.07200.18380.23760.33890.37740.49060.64430.81830.96860.72430.79430.8864Numberofagriculturalpractitioners∥1040.44120.32350.70590.70590.26470.32350.38240.35290.29410.50000.55880.04130.03580.0314Ruralpercapitanetincome∥yuan0.07200.01080.09430.15680.25610.33970.41250.48240.61690.79230.97970.38420.47530.5659PercapitaGDP∥yuan0.00510.02210.07600.11850.21900.22870.31650.45620.59840.73080.98510.97160.80850.9658Fiscalexpenditureonagriculturalsupport∥104yuan0.00020.00630.00510.04830.02190.04650.08110.28030.54320.87050.98990.81530.92490.9345SocialNumberoflivestock∥1040.13580.16230.46690.58520.70960.82350.89140.96940.01960.10000.14570.81820.87460.8176subsystemTotalmeatproduction∥104t0.01540.08580.28770.45380.58310.77140.93720.99110.56310.69940.80000.07730.15540.2331Totalmilkproduction∥104t0.00200.03160.34620.39140.52020.59840.64110.65700.94890.97070.77600.69620.78830.8764Totalfruityield∥104t0.00050.02830.87630.80570.57010.93060.99090.64910.90640.96440.91410.42230.49860.5762Populationgrowthrate∥%0.76140.00770.80460.71960.90360.57770.42190.35070.52440.48490.68030.66120.65630.6514
Table4Theefficacycoefficientoftheevaluationindicatorsforagro-eco-economicsysteminLinzeCounty
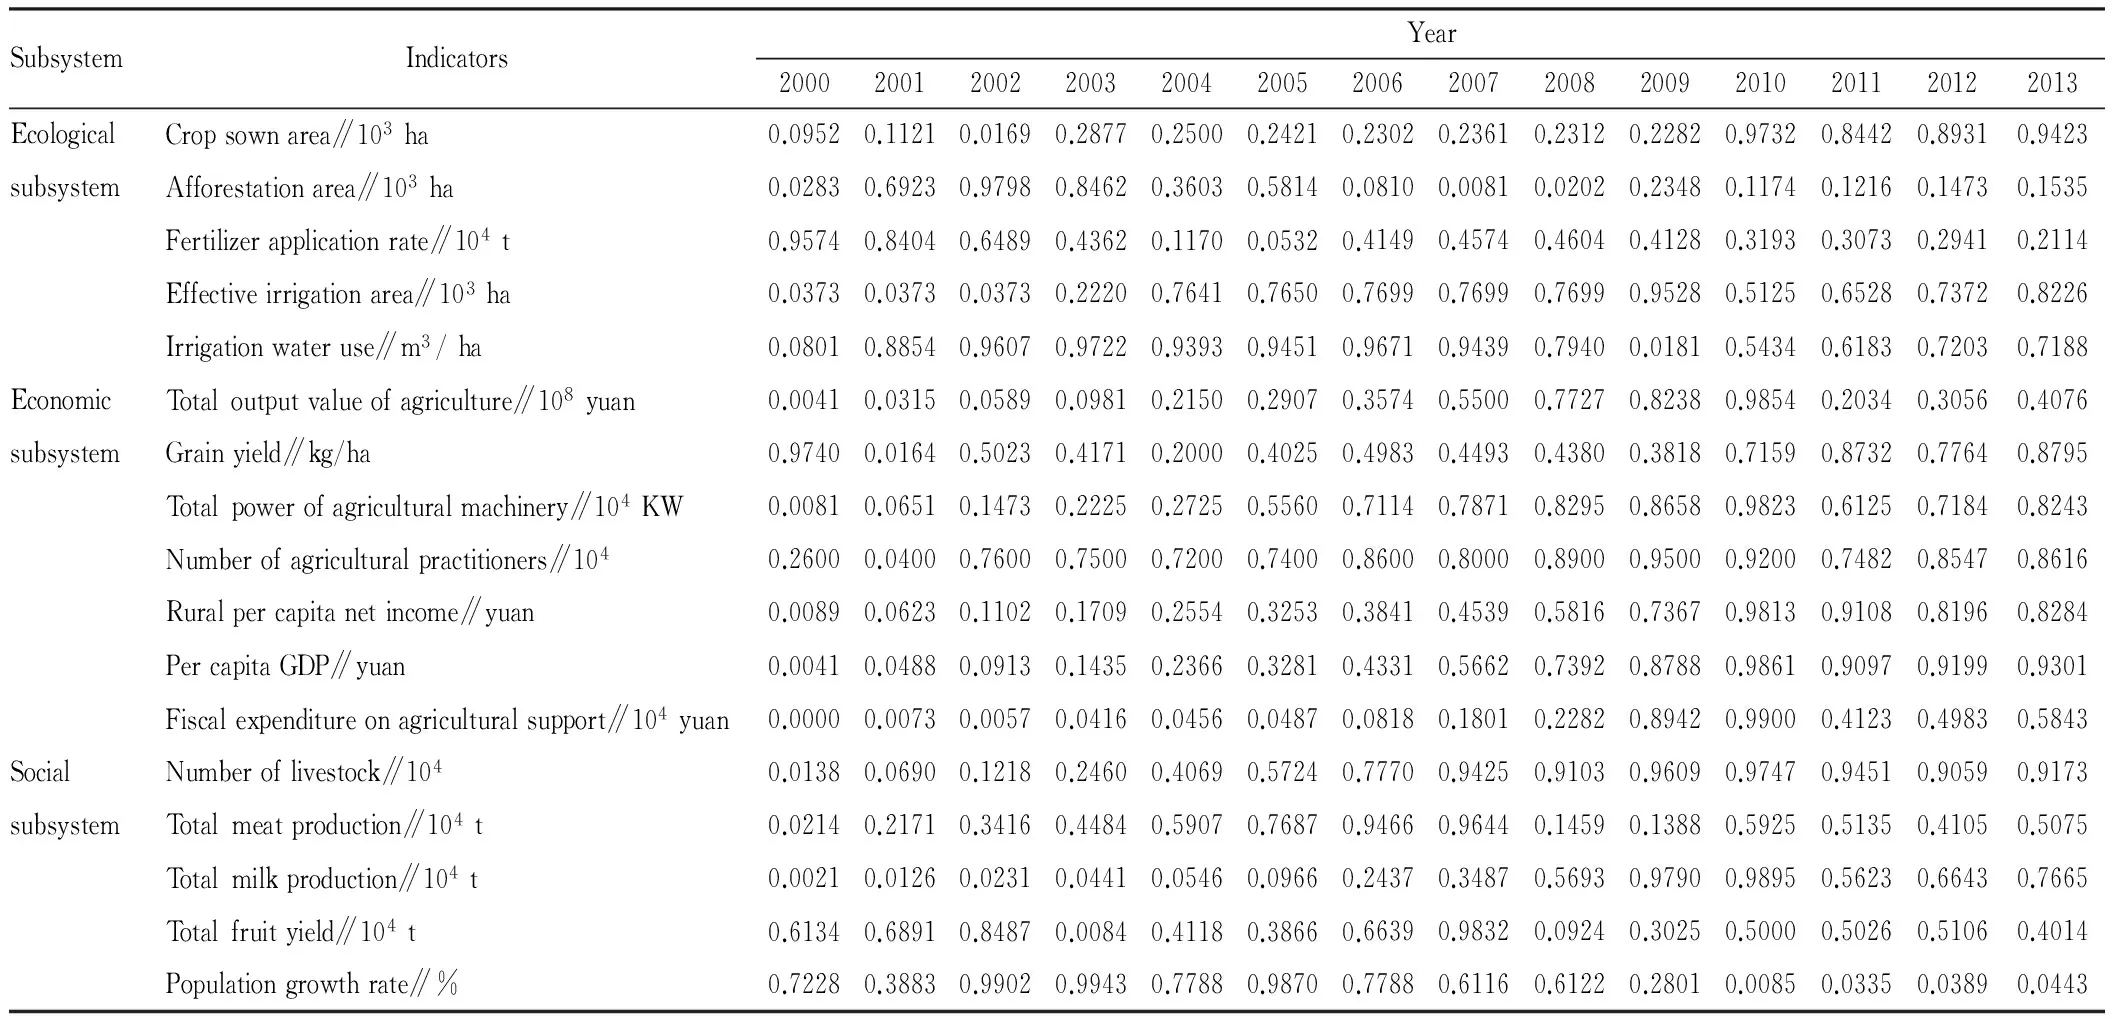
SubsystemIndicatorsYear20002001200220032004200520062007200820092010201120122013EcologicalCropsownarea∥103ha0.09520.11210.01690.28770.25000.24210.23020.23610.23120.22820.97320.84420.89310.9423subsystemAfforestationarea∥103ha0.02830.69230.97980.84620.36030.58140.08100.00810.02020.23480.11740.12160.14730.1535Fertilizerapplicationrate∥104t0.95740.84040.64890.43620.11700.05320.41490.45740.46040.41280.31930.30730.29410.2114Effectiveirrigationarea∥103ha0.03730.03730.03730.22200.76410.76500.76990.76990.76990.95280.51250.65280.73720.8226Irrigationwateruse∥m3/ha0.08010.88540.96070.97220.93930.94510.96710.94390.79400.01810.54340.61830.72030.7188EconomicTotaloutputvalueofagriculture∥108yuan0.00410.03150.05890.09810.21500.29070.35740.55000.77270.82380.98540.20340.30560.4076subsystemGrainyield∥kg/ha0.97400.01640.50230.41710.20000.40250.49830.44930.43800.38180.71590.87320.77640.8795Totalpowerofagriculturalmachinery∥104KW0.00810.06510.14730.22250.27250.55600.71140.78710.82950.86580.98230.61250.71840.8243Numberofagriculturalpractitioners∥1040.26000.04000.76000.75000.72000.74000.86000.80000.89000.95000.92000.74820.85470.8616Ruralpercapitanetincome∥yuan0.00890.06230.11020.17090.25540.32530.38410.45390.58160.73670.98130.91080.81960.8284PercapitaGDP∥yuan0.00410.04880.09130.14350.23660.32810.43310.56620.73920.87880.98610.90970.91990.9301Fiscalexpenditureonagriculturalsupport∥104yuan0.00000.00730.00570.04160.04560.04870.08180.18010.22820.89420.99000.41230.49830.5843SocialNumberoflivestock∥1040.01380.06900.12180.24600.40690.57240.77700.94250.91030.96090.97470.94510.90590.9173subsystemTotalmeatproduction∥104t0.02140.21710.34160.44840.59070.76870.94660.96440.14590.13880.59250.51350.41050.5075Totalmilkproduction∥104t0.00210.01260.02310.04410.05460.09660.24370.34870.56930.97900.98950.56230.66430.7665Totalfruityield∥104t0.61340.68910.84870.00840.41180.38660.66390.98320.09240.30250.50000.50260.51060.4014Populationgrowthrate∥%0.72280.38830.99020.99430.77880.98700.77880.61160.61220.28010.00850.03350.03890.0443
Table5HCandRHCofagro-eco-economicsysteminMinleCountyandLinzeCounty
RegionsSystemIndicatorsYear20002001200220032004200520062007200820092010201120122013MinleEcologicalsubsystemHC0.08760.03320.20180.17160.29130.28670.23450.21750.21040.11030.00860.06390.10360.1536CountyRHC11323333321122EconomicsubsystemHC0.0287-0.02570.14290.11270.23250.22780.27560.35870.35160.55140.65020.69230.71020.7162RHC10223334467788SocialsubsystemHC0.2060.15150.32010.28990.40970.4050.35280.33590.32880.22860.1270.26570.28310.3106RHC32435544432334RegionalsystemHC0.0804-0.05060.20980.17760.30270.2980.28360.2970.28970.24050.08930.10420.10270.1126RHC10324333331222LinzeEcologicalsubsystemHC0.04740.09490.13890.19250.27840.26570.26840.21240.20190.0454-0.01480.09560.15890.1792CountyRHC11223333310123EconomicsubsystemHC0.01420.06180.10570.15940.24530.23260.23520.40920.51880.60230.70480.71790.72460.8313RHC11223335678889SocialsubsystemHC0.07520.12270.16670.22040.30620.29350.29620.24020.22970.0732-0.0130.19830.20240.2068RHC12234333310233RegionalsystemHC0.0370.08960.13480.18910.27550.26270.26540.27530.28870.1260.05140.19290.20370.2945RHC11223333321333
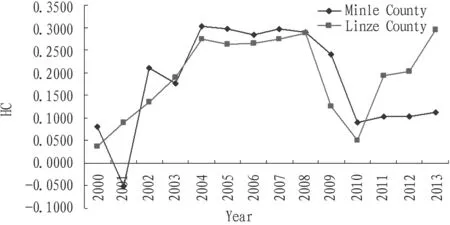
Fig.1HCofregionalagro-eco-economicsysteminMinleCountyandLinzeCounty
5 Conclusions and policy recommendations
5.1ConclusionsIn this paper, we take Minle County and Linze County located in the middle reaches of Heihe River as the typical research units. Based on the rural social and economic data during the period of 2000-2010, theory and method of mathematical statistics are used to establish the measure theory and model of agro-eco-economic system harmony coefficient, including efficacy function, function of harmony coefficient, harmony coefficient and level of harmony coefficient. Based on the actual situation of research region, evaluation indicator system of agro-eco-economic system is established and measurement is carried

a. Minle b.Linze
Fig.2HCofecologicalsubsystem,economicsubsystem,socialsubsystemandregionalsysteminMinleCountyandLinzeCounty
out.
Results show that the regional agro-eco-economic system in research region was in a serious imbalance in 2000-2013. The harmony coefficient of Minle showed a slight rise from 2000 to 2004, and then presented a fluctuating decline. Its rank of harmony coefficient experienced serious imbalance-extreme imbalance-moderate imbalance-low imbalance-serious imbalance-high imbalance. At the same time, the similar tendency happened in Linze County. The measuring results of subsystem in 2000-2013 further indicated that except that the harmony coefficient of economic subsystem in Minle County and Linze County was moderate and high, the ecological subsystem was at Level II and Level III, and social subsystem was at Level IV and Level III, in high and low imbalance status. Obviously, the harmony coefficient of economic subsystem in the two counties exhibits an optimizing trend, while the ecological subsystem and social subsystem are uncoordinated, which affects the overall coordination of regional agro-eco-economic system. Only when the three subsystems are in a state of harmony can the regional agricultural economy achieve coordinated development.
5.2Policyrecommendations(i) Vigorously promoting the construction of green national economic system. It is necessary to include ecological protection into the economic and social development; incorporate the scarce water resources into the national economic accounting system to make it become an important part of green national economic accounting; making the taxes that can directly or indirectly promote environmental protection fall within the category of "green taxes", in order to promote the construction of water-saving and pollution-preventing society[9]. (ii) Vigorously supporting the development of modern ecological agriculture. Modern ecological agriculture requires the economic development to adapt to the sustained capacity of environment and natural resources, to achieve optimization and unification of economic, ecological and social benefits. Therefore, for the development of modern ecological agriculture, there is an urgent need to establish the national and local laws or regulations on the ecological agriculture construction from a legal perspective, and provide more stable policy, legal and administrative support. (iii) Taking the road of modern agriculture with regional characteristics. Water shortage is a key factor restricting the economic, social development and ecological construction in the middle reaches of Heihe River, so the region’s modern agriculture should take the road of rainfed farming and green organic agriculture and combine farming with animal husbandry. (iv) Strengthening ecological construction and building the Heihe River valley as comprehensive experimental zone of national ecological security barrier. Given that most of the regions are ecologically fragile, so it is necessary to establish the comprehensive experimental zone of national ecological security barrier. (v) Fully using national policy to promote the basic farmland water conservancy construction. It is necessary to strengthen the supporting facility renovation and construction in the irrigation areas, and speed up the medium and small river control and small reservoir reinforcement.
[1] YANG SQ, GAO WS. Harmony coefficient theory and case study on agricultural ecosystem[J]. Journal of China Agricultural University,2006,11(2) :7-12.(in Chinese).
[2] ZHAI Y, YANG SQ, HAN QF,etal. Appraising theory on ecological agriculture and its case study[J]. Journal of Northwest Agriculture and Forestry University ( Natural Science Edition),2006,34(11) :54-60.(in Chinese).
[3] YANG SQ, YANG ZL, GAO WS. Appraising on harmony coefficient of regional agricultural system at different scales[J]. Journal of Northwest A&F University(Natural Science Edition),2008,36(5) : 64-72.(in Chinese).
[4] NIU YY, REN ZY, YANG R. The spatial-temporal analysis of harmony coefficient of agricultural eco-economic system in the region of Guanzhong[J]. Agricultural Research in the Arid Areas,2010,28(4) : 243-250.(in Chinese).
[5] LIU QJ. Effect of agricultural land use change in the middle reaches of Heihe River on farmers’ water-use efficiency and income: Taking the cases of Minle County and Linze County[D]. Beijing: University of Chinese Academy of Sciences,2012.(in Chinese).
[6] ZHANG K, SONG LC, HAN YX,etal. Analysis on supply and demand of water resources and related countermeasures in the middle reaches of Heihe River[J]. Journal of Desert Research,2006,26(5) :842 -848.(in Chinese).
[7] ZHOU GF. Valuation on coordinative development of the eco-economic system in Karst Region, Guizhou Province[J]. Carsologica Sinica,2004,23( 1) : 67-71.(in Chinese).
[8] YANG SQ, GAO WS, SUI P,etal. Evaluation of the harmony degree of Ziyang District’s ecologic-economic-social system[J]. China Polulation.Resources and Environment,2005,15(5) :?67-70.(in Chinese).
[9] LIU QJ, LI FR. A systemic consideration of the development of water-saving society in China[J]. Journal of Glaciology and Geocryology,2010,32(6) :1202-1210.(in Chinese).
杂志排行
Asian Agricultural Research的其它文章
- Empirical Analysis on Financial Development, Urbanization, and Urban and Rural Resident Income in Jiangsu Province
- Farmer’s Perception on Supply-Demand Matching of New Variety and Its Influence Factors
- Vegetation Coverage Changes in the West Qinling Region from 2000 to 2010: A Case Study of Longnan City
- A Study of Estimation Model for the Chlorophyll Content of Wheat Leaf Based on Hyperspectral Imaging
- A Study of Virtual Museum Simulation Platform Based on 2.5D Architectural Modeling Technology
- The Value Insistence of the Cultural Production in the Big Data Era
