Impacts of the Minimum Purchase Price Policy for Grain on the Planting Area of Rice in Hubei Province Based on a Mixed Linear Model
2016-01-12,
,
College of Economics and Management, Huazhong Agricultural University, Wuhan 430070, China
1 Introduction
To increase farmers’ income, arouse farmers’ enthusiasm for planting grain, stabilize grain price, and ensure food security, the minimum purchase price policy for grain has been implemented since 2004. In recent years, many scholars have assessed the minimum purchase price policy for grain and have analyzed its benefit, and there are more qualitative studies than quantitative studies. These studies show that the minimum purchase price policy for grain has obvious effects on grain yield and farmers’ income, and the goal of ensuring food security and increasing farmers’ income can be realized under the policy. Meanwhile, lots of scholars proposed that the policy of price protection might cause a series of problems. Very few researchers studied impacts of the minimum purchase price policy for grain on the planting area of grain. Grain yield may be affected by grain yield per unit area and technical progress, and impacts of the minimum purchase price policy for grain on the planting area of grain can reflect its roles more accurately than influences on grain yield.
Factors influencing the planting area of rice are complex. To study impacts of the minimum purchase price policy for grain on the planting area of rice, it is necessary to find other possible factors influencing the planting area of rice. For example, based on data of questionnaires and Logistic model, Li Wei[1]analyzed farmers’ will to plant rice and its influencing factors. The results showed that general environmental factors had most obvious effects on farmers’ will to plant rice, followed by family environment factors, while the impacts of individual quality factors were the smallest. In addition, based on regression models, Xiao Shuangxietal.[2]Analyzed cotton planting area in some regions of China from cost and income factors. The results indicated that the planting area of cotton in the last year, income of migrant workers, income from corn planting per unit area, and income from cotton planting per unit area affected the planting area of cotton greatly.
At present, few scholars studied the positive effects of the minimum purchase price policy for grain on grain production in China. For example, after testing the co-integration and Granger causality between grain price and yield as well as grain price and farmers’ income, Zhang Shuping[3]concluded that increase of grain price could stimulate improvement of grain yield obviously and increase of farmers’ income, so it is suggested that the government should continue to control grain price to promote increase of grain yield and farmers’ income. However, some scholars proposed different views. For instance, Zhong Yuetal.[4]use difference-in-difference method to analyze the influences of price support policy on rice production in main rice producing areas of China during 2004-2006, and found that price support policy had no obvious positive effects on the increase in the planting area of rice.
Most foreign scholars study the minimum purchase price policy for grain under the support of agricultural policies. For instance, Grden[5]studied influences of the minimum purchase price policy for grain on corn price based on correlation analysis. Besides, Andrew[6]studied the policy on supporting wheat price in Pakistan based on models. Main views of foreign scholars about China’s grain policies are shown as follows: it is needed to strengthen the implementation of grain policies, protect grain farmers, improve agricultural quality, and insist on reforming marketing orientation. Based on the above analysis, it is clearly seen that material input, labor input, purchase price, natural disasters, institutional change, crop sowing area, non-agricultural income, income from substitutes,etc. Can affect the planting area of grain.
Since the implementation of the minimum purchase price policy for grain in 2004, the minimum purchase prices of rice and wheat have increased in each region of China on the whole. For instance, the minimum purchase price of rice in Hubei Province has always risen in recent years, but its planting area tended to decrease from 1995 to 2014 on the whole. The planting area reduced from 2.08402 million hm2in 2004 to 1.97894 million hm2in 2008, decreasing by 5.31%. Moreover, the planting area increased or decreased since 2004 but did not exceed that in 2005. Therefore, people question the minimum purchase price policy for grain and suggest that the policy can not protect farmers’ enthusiasm for rice production in Hubei Province effectively. In this paper, based on a mixed linear model, effects of the minimum purchase price policy for grain on the planting area of rice in Hubei Province were analyzed when impacts of other factors on the planting area of rice were eliminated.
2 Data and methods
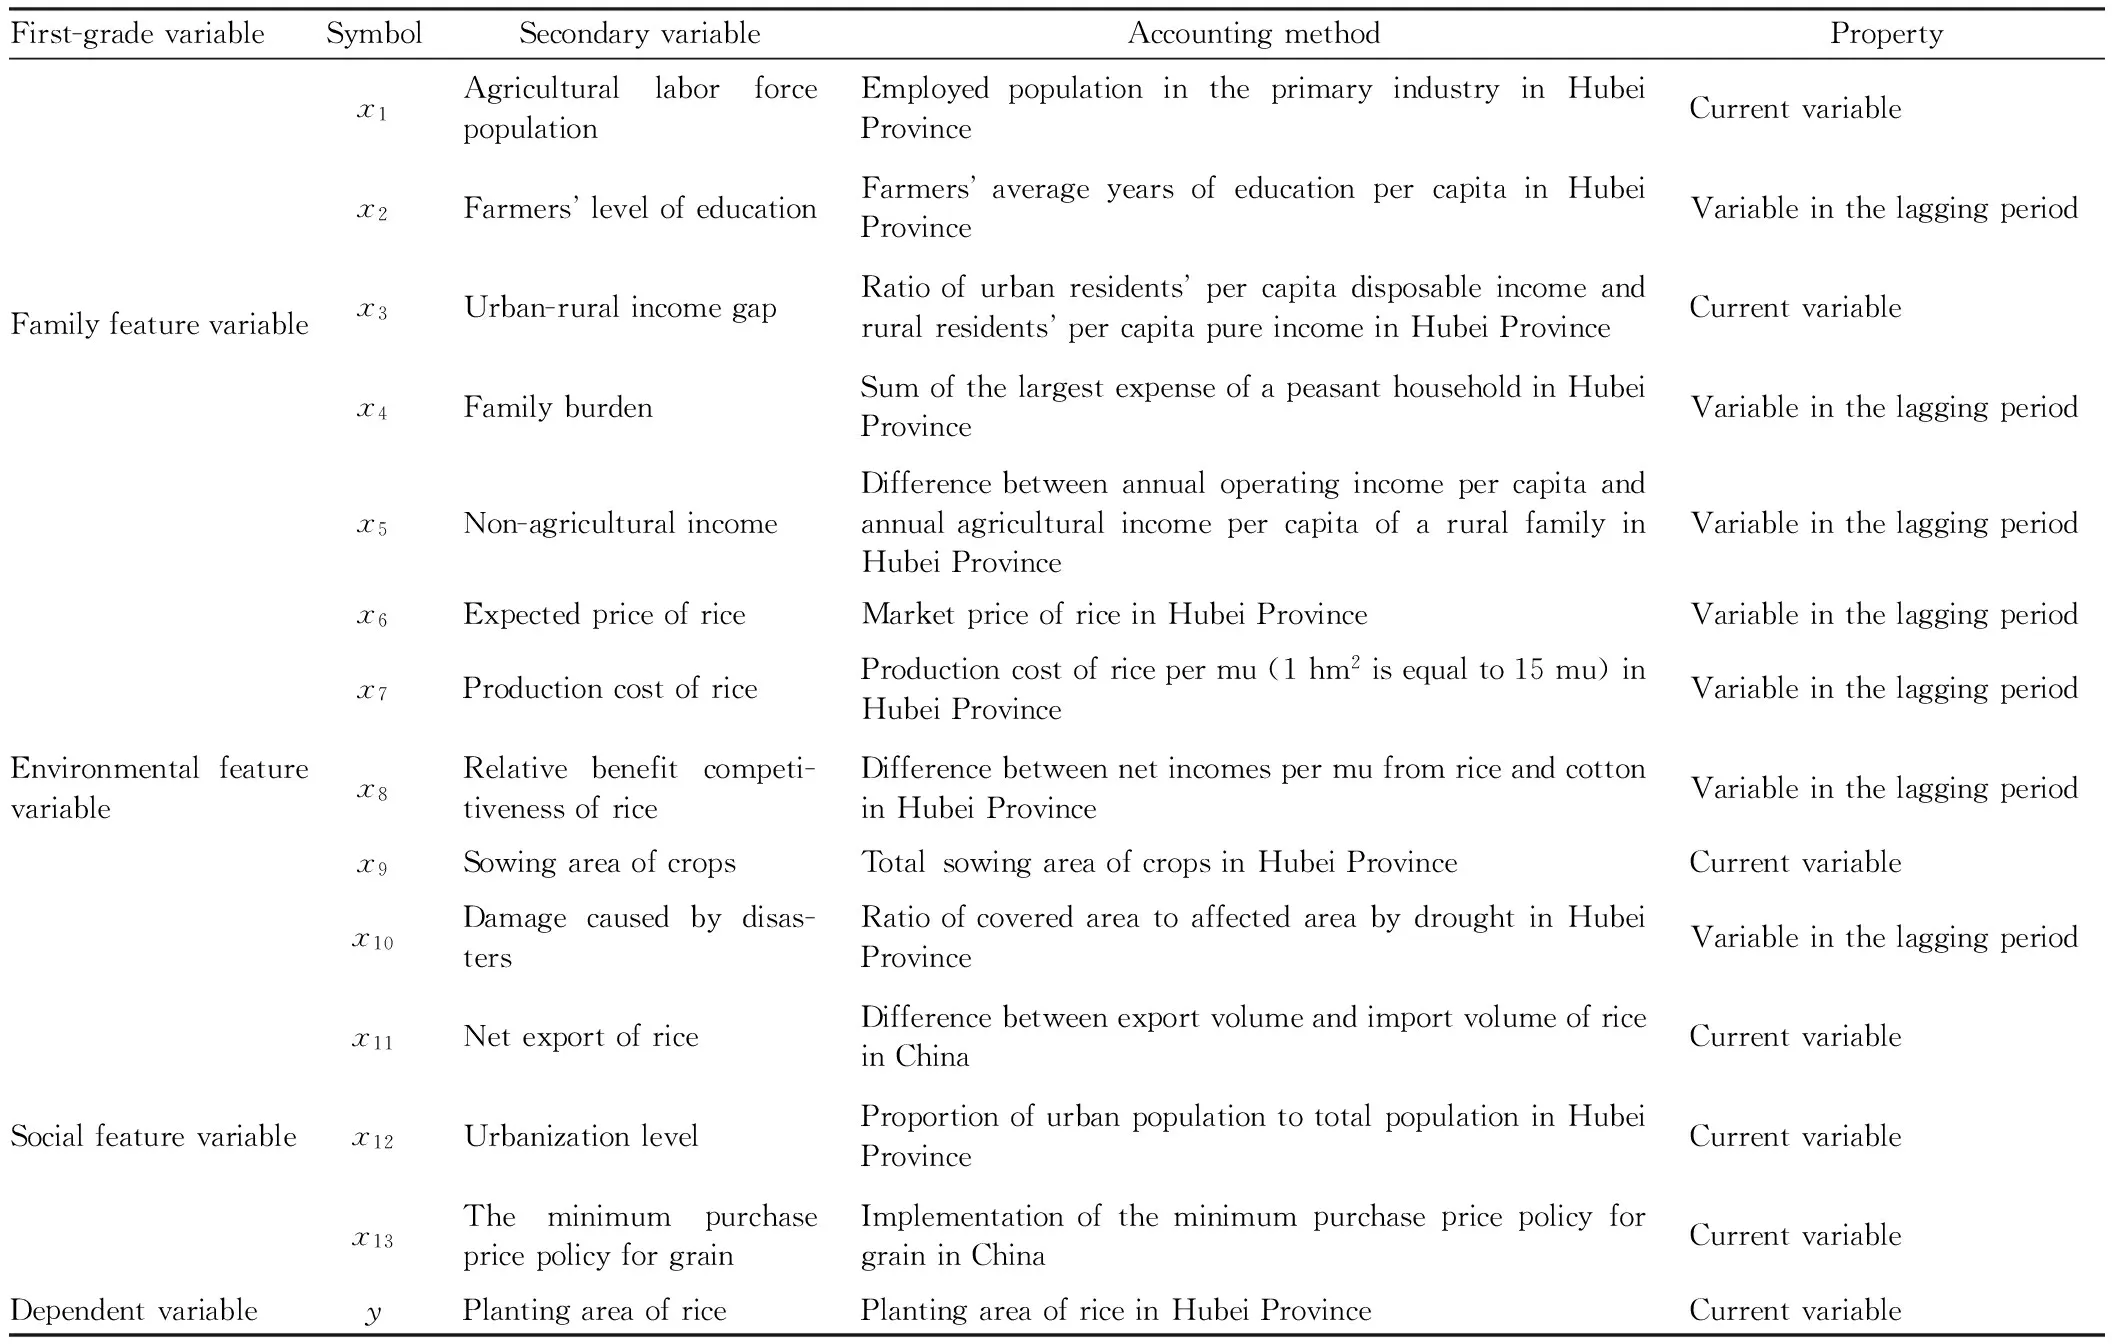
2.1SelectionofvariablesBased on previous studies[7-8], factors influencing the planting area of rice in Hubei Province were divided into family, environmental and social feature factors, including 13 independent variables (Table 1).
Table1FactorsinfluencingtheplantingareaofriceinHubeiProvince

First-gradevariableSymbolSecondaryvariableAccountingmethodPropertyFamilyfeaturevariableEnvironmentalfeaturevariableSocialfeaturevariableDependentvariablex1AgriculturallaborforcepopulationEmployedpopulationintheprimaryindustryinHubeiProvinceCurrentvariablex2FarmerslevelofeducationFarmersaverageyearsofeducationpercapitainHubeiProvinceVariableinthelaggingperiodx3Urban-ruralincomegapRatioofurbanresidentspercapitadisposableincomeandruralresidentspercapitapureincomeinHubeiProvinceCurrentvariablex4FamilyburdenSumofthelargestexpenseofapeasanthouseholdinHubeiProvinceVariableinthelaggingperiodx5Non-agriculturalincomeDifferencebetweenannualoperatingincomepercapitaandannualagriculturalincomepercapitaofaruralfamilyinHubeiProvinceVariableinthelaggingperiodx6ExpectedpriceofriceMarketpriceofriceinHubeiProvinceVariableinthelaggingperiodx7ProductioncostofriceProductioncostofricepermu(1hm2isequalto15mu)inHubeiProvinceVariableinthelaggingperiodx8Relativebenefitcompeti-tivenessofriceDifferencebetweennetincomespermufromriceandcottoninHubeiProvinceVariableinthelaggingperiodx9SowingareaofcropsTotalsowingareaofcropsinHubeiProvinceCurrentvariablex10Damagecausedbydisas-tersRatioofcoveredareatoaffectedareabydroughtinHubeiProvinceVariableinthelaggingperiodx11NetexportofriceDifferencebetweenexportvolumeandimportvolumeofriceinChinaCurrentvariablex12UrbanizationlevelProportionofurbanpopulationtototalpopulationinHubeiProvinceCurrentvariablex13TheminimumpurchasepricepolicyforgrainImplementationoftheminimumpurchasepricepolicyforgraininChinaCurrentvariableyPlantingareaofricePlantingareaofriceinHubeiProvinceCurrentvariable
Family feature variables mainly refer to variables reflecting the farming level of a peasant household. For instance, agricultural labor force population may affect the planting area of crops obviously, because the more the agricultural labor forces are, the larger the contribution of land use and crop planting are. Farmers’ level of education can reflect the level of human capital, and farmers’ with high level of education can manege a large area of crops. Urban-rural income gap may affect the loss of agricultural labor force population and may lead to changes in the occupation nature of a family. Family burden can reflect the economic situation of a peasant household, and too big burden may affect agricultural production of a family to a certain extent and then the planting area of crops. Non-agricultural income includes income from industry and service industry, and farmers’ outside income is common. In comparison with urban-rural income gap, non-agricultural income can influence the situation of farmers engaged in agriculture.
Environmental feature variables mainly refer to the natural environment and market environment of rice planting area. Firstly, according to experience, farmers often estimate the price of agricultural products to determine their seeding density and land allotment of various crops, so the expected price of rice will affect the sowing area of rice. Expected production cost of rice means the cost of seeds, pesticides, agricultural machinery, chemical fertilizer,etc. consumed in agricultural production according to prices, and it may affect the planting area of rice. For relative benefit competitiveness of rice, the planting season of cotton and rice is similar in Hubei Province, so there is a competitive relation between them. Farmers determine their planting area according to their benefit, so income from cotton will also influence the planting area of rice. Drought appeared frequently in recent years has certain impacts on the planting area of rice in Hubei Province.
Social feature variables include macroscopic variables about society except for the above variables. Net export of rice can reflect the dependence of a country on rice, and annual net export of rice also influences rice production in the country. On the one hand, improvement of urbanization level in recent years has resulted in the decrease of agricultural labor forces; on the other hand, after rural population moves into cities, the government increases farmland area through land reform, so influences of urbanization level on the planting area of rice are uncertain. As a agricultural protection policy, the minimum purchase price policy for rice will change farmers’ selection and expected income from agricultural products to a certain degree. It will affect farmers’ selection of sowing types and land allotment among various agricultural products protected by the price policy or among agricultural products protected by the price policy and other agricultural products. Meanwhile, it may affect the planting area of rice.
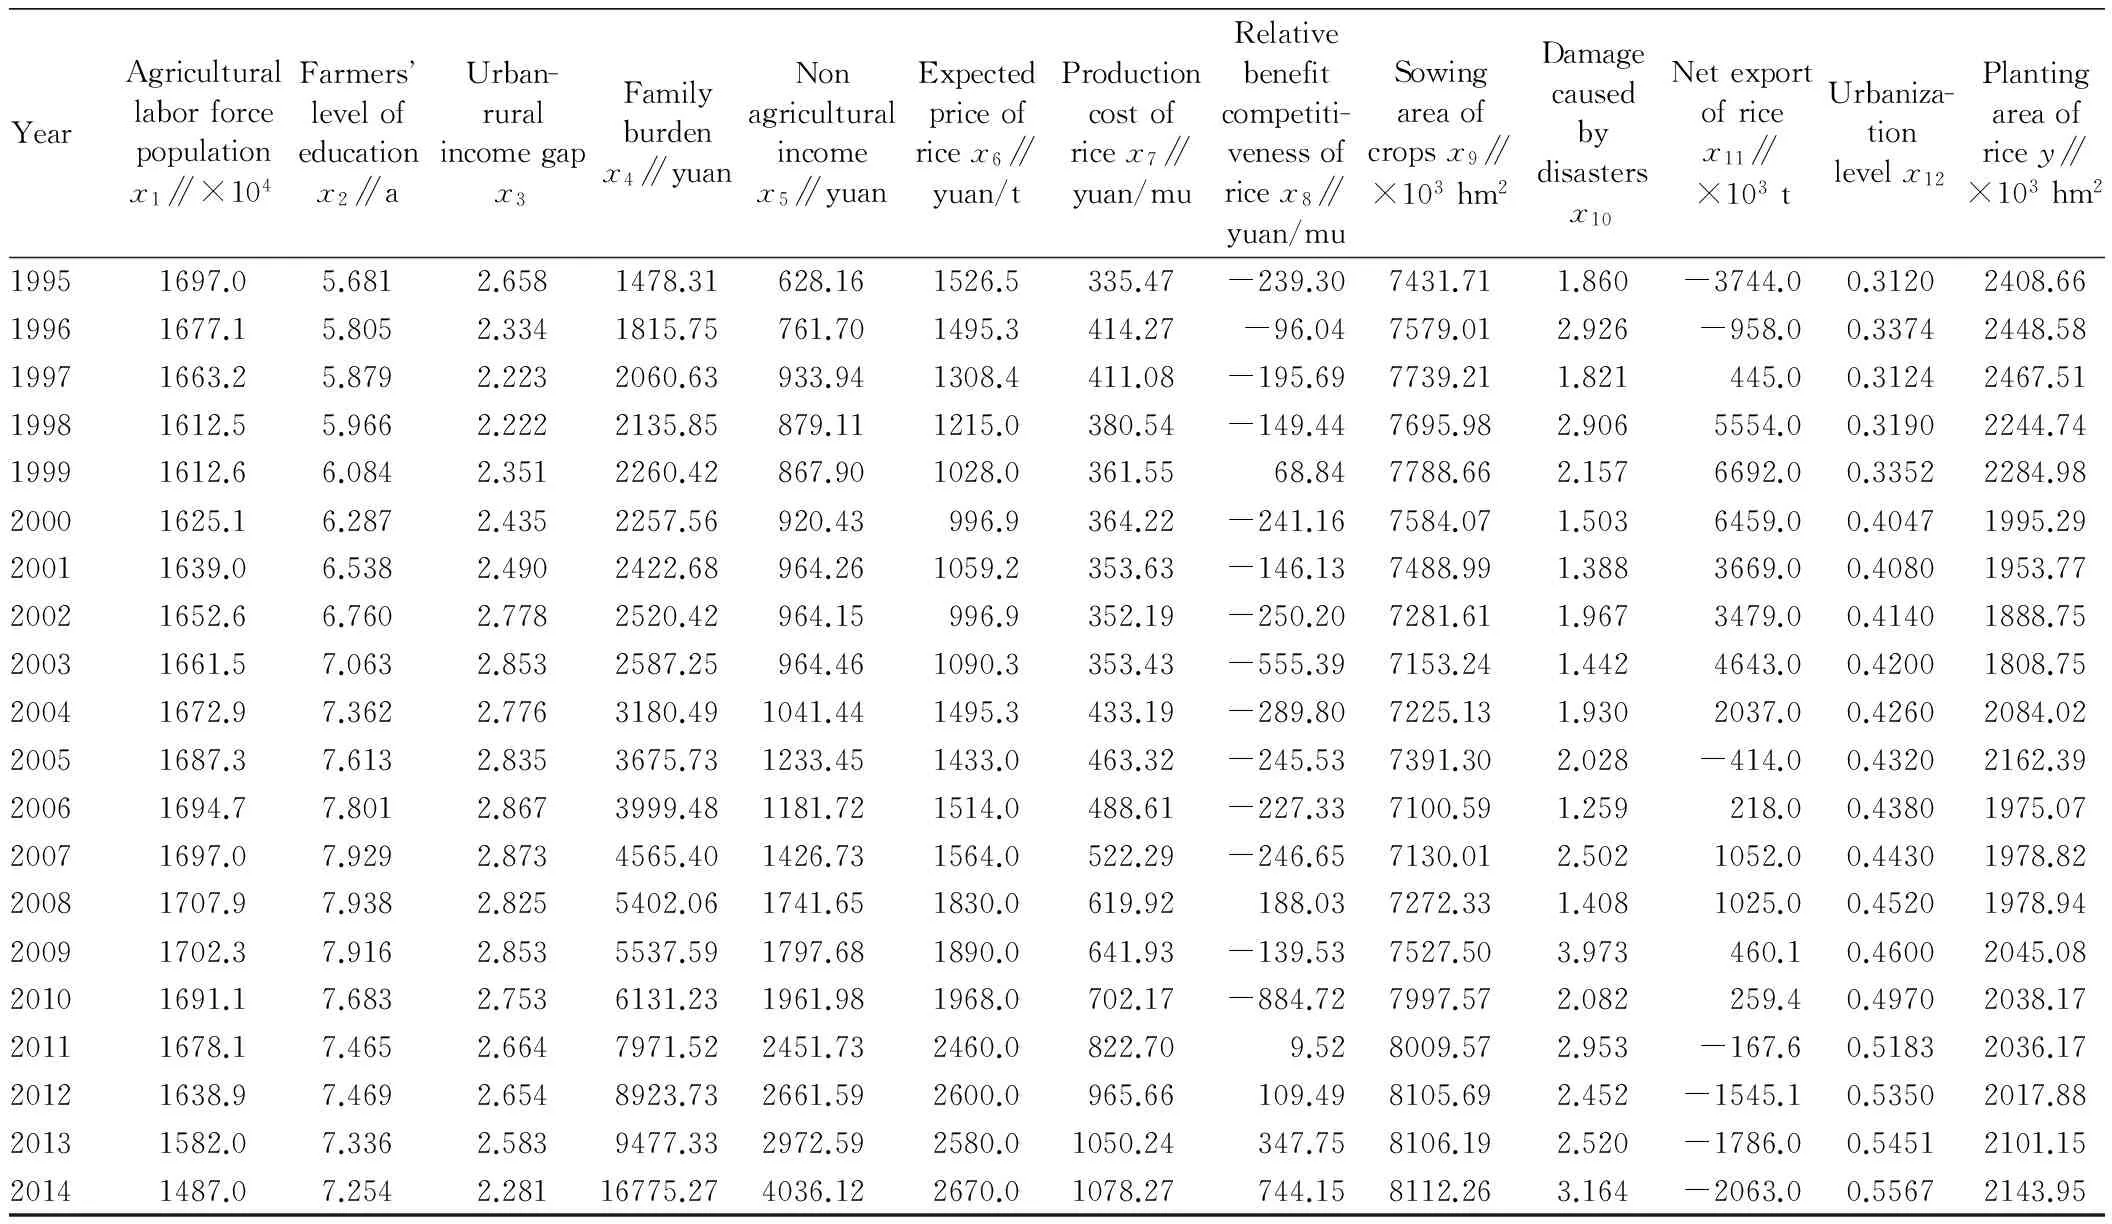
2.2DatasourcesData used in this paper are from Hubei Statistical Yearbook (1995-2015),ChinaRuralStatisticalYearbook(1995-2015),CompilationofDataonCostandIncomefromAgriculturalProductsinChina(1995-2015), Brick database of agricultural products, and database of Food and Agriculture Organization of the United Nations (FAO). Farmers’ level of education was calculated as follows: illiteracy and semi-illiteracy, primary school, junior high school, high school, technical secondary school, junior college or above mean farmers received education for one, five, eight, 11, 11 and 15 years respectively[9].
In Brick database of agricultural products, net incomes per mu from rice and cotton in Hubei Province were negative in some years, so relative benefit competitiveness of rice was also negative in these years. The minimum purchase price policy for grain is a qualitative variable, and A means a country has not implement the minimum purchase price policy for rice, while B means a country has implemented the minimum purchase price policy for rice. Besides, the minimum purchase price policy for grain is also a property variable. China did not implemented the minimum purchase price policy for grain during 1995-2003, so the variable was zero during 1995-2003. China implemented the policy during 2004-2014, and the minimum purchase price policy for rice was implemented the policy for rice in Hubei Province, so it was 1 during 2004-2014. Statistical data of the other variables are shown in Table 2.
Table2StatisticaldataoffactorsinfluencingtheplantingareaofriceinHubeiProvince

YearAgriculturallaborforcepopulationx1∥×104Farmerslevelofeducationx2∥aUrban-ruralincomegapx3Familyburdenx4∥yuanNonagriculturalincomex5∥yuanExpectedpriceofricex6∥yuan/tProductioncostofricex7∥yuan/muRelativebenefitcompetiti-venessofricex8∥yuan/muSowingareaofcropsx9∥×103hm2Damagecausedbydisastersx10Netexportofricex11∥×103tUrbaniza-tionlevelx12Plantingareaofricey∥×103hm219951697.05.6812.6581478.31628.161526.5335.47-239.307431.711.860-3744.00.31202408.6619961677.15.8052.3341815.75761.701495.3414.27-96.047579.012.926-958.00.33742448.5819971663.25.8792.2232060.63933.941308.4411.08-195.697739.211.821445.00.31242467.5119981612.55.9662.2222135.85879.111215.0380.54-149.447695.982.9065554.00.31902244.7419991612.66.0842.3512260.42867.901028.0361.5568.847788.662.1576692.00.33522284.9820001625.16.2872.4352257.56920.43996.9364.22-241.167584.071.5036459.00.40471995.2920011639.06.5382.4902422.68964.261059.2353.63-146.137488.991.3883669.00.40801953.7720021652.66.7602.7782520.42964.15996.9352.19-250.207281.611.9673479.00.41401888.7520031661.57.0632.8532587.25964.461090.3353.43-555.397153.241.4424643.00.42001808.7520041672.97.3622.7763180.491041.441495.3433.19-289.807225.131.9302037.00.42602084.0220051687.37.6132.8353675.731233.451433.0463.32-245.537391.302.028-414.00.43202162.3920061694.77.8012.8673999.481181.721514.0488.61-227.337100.591.259218.00.43801975.0720071697.07.9292.8734565.401426.731564.0522.29-246.657130.012.5021052.00.44301978.8220081707.97.9382.8255402.061741.651830.0619.92188.037272.331.4081025.00.45201978.9420091702.37.9162.8535537.591797.681890.0641.93-139.537527.503.973460.10.46002045.0820101691.17.6832.7536131.231961.981968.0702.17-884.727997.572.082259.40.49702038.1720111678.17.4652.6647971.522451.732460.0822.709.528009.572.953-167.60.51832036.1720121638.97.4692.6548923.732661.592600.0965.66109.498105.692.452-1545.10.53502017.8820131582.07.3362.5839477.332972.592580.01050.24347.758106.192.520-1786.00.54512101.1520141487.07.2542.28116775.274036.122670.01078.27744.158112.263.164-2063.00.55672143.95
2.3MethodsInfluences of independent variables on dependent variableYare often studied by regression analysis, but common linear regression can not solve the problem of independent variables containing qualitative variables (likex13), and generalized linear regression is often used to solve this problem. However, correlations between independent variables also influence generalized linear regression equations greatly, especially when there are linear or strong correlations between independent variables. In this paper, the principal components of the quantitative variables (x1-x12) were extracted by Principal Component Analysis (PCA) to form new independent variables. To discuss effects of the minimum purchase price policy for rice on the planting area of rice, the minimum purchase price policy was used as the fixed effect and other factors were as the random effect to establish a mixed linear model as follows:
Y=Xβ+Zγ+ε
whereYis an observed value, namely the data vector of the planting area;Xis a dummy variable generated by usingx13data;βis an unknown vector composed of fixed effect parameters of known design matrixX;Zis a new variable obtained after PCA ofx1-x12;γis an unknown vector composed of random effect parameters of known design matrixY;εis an unknown random error vector. A mixed linear model is a statistical method that is used to process hierarchical structure data in medicine field, and it is often used to fit clustering or non-independent hierarchical data or repeated measured data in various periods. At the same time, impacts of fixed and random effect produced by different clustering or hierarchical data are brought into the model. In substance, it decomposes the residual term of a multiple linear regression model further and then lead to random effect[10]. In comparison with common linear models, good fitting results and accurate prediction effect can be obtained by a mixed linear model.
3 Results and analysis
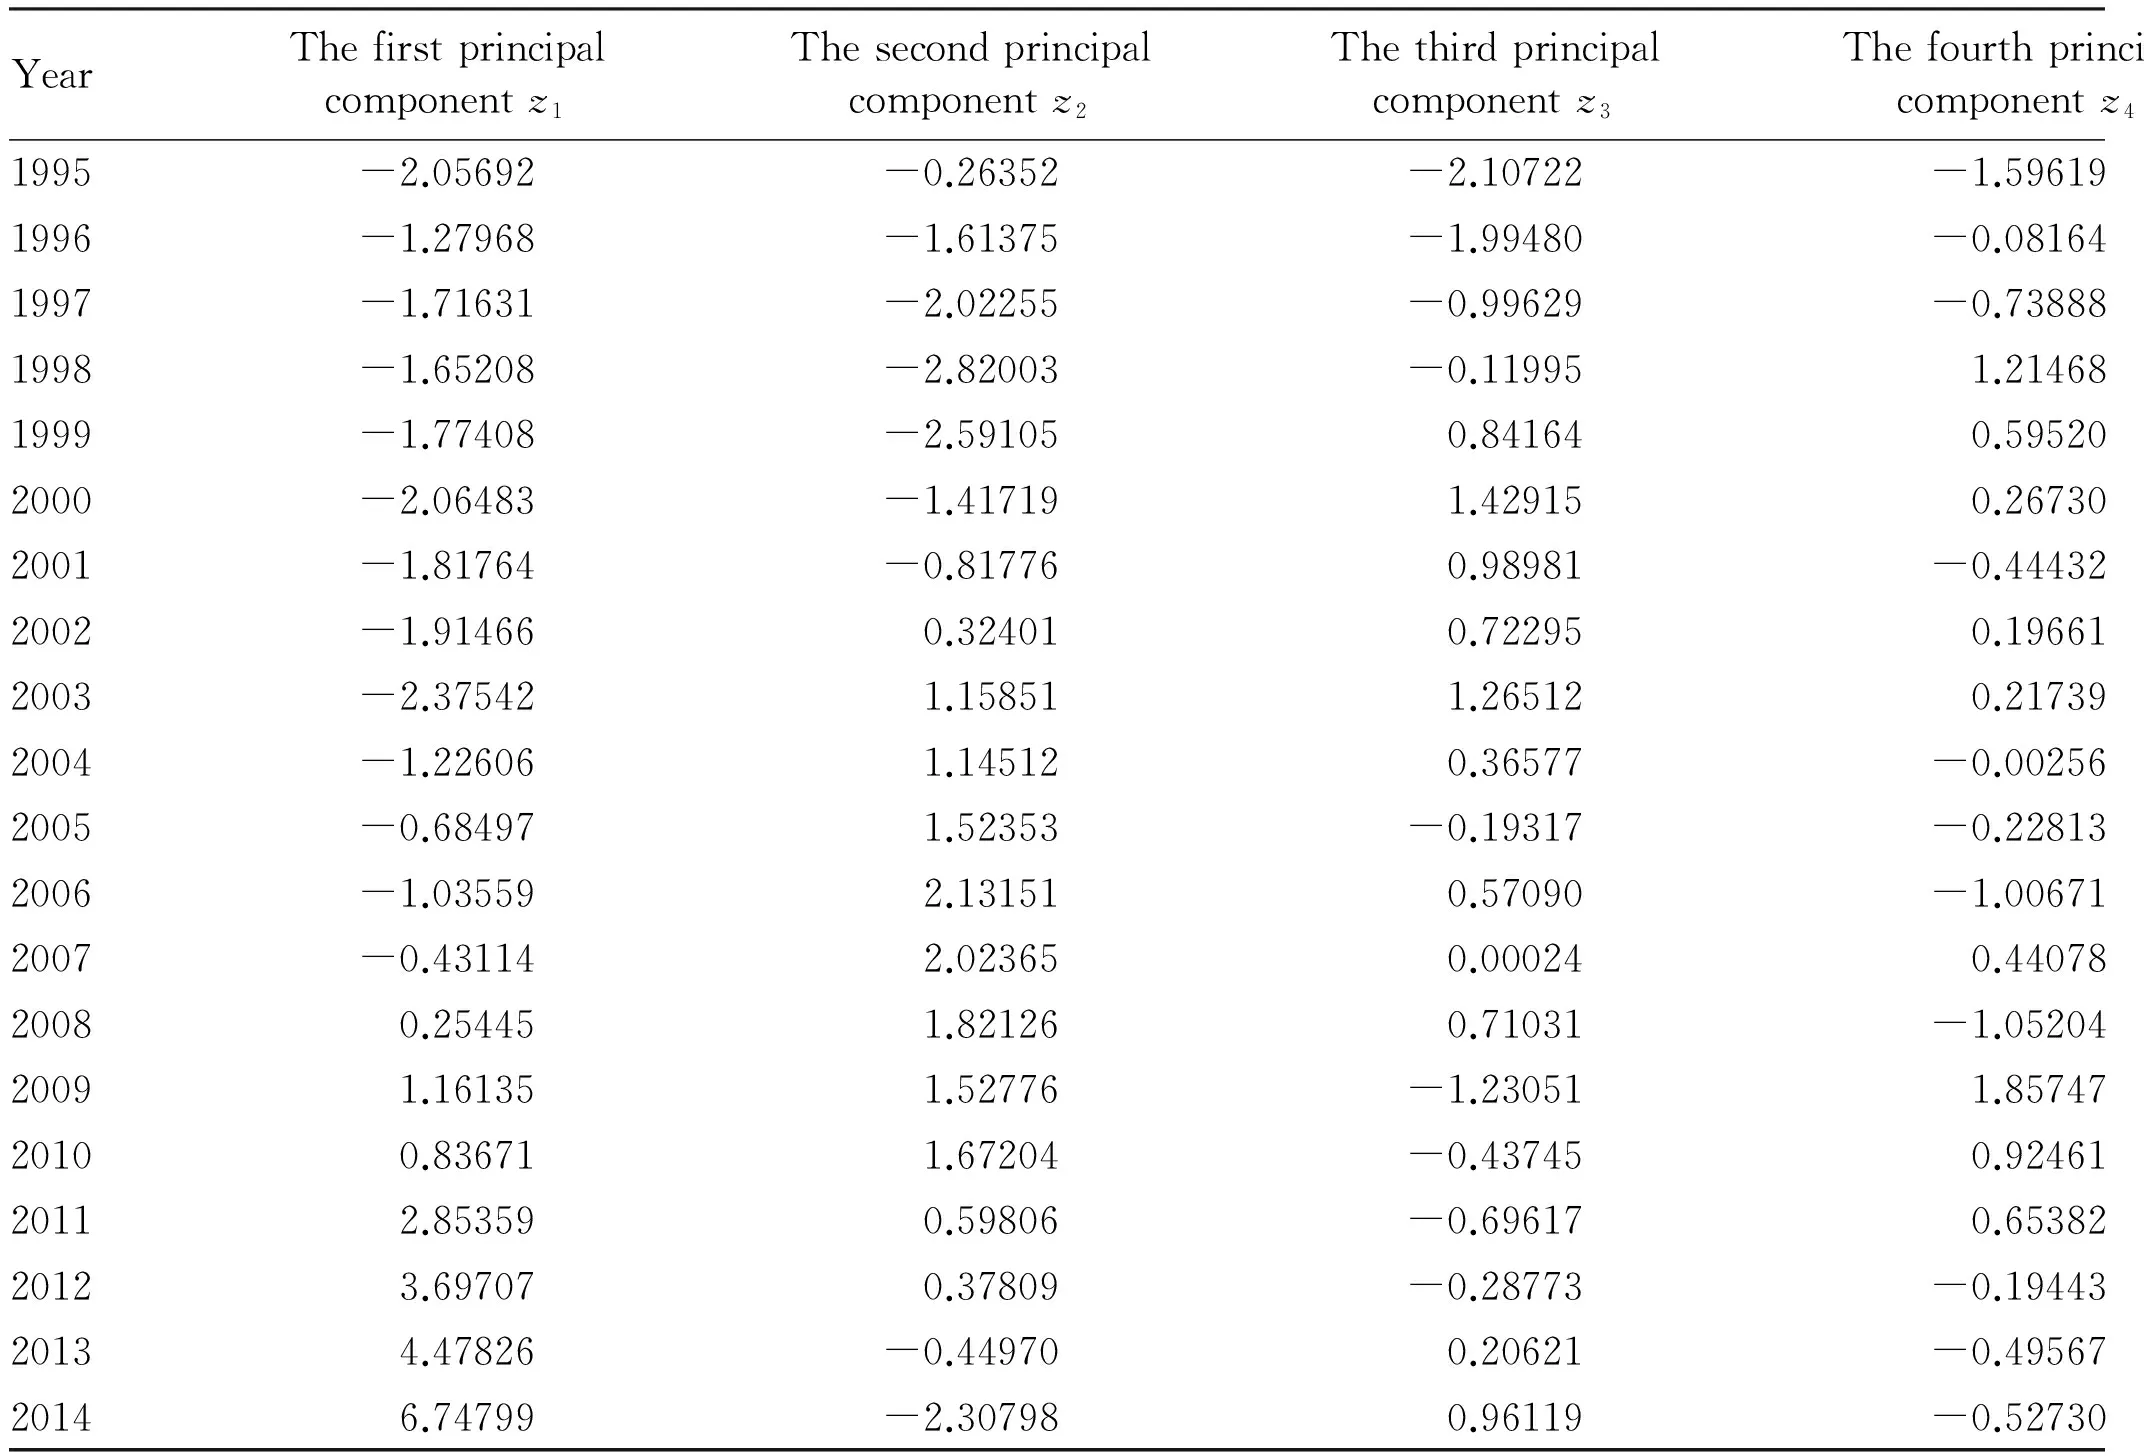
3.1PrincipalcomponentanalysisIn this paper, the observed data of planting area of rice in Hubei Province during 1995-2014 constituted dependent variableY. Meanwhile, due to the existence of lagged variables, there were 19 effective observation samples. The minimum purchase price policy for ricex13was as the fixed effectX, and it is a qualitative variable and have two observation levels. The principal components of factorsx1-x12were extracted to constructZmatrix. The contribution rate of each principal component obtained by Princomp module of SAS 9.2 is shown in Table 3. The contribution rate of principal components 1-5 decreased gradually, and the accumulated contribution rate of principal components 1-5 increased from 54.52% to 96.60%, and the accumulated contribution rate of principal component 5 met the requirements. That is, the first five principal components included 96.60% of information about the 12 variables, so the first five principal componentsz1-z5were chosen to construct random effect matrixZof mixed linear equations.
Table3Contributionrateofeachprincipalcomponent

PrincipalcomponentEigenvalueVarianceContributionrateAccumulatedcontributionrate16.542767053.790028080.54520.545222.752738971.725305290.22940.774631.027433680.346084990.08560.860240.681348690.088616130.05680.917050.592732560.384660460.04940.9660
Table4Scoresofthefiveprincipalcomponentsduring1995-2014

YearThefirstprincipalcomponentz1Thesecondprincipalcomponentz2Thethirdprincipalcomponentz3Thefourthprincipalcomponentz4Thefifthprincipalcomponentz51995-2.05692-0.26352-2.10722-1.59619-0.021661996-1.27968-1.61375-1.99480-0.081640.473651997-1.71631-2.02255-0.99629-0.73888-0.620761998-1.65208-2.82003-0.119951.214680.288361999-1.77408-2.591050.841640.595200.159272000-2.06483-1.417191.429150.26730-0.592112001-1.81764-0.817760.98981-0.44432-0.277922002-1.914660.324010.722950.196610.378502003-2.375421.158511.265120.21739-0.287412004-1.226061.145120.36577-0.002560.294382005-0.684971.52353-0.19317-0.228130.210932006-1.035592.131510.57090-1.006710.233912007-0.431142.023650.000240.440780.9067920080.254451.821260.71031-1.052040.6516620091.161351.52776-1.230511.857471.2086620100.836711.67204-0.437450.92461-2.3570120112.853590.59806-0.696170.65382-0.3850920123.697070.37809-0.28773-0.19443-0.7511420134.47826-0.449700.20621-0.49567-0.3084620146.74799-2.307980.96119-0.527300.79547
Afterwards, the scores of the five principal components during 1995-2014 were calculated by using the software SAS, and these scores constitutedZin mixed linear models (Table 4).
3.2MixedlinearmodelsThe minimum purchase price policy for rice (x13) as the fixed effect and the five principal componentsz1-z5as the random effect were substituted into the mixed linear model of rice planting area in Hubei ProvinceYfirstly. Afterwards, Mixed module of SAS 9.2 was used to solve the model, and the test results of covariance parameter γ are shown in Table 5. According to Table 5, the test values ofPr>Zof all principal components were smaller than 0.01, showing that the covariance parameter passed through the test. That is, the random factor had significant effects on the dependent variable.
Table5Testresultsofthecovarianceparameter

PrincipalcomponentEstimateStandarderrorZvaluePr>Zz11381.262075.240.670.0003z211471164800.70<0.0001z33251.174796.30.68<0.0001z41604.2925570.630.0047z513373192580.69<0.0001Residual2513.51954.52.630.0042
Test results of fixed effect parameterx13are shown in Table 6. According to Table 6, the test values ofPr>|t| were smaller than 0.01, so the null hypothesis was rejected, andx13was significantly effective.
Table6Testresultsofthefixedeffectparameter

Effectx13EstimateStandarderrorDFtvaluePr>|t|Intercept2190.3226.83521281.62<0.0001x13A-245.2757.582712-4.260.0011x13B0----
Finally, the regression equation of the minimum purchase price policy for rice and the planting area of rice was obtained as follows:
y|x 13=1=2190.32×x13+1381.26×z1+11471×z2+3251.17×z3+1604.29×z4+13373×z5+2513.51
wherex13=1 mean the regression equation reflects impacts of the minimum purchase price policy for rice on the planting area of rice in Hubei Province during 2004-2014. In Table 7, the probability ofFtest was smaller than 0.01, indicating that the regression equation was significant and had statistical significance.
Table7ResultsofFtest

EffectNumDFDenDFFvaluePr>Fx1311218.140.0011
According to Table 7, the regression equation was valid. Meanwhile, the fixed effectx13passed through its parameter test, showing that the minimum purchase price policy for rice had impacts on the planting area of rice in Hubei Province. Its coefficient was positive, so the impacts were positive. In comparison with other regression parameters, the effects of the minimum purchase price policy for rice on the planting area of rice in Hubei Province was extremely significant. The planting behavior of farmers as the study subject is based on their judgment about market situation and national policies to a great extent. With China’s constant attention and investment in agriculture since the reform and open, the influence of national agricultural insurance policies on their planting behavior is more obvious than that of market. Under the current policies of supporting grain production, farmers’ reaction to prices of agricultural products is more sensitive. The minimum purchase price policy for grain can decrease the risk of investment in agriculture greatly, protect farmers’ benefit in continuously changing market of agricultural products, bring confidence and guarantee to farmers engaged in agricultural activities, improve farmers’ enthusiasm for planting grain, and then affect the planting area of grain in a peasant household.
4 Conclusions and discussion
In this paper, the results show that the minimum purchase price policy for rice had significantly positive effects on the planting area of rice in Hubei Province. That is, it improved farmers’ enthusiasm for planting rice, increased the planting area of rice, and then ensured the production and supply of rice in Hubei Province.
In fact, the crop planting behavior of farmers depends on the expected income from crops which can be divided into the expected yield and expected prices of crops. The expected prices of crops are mainly the expected market and policy prices (the minimum purchase price), while the expected yield of crops will be affected by initial planting area, disasters, fruiting rate, quantity of applied fertilizer, but farmers mainly determine initial planting area, and it can be controlled more easily by farmers than other factors. Here it is assumed that the minimum purchase price is the expected price of grain, and farmers will obtain their initial expected income to meet their agricultural production and family goal if the minimum purchase price is higher than the actual market price, otherwise farmers will obtain additional revenue to realize increase of family income, thereby improving farmers’ trust and support for the national agricultural protection policy and their enthusiasm for agricultural production. However, it is assumed that the past market price is as the expected price, farmers can realize the expected income if the expected market price is lower than the actual market price; if the expected market price is higher than the actual market price, agricultural income planning of a family can not finished, and farmers’ enthusiasm for agricultural or crop production will be affected. Therefore, the minimum purchase price is as the expected price, and any market prices can ensure the realization of the expected income. Moreover, it has certain resistance to the abrupt change of actual market prices. That is, if the minimum purchase price is as the expected price, farmers’ actual price must be equal to or higher than the expected price, and farmers can obtain the expected income and additional income. Based on the price protection, the expected income is the product of the expected price and yield, so the expected price is the expected market price in years when the minimum purchase price policy was not implemented, which may bring negative effects and affect farmers’ enthusiasm for agricultural production. In years when the minimum purchase price policy has been implemented, price protection and realization of the expected income will improve farmers’ enthusiasm for planting crops whose prices are protected and their planting area. That is, the implementation of the minimum purchase price policy will promote the sowing area of rice.
Since the implementation of the minimum purchase price policy for rice in Hubei Province in 2004, the planting area of rice in Hubei Province fluctuated but tended to increase on the whole. The regression results of factors influencing the planting area of rice show that the minimum purchase price policy for rice had positive effects on the planting area of rice in Hubei Province, so the agricultural protection policy was an effective measure to increase the planting area of rice. To ensure future food security, the sowing area of rice should be stabilized during the establishment of production input decisions; if farmers’ level of education is low, it is needed to guild and protect agricultural production effectively to improve farmers’ enthusiasm for agricultural production, insist on optimizing resource environment and policy environment of rice production, and establish more policies to protect farmers’ benefit in market. Meanwhile, it is needed to use the price protection policy to popularize and sow high-quality rice varieties and provide effective technical support for farmers, strengthen drought monitoring and early warning capability, improve drought resistant security system, consolidate water conservancy infrastructure construction in paddy field, and enhance rice comprehensive production, drought resistance and disaster reduction capacity. At the present stage, the government should insist on using the minimum purchase price policy to conduct macro-control of market price to realize organic combination of market regulation and macro-control. At the same time, disadvantages of the minimum purchase price policy should be improved.
[1] LI W. Peasants’ willingness to rice planting and its influential factors:Based on data of Zixing, Hunan [J]. Journal of Hunan Agricultural University(Social Science), 2010,11(5):7-13. (in Chinese).
[2] XIAO SX, LIU XH. Analysis on the impact factors for cotton planting area——Based on the investigation at Xinjiang, Henan, Jiangsu and Shandong [J]. Journal of Agrotechnical Economics, 2008(4):79-84.(in Chinese).
[3] ZHANG SP. Economic effects of China’ s grain price fluctuation [J]. Finance and Economics, 2011(8): 93-102. (in Chinese).
[4] ZHONG J, QIN F. Effect of price support policies on grain production in China [J]. Modern Economic Science, 2012,34(3): 119-128.(in Chinese).
[5] GRDEN B. The economies of agricultural policies [M]. 2003.
[6] ANDREW PB. Wheat price policy in Pakistan: A welfare economics approach [M].1992.
[7] LI W. Peasants’ willingness to rice planting and its influential factors:Based on data of Zixing, Hunan [J]. Journal of Hunan Agricultural University(Social Science), 2010, 11(5): 7-13. (in Chinese).
[8] ZHANG JS, WANG YP. Empirical study of factors influencing the yield increase of grain in China [J]. Hubei Agricultural Sciences, 2008, 47(4): 482-485. (in Chinese).
[9] WANG W, GUO XY. An econometric analysis of farmers’ education level and rural economic growth [J]. Farm Economic Management, 2007(2): 43-45. (in Chinese).
[10] LIU XL, ZOU GH, LI Y, et al. Assessment of paddy soil productivity by using the multiple linear mixed-effect regression model [J]. Research of Agricultural Modernization, 2014, 35(5): 603-609. (in Chinese).
杂志排行
Asian Agricultural Research的其它文章
- On the Government’s Responsibility in China’s Rural Land Transfer
- Is the Farmland of China Sufficient?
——Analysis Based on the Second National Land Survey - Research on Management Mode of Small-scale Irrigation Works for Farmland Based on Self-governance
- Industrial Upgrade, Vocational Ability and Migrant Worker Education and Training
- A Study of Soil Nutrients in the Terrace Field Changed from Mountain Slope in Three Gorges Reservoir Region
- Influence of Transplantation in Different Stage on Growth and Yield of Spring Maize in Shanxi Early Mature Area
