Sino-Australian Agricultural Product Trade Development in the Context of the Belt and Road Initiative
2016-01-12,
,
College of Economics and Management, Huazhong Agricultural University, Wuhan 430070, China
1 Introduction
Australia is a country with developed animal husbandry and also a major exporter of agricultural products. Since the 1990s, Sino-Australian agricultural product trade has been developing rapidly. The export volume of Chinese agricultural products to Australia rose from 95 million USD in 1995 to 1.075 billion USD in 2014 with annual growth of 13.6%. The export volume of Australian agricultural products to China also rose from 956 million USD in 1995 to 8.202 billion USD in 2014 with annual growth of 12.0%. The bilateral trade volume grew from 1.052 billion USD in 1995 to 9.278 billion USD, increasing about 9 times. China is the largest developing country in the world, while Australia is the most developed country in the Southern Hemisphere. In 2014, GDP of China and Australia was 9925.54 billion USD and 1638.93 billion USD respectively, ranking the second and 12th place in the world, and the proportion of added value of agriculture to GDP was 9.2% and 2.5% separately. High economic development potential means huge demands for agricultural product import between two countries. With international market competition of agricultural products becoming intense, China and Australia launched the free trade agreement negotiation in 2005. In November 2014, China and Australia declared completion of nine year long negotiation. According to negotiation results, Australia reduced the tariff on all Chinese products to zero, and China also reduced the tariff on most Australian products to zero. As the 12th largest economy in the world, Australia will become the largest developed economy signing free trade agreement with China. Besides, Australian government also hopes to participate in construction of the Belt and Road Initiative. According to these, the Sino-Australian bilateral trade volume will further expand. In this context, it will be of important realistic significance and reference value to make systematic analysis on Sino-Austrian agricultural product trade.
Existing researches about Sino-Australian agricultural product trade mainly focus on certain product or certain aspect. Zhou Changyong[1]analyzed current situations of Sino-Australian orange industry and cooperation potential, and concluded that comparative advantages are different between China and Australia, there is high complementarity, and the cooperation potential is enormous. Peng Kemao,etal.[2]evaluated competition and complementarity in Sino-Australian fruit trade and found that complementary products are more than competitive products. In fresh fruit trade, potential income space of Australia is larger than China, the situation is opposite in processing trade, and they came up with recommendations for China’s fruit trade. Liu Lifeng and Liu Heguang[3]analyzed current trade situations of 7 categories of agricultural products using trade specialization coefficient, Grubel-Lloyd index, concentration index and relative trade index, and results indicate that China has comparative advantage in foods, beverage, chemical industry, Sino-Australia agricultural product trade is mainly intra-industry trade and shows significant complementarity. Zhou Haiyan[4]evaluated the intra-industry trade degree and complementarity degree of major agricultural products in bilateral trade using the intra-industry trade index and trade complementarity index, and pointed out that the intra-trade level between two countries is not high in general, the complementarity of export of Australia to China is highest in wool and cotton. Most researches focus on certain category of agricultural products or certain aspect of competition and complementarity in agricultural product trade. Few researches touch upon competition, complementarity and growth potential[5]. Based on the above understanding, in the context of the the Belt and Road Initiative, we made a comprehensive study on Sino-Australian agricultural product trade from competition, complementarity and growth potential using two-digit code data in UN Comtrade database.
2 Analysis methods and data source
According to Theory of Comparative Advantage, the bilateral agricultural product trade on the basis of comparative advantage is favorable for raising welfare level of a country and realizing win-win. To study bilateral agricultural product trade relation, we need consider agricultural product trade relation and also the agricultural product trade relation of two countries in the third market or the world market. From agricultural product trade relation between two countries, when they export agricultural products with comparative advantage according to Theory of Comparative Advantage, if there are large differences in comparative advantage, their bilateral agricultural product trade will be mainly complementary; otherwise, it will be mainly competition. From the agricultural product trade relation of two countries in the third market or the world market, when it shows great differences in product structure, the bilateral product trade will be mainly complementary; otherwise, it will be mainly competition[6]. To promote sustainable development of Sino-Australian agricultural trade, it is also necessary to make an in-depth analysis on the relation of complementary agricultural product trade, which is favorable for accurately analyzing growth potential of Sino-Australian agricultural product trade. In this study, we firstly analyzed competition of Chinese and Australian agricultural products in international market using the export similarity index and market structure of agricultural products, then analyzed complementarity of agricultural product trade between two countries using index of revealed comparative advantage, trade complementarity index, and finally analyzed growth potential of Sino-Australian agricultural product trade using the trade intensity index. Data in this study were selected from UN Comtrade database, the sample period is 1995-2014. For definition of agricultural products, we employed classification criterion in Harmonized System (HS) Classification of Goods, specifically, Chapter 01-24, Chapter 35, Chapter 41, Chapter 51 and Chapter 52.
3 Analysis on competition of Sino-Australian agricultural product trade
3.1SimilarityinexportofagriculturalproductsbetweenChinaandAustraliaThe export similarity index is used to measure the similarity in export market distribution between two countries. To adjust influence of excessive big gap of national economic scale, Glick and Rose (1998) introduced modified export similarity index, which can be expressed as follows:
(1)
Table1ModifiedexportsimilarityindexofChineseandAustralianagriculturalproducts

YearSYearSYearS199542.86200248.00200934.33199644.40200348.63201035.10199749.55200440.99201136.14199854.07200541.96201236.16199953.04200640.56201334.68200053.58200738.72201433.67200150.74200834.80
Data source: selected from UN Comtrade database and calculated using formula (1).
From Table 1, we can see that the export similarity index of Chinese and Australian agricultural products in 1995-2000 is rising, indicating that the agricultural product trade competition at Sino-Australian market becomes more and more intense. On the contrary, in 2001-2014, the export similarity index takes on obvious declining trend, indicating competition degree of Sino-Australian agricultural product trade after China’s entry to the WTO becomes mitigated.
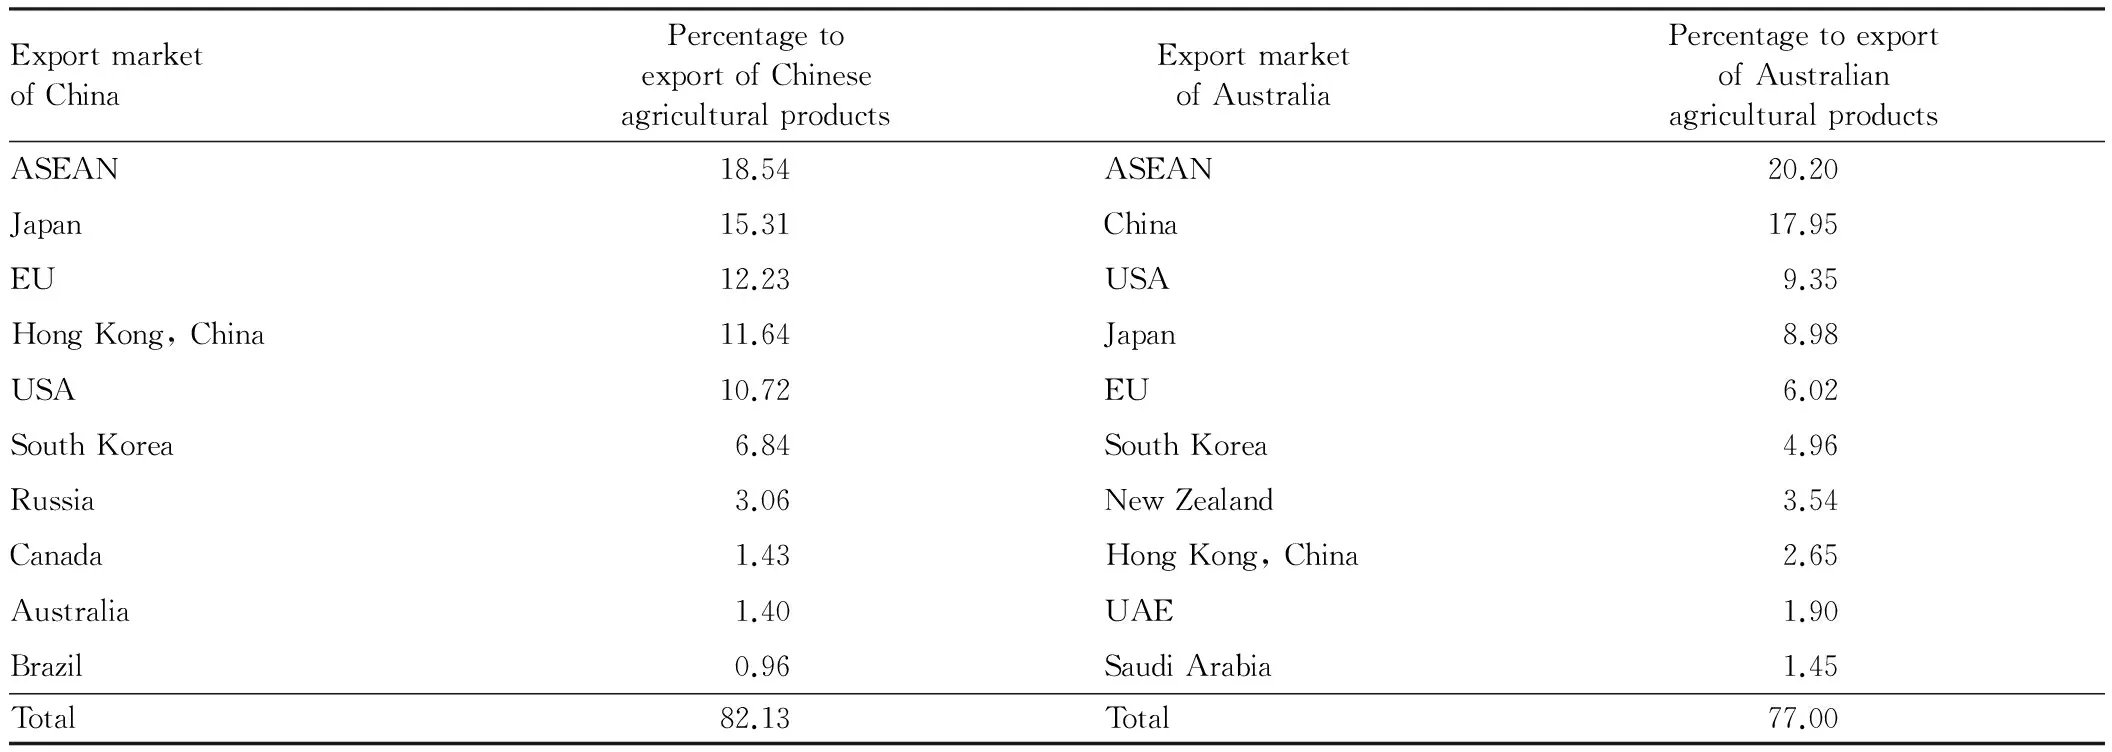
3.2ExportmarketstructureofagriculturalproductsbetweenChinaandAustraliaTable 2 reflects export market distribution of Chinese and Australian agricultural products. Export market of Chinese agricultural products mainly includes ASEAN, Japan, the EU, China, Hong Kong, USA, South Korea, Russia, Canada, Australia, and Brazil. The percentage of these ten export markets is more than 82% of total export of Chinese agricultural products. Export market of Australian agricultural products mainly includes ASEAN, China, USA, Japan, EU, South Korea, New Zealand, Hong Kong, UAE, and Saudi Arabia. The percentage of these ten export markets is up to 77% of total export of Australian agricultural products. These indicate that ASEAN, Japan, the EU, USA, South Korea, and Hong Kong of China are common export markets of both Chinese and Australian agricultural products.
Table2MainexportmarketofChineseandAustralianagriculturalproductsin2014
ExportmarketofChinaPercentagetoexportofChineseagriculturalproductsExportmarketofAustraliaPercentagetoexportofAustralianagriculturalproductsASEAN18.54ASEAN20.20Japan15.31China17.95EU12.23USA9.35HongKong,China11.64Japan8.98USA10.72EU6.02SouthKorea6.84SouthKorea4.96Russia3.06NewZealand3.54Canada1.43HongKong,China2.65Australia1.40UAE1.90Brazil0.96SaudiArabia1.45Total82.13Total77.00
Data source: arranged and calculated using WITS database.
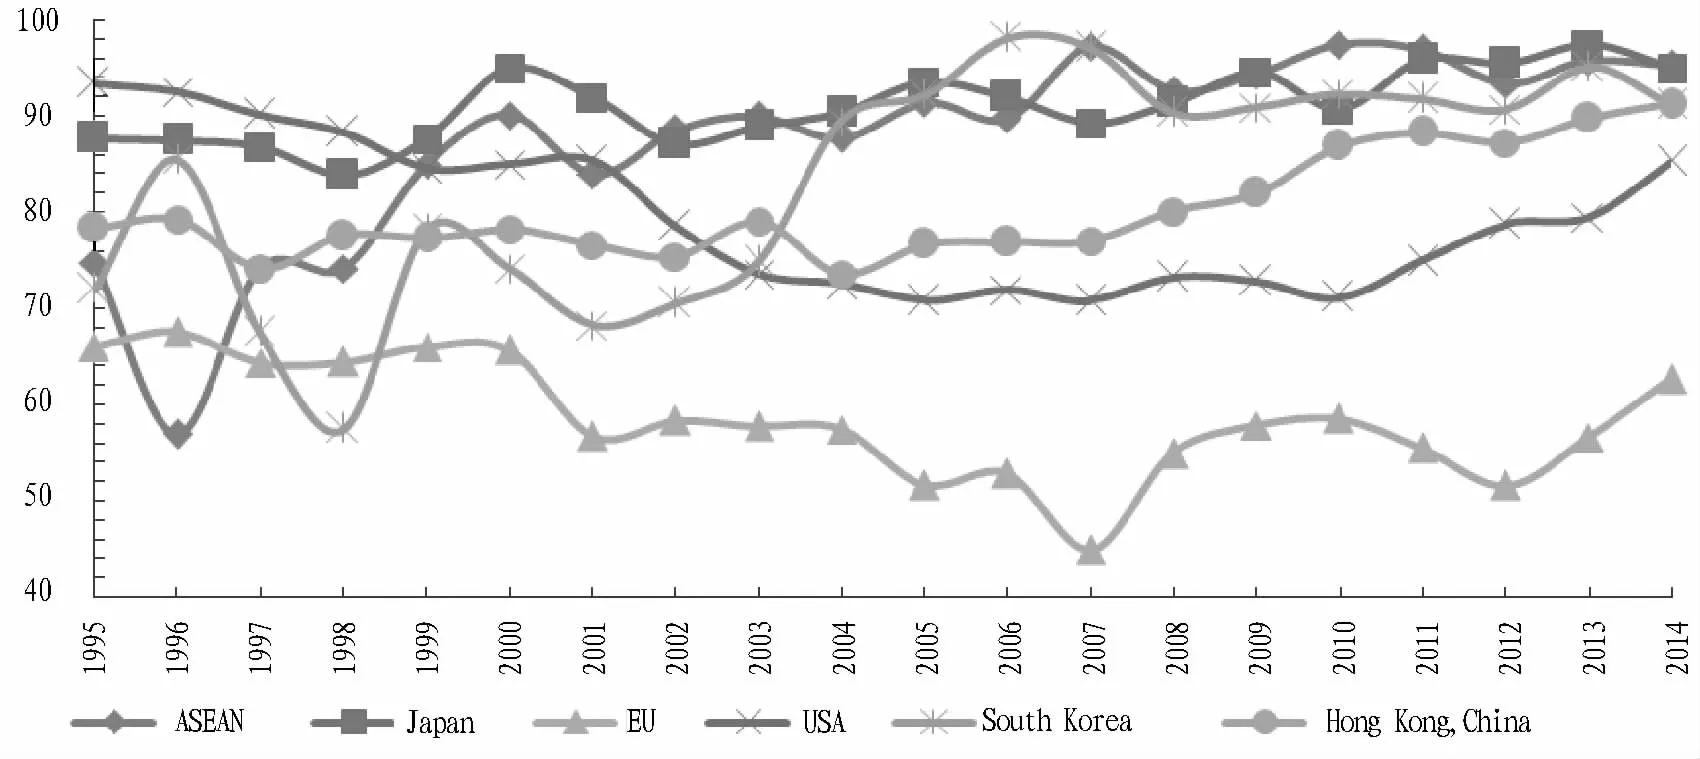
Fig.1 Curve chart for agricultural product export similarity index of China and Australia in the third party market
Fig. 1 plots changes in agricultural product export similarity index of China and Australia in the third party market. From Fig. 1, the similarity between Chinese and Australian agricultural products is highest in Japanese market, followed by the ASEAN market, and the lowest is in the EU market. Since 1999, the export similarity index of China and Australia in the ASEAN market has been at high level. The export similarity index in the EU market declines in 1995-2007, and rises in 2007-2014. The export similarity index in the US market generally declines in 1995-2014, while the situation is opposite in Hong Kong market. In South Korean market, the export similarity index takes on rising trend from 1998.
4 Analysis on complementarity of Sino-Australian agricultural product trade
4.1Revealedcomparativeadvantage(RCA)indexThere is huge difference in resource endowment between China and Australia. China is rich in labor resource, while Australia is rich in agricultural resources. Thus, the comparative advantage of agricultural products is different. To make overall analysis on comparative advantage of agricultural product trade between China and Australia, we employedRCAindex introduced by Balassa[10].RCAindex can be expressed as follows:
(2)
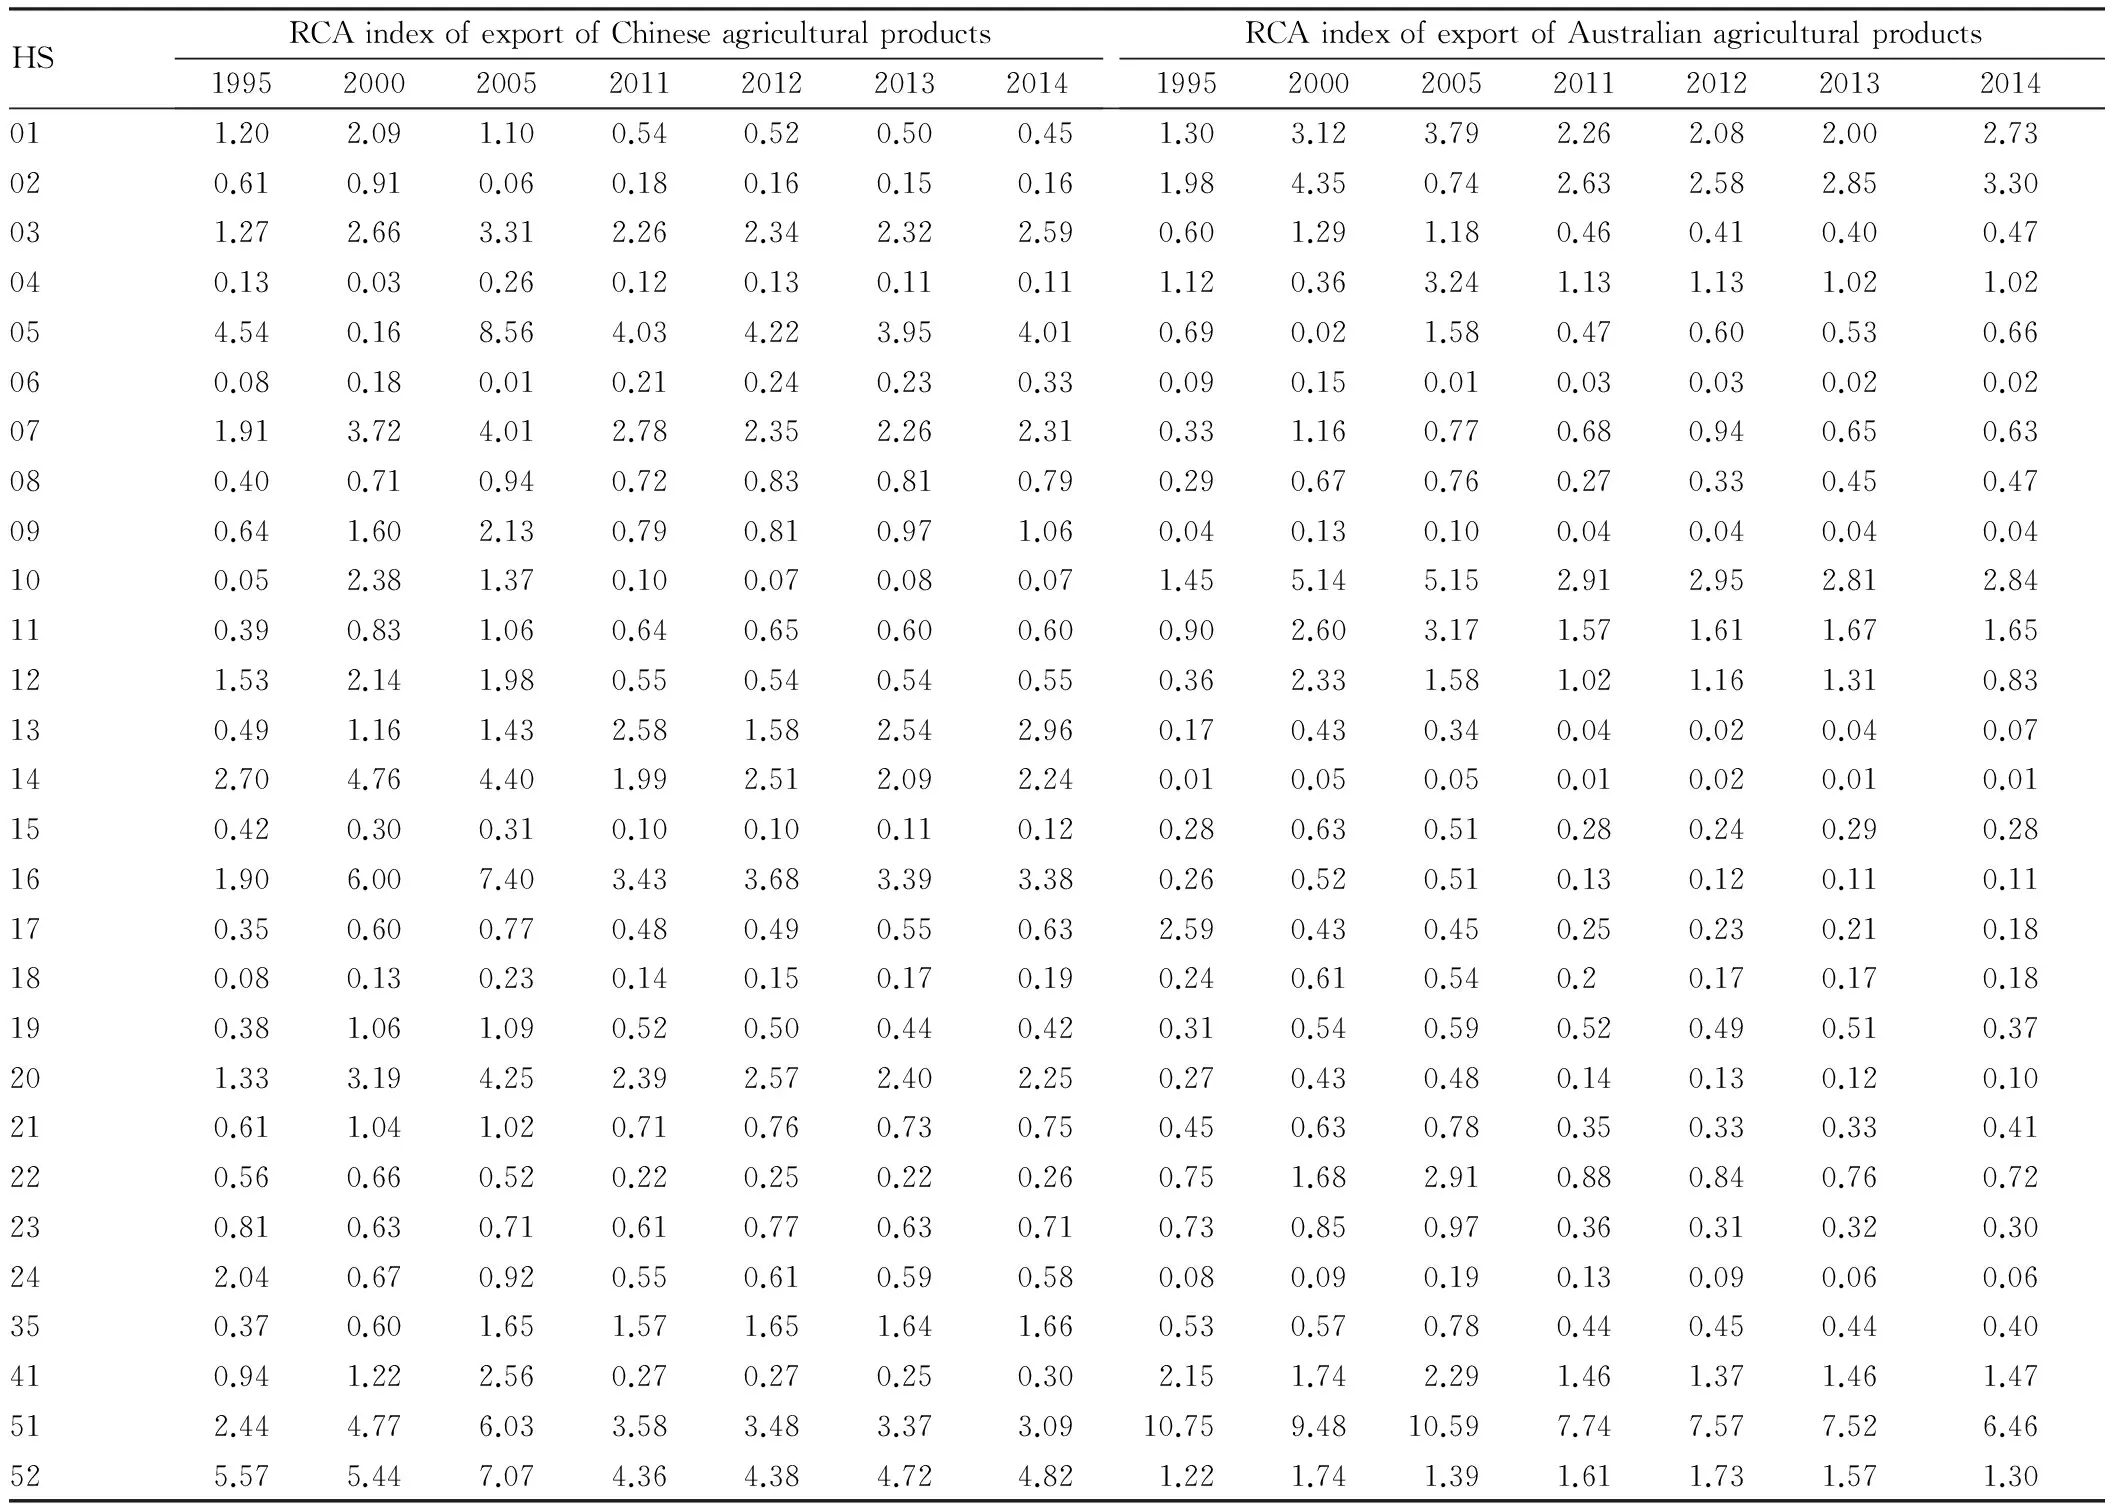
Table3RCAindexofexportofSino-Australianagriculturalproducts
HSRCAindexofexportofChineseagriculturalproducts1995200020052011201220132014RCAindexofexportofAustralianagriculturalproducts1995200020052011201220132014011.202.091.100.540.520.500.451.303.123.792.262.082.002.73020.610.910.060.180.160.150.161.984.350.742.632.582.853.30031.272.663.312.262.342.322.590.601.291.180.460.410.400.47040.130.030.260.120.130.110.111.120.363.241.131.131.021.02054.540.168.564.034.223.954.010.690.021.580.470.600.530.66060.080.180.010.210.240.230.330.090.150.010.030.030.020.02071.913.724.012.782.352.262.310.331.160.770.680.940.650.63080.400.710.940.720.830.810.790.290.670.760.270.330.450.47090.641.602.130.790.810.971.060.040.130.100.040.040.040.04100.052.381.370.100.070.080.071.455.145.152.912.952.812.84110.390.831.060.640.650.600.600.902.603.171.571.611.671.65121.532.141.980.550.540.540.550.362.331.581.021.161.310.83130.491.161.432.581.582.542.960.170.430.340.040.020.040.07142.704.764.401.992.512.092.240.010.050.050.010.020.010.01150.420.300.310.100.100.110.120.280.630.510.280.240.290.28161.906.007.403.433.683.393.380.260.520.510.130.120.110.11170.350.600.770.480.490.550.632.590.430.450.250.230.210.18180.080.130.230.140.150.170.190.240.610.540.20.170.170.18190.381.061.090.520.500.440.420.310.540.590.520.490.510.37201.333.194.252.392.572.402.250.270.430.480.140.130.120.10210.611.041.020.710.760.730.750.450.630.780.350.330.330.41220.560.660.520.220.250.220.260.751.682.910.880.840.760.72230.810.630.710.610.770.630.710.730.850.970.360.310.320.30242.040.670.920.550.610.590.580.080.090.190.130.090.060.06350.370.601.651.571.651.641.660.530.570.780.440.450.440.40410.941.222.560.270.270.250.302.151.742.291.461.371.461.47512.444.776.033.583.483.373.0910.759.4810.597.747.577.526.46525.575.447.074.364.384.724.821.221.741.391.611.731.571.30
Data source: arranged and calculated using UN Comtrade database.
From Table 3, we can see that China has higher competitive advantage in Chapter 05 (products of animal origin), Chapter 13 (gums and other vegetable saps and extracts), Chapter 16 (meat products), Chapter 51 (animal hair), Chapter 52 (cotton); China has high competitive advantage in Chapter 03 (fish products), Chapter 07 (edible vegetables and certain roots and tubers), Chapter 14 (vegetable products), Chapter 20 (various vegetable, fruit, and nuts), and Chapter 35 (protein and processed starch products); China has certain competitive advantage in Chapter 08 (edible fruit and nuts), and Chapter 09 (coffee, tea, and mate and spices). Australia has higher competitive advantage in Chapter 02 (meat and edible meat offal), Chapter 10 (cereals), Chapter 51 (animal hair), has high competitive advantage in Chapter 01 (live animals), Chapter 41 (raw hides and skins, leather), Chapter 52 (cotton), and has certain competitive advantage in Chapter 04 (dairy products and edible products of animal origin) and Chapter 12 (oil seeds & oleaginous fruits). From Table 4, we can see that products with export volume in top ten are basically those with competitive advantages. Combining Table 3 and Table 4, it can be seen that there are huge differences in agricultural products with competitive advantages and types of exported agricultural products between China and Australia, showing Sino-Australian agricultural products are highly complementary.
4.2ComplementarityindexIf exported products of a country coincide with imported products of another country, large scale production will bring potential benefit to both countries. In this study, we employed the complementarity index[11]to measure the complementarity of agricultural products of China and Australia. This index can be expressed as follows:
(3)
(4)
Table4Two-digitcodeagriculturalproductswithexportvolumeintoptenofSino-Australianbilateraltrade

RankChinaexportingtoAustralia20102011201220132014RankAustraliaexportingtoChina20102011201220132014120202016161515152511020316162003210525152513160303032034141100252421211921214521041100251919211919515150241416070717171761922221212717170707087221919220480808080807801020104019353535353590401151922102452521122100212040119
Data source: arranged and calculated using UN Comtrade database.
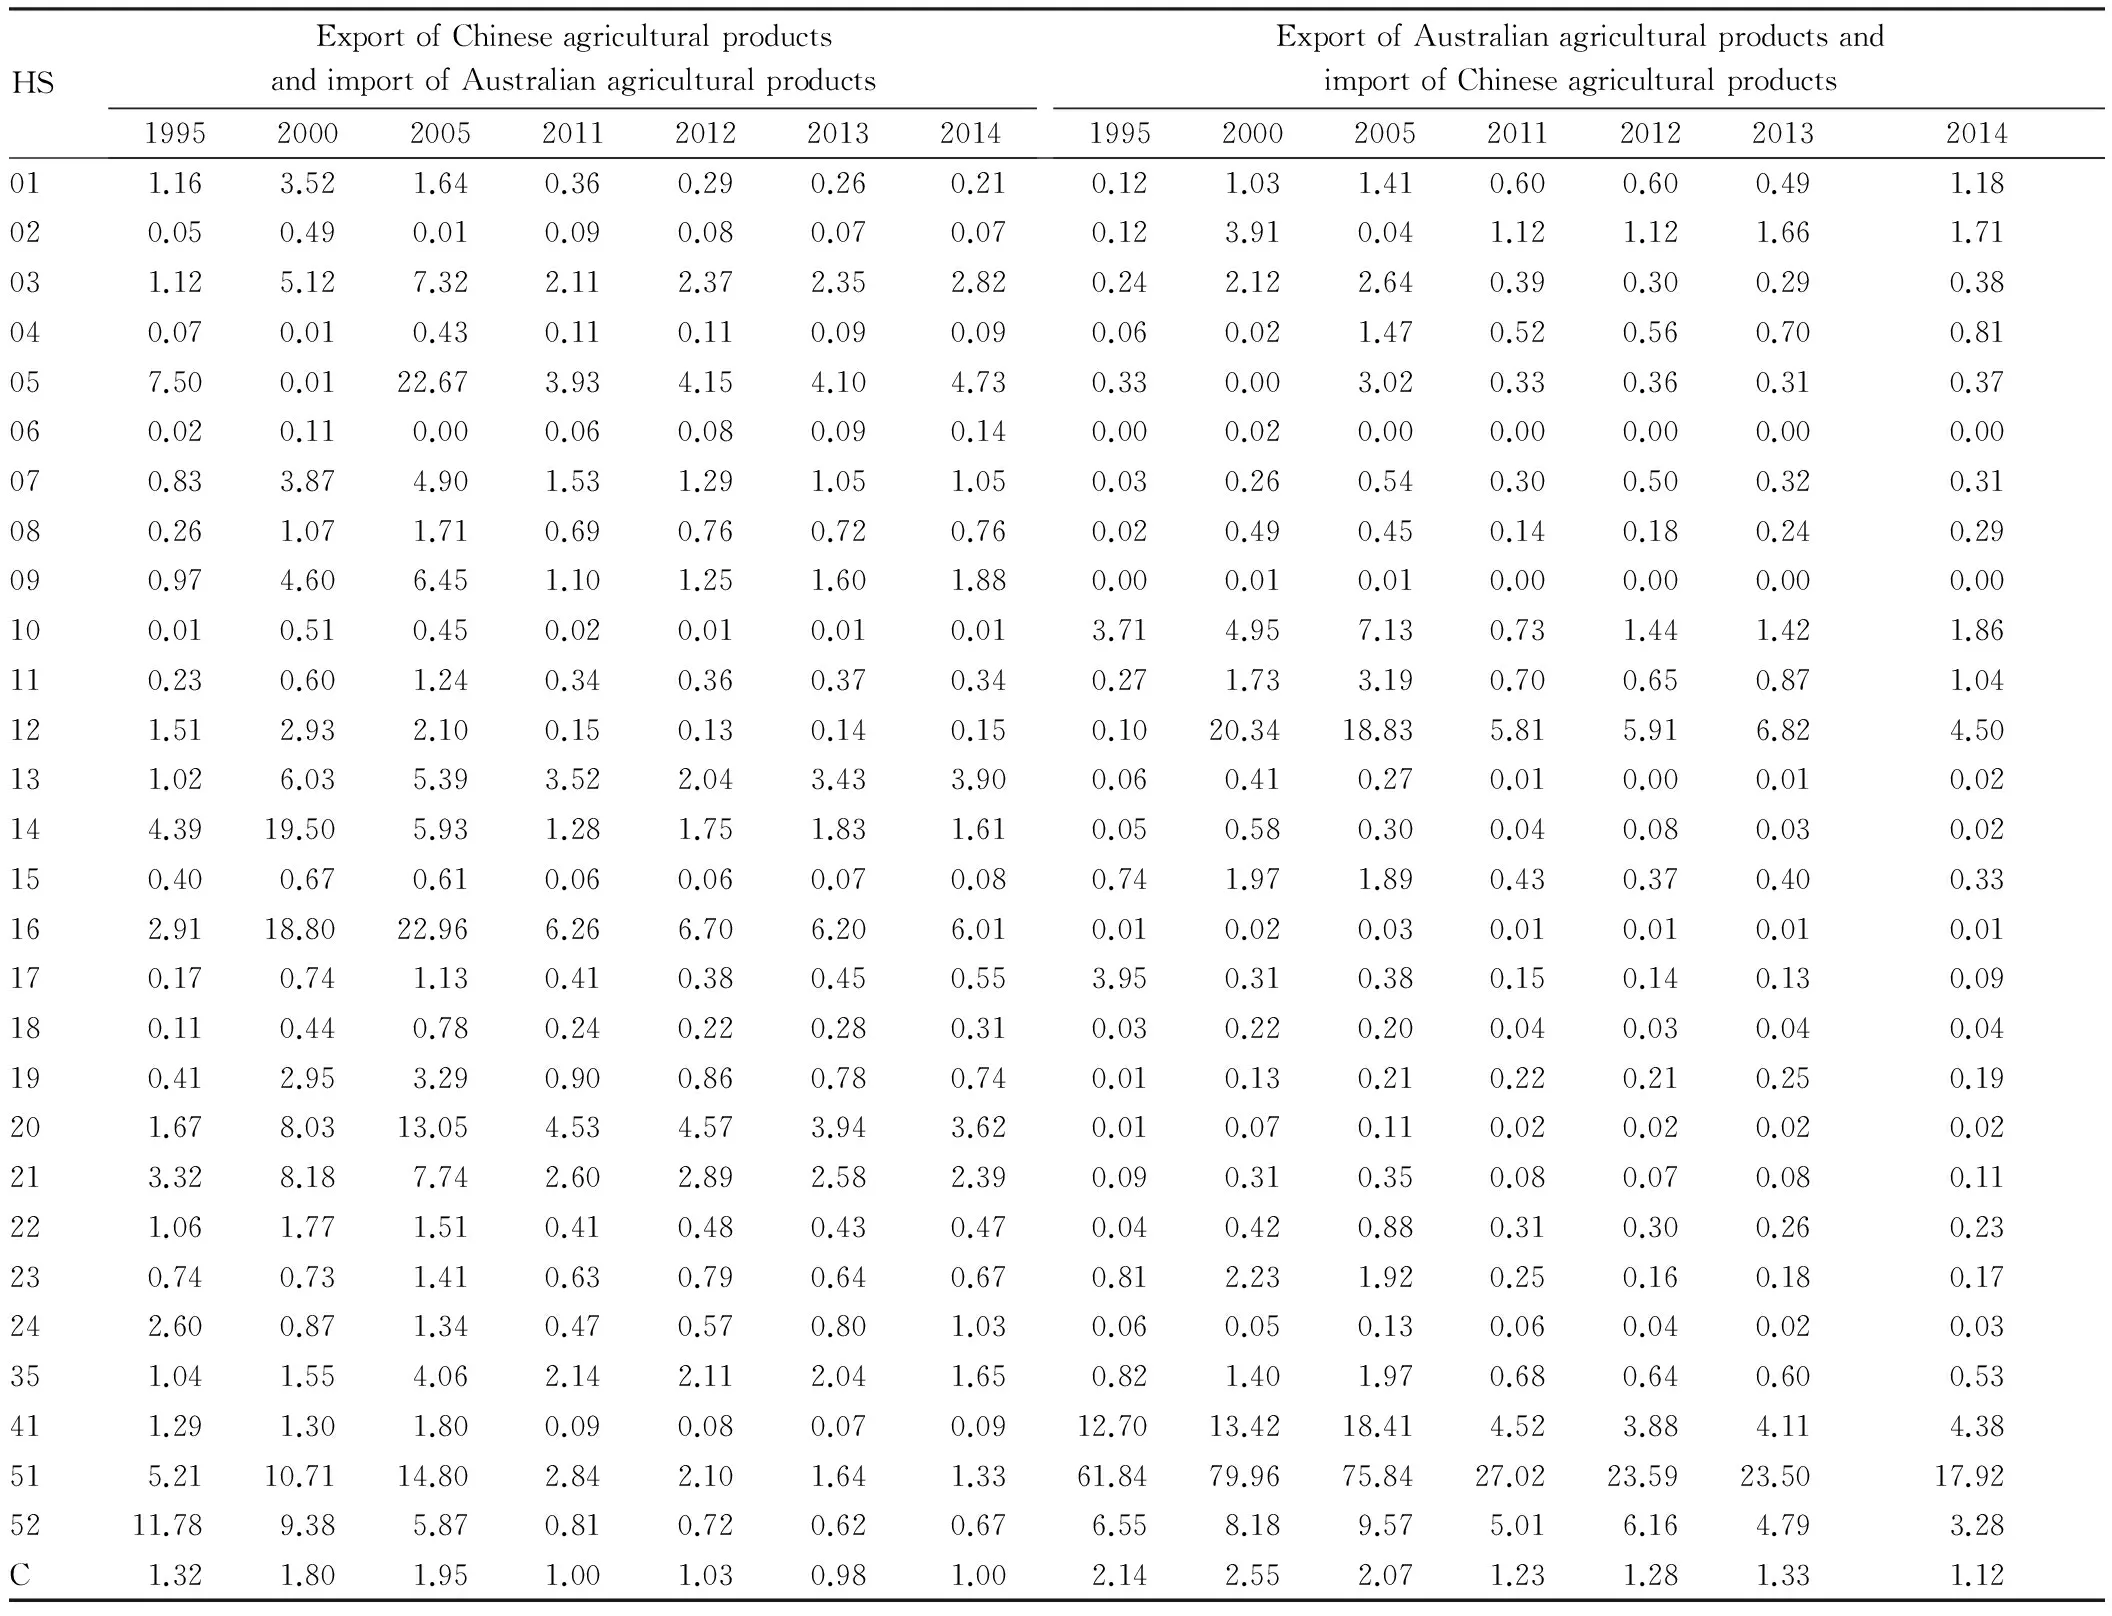
Table5ThetradecomplementarityindexofSino-Australianagriculturalproducts
HSExportofChineseagriculturalproductsandimportofAustralianagriculturalproducts1995200020052011201220132014ExportofAustralianagriculturalproductsandimportofChineseagriculturalproducts1995200020052011201220132014011.163.521.640.360.290.260.210.121.031.410.600.600.491.18020.050.490.010.090.080.070.070.123.910.041.121.121.661.71031.125.127.322.112.372.352.820.242.122.640.390.300.290.38040.070.010.430.110.110.090.090.060.021.470.520.560.700.81057.500.0122.673.934.154.104.730.330.003.020.330.360.310.37060.020.110.000.060.080.090.140.000.020.000.000.000.000.00070.833.874.901.531.291.051.050.030.260.540.300.500.320.31080.261.071.710.690.760.720.760.020.490.450.140.180.240.29090.974.606.451.101.251.601.880.000.010.010.000.000.000.00100.010.510.450.020.010.010.013.714.957.130.731.441.421.86110.230.601.240.340.360.370.340.271.733.190.700.650.871.04121.512.932.100.150.130.140.150.1020.3418.835.815.916.824.50131.026.035.393.522.043.433.900.060.410.270.010.000.010.02144.3919.505.931.281.751.831.610.050.580.300.040.080.030.02150.400.670.610.060.060.070.080.741.971.890.430.370.400.33162.9118.8022.966.266.706.206.010.010.020.030.010.010.010.01170.170.741.130.410.380.450.553.950.310.380.150.140.130.09180.110.440.780.240.220.280.310.030.220.200.040.030.040.04190.412.953.290.900.860.780.740.010.130.210.220.210.250.19201.678.0313.054.534.573.943.620.010.070.110.020.020.020.02213.328.187.742.602.892.582.390.090.310.350.080.070.080.11221.061.771.510.410.480.430.470.040.420.880.310.300.260.23230.740.731.410.630.790.640.670.812.231.920.250.160.180.17242.600.871.340.470.570.801.030.060.050.130.060.040.020.03351.041.554.062.142.112.041.650.821.401.970.680.640.600.53411.291.301.800.090.080.070.0912.7013.4218.414.523.884.114.38515.2110.7114.802.842.101.641.3361.8479.9675.8427.0223.5923.5017.925211.789.385.870.810.720.620.676.558.189.575.016.164.793.28C1.321.801.951.001.030.981.002.142.552.071.231.281.331.12
Data source: arranged and calculated using UN Comtrade database.
From Table 5, complementary agricultural products between export of China and import of Australia include Chapter 03 (fishes), Chapter 05 (products of animal origin), Chapter 07 (edible vegetables and certain roots and tubers), Chapter 09 (coffee, tea, and mate and spices), Chapter 13 (gums and other vegetable saps and extracts), Chapter 14 (vegetable products), Chapter 16 (meat products), Chapter 21 (mixed and unmixed products), Chapter 35 (protein and processed starch products), and Chapter 51 (animal hair). There is strong complementarity in Chapter 05 (products of animal origin), Chapter 16 (meat products), Chapter 20 (various vegetable, fruit, and nuts), and Chapter 51 (animal hair). The complementarity index of export of Chinese agricultural products and import of Australian agricultural products is higher than 1 in most years, indicating there is high complementarity between export of Chinese agricultural products and import of Australian agricultural products. However, since 2005, this index takes on declining trend, possibly because, because since China’s entry to WTO, production factors such as land, capital and labor, flow to manufacturing industry, international competition some agricultural products becomes weaker[9]. According to classification of agricultural products, export of Australian agricultural products and import of Chinese agricultural products are highly complementary in Chapter 02 (meat and edible meat offal), Chapter 12 (cereals), Chapter 12 (oil seeds & oleaginous fruits), Chapter 41 (raw hides and skins, leather), Chapter 51 (animal hair), and Chapter 52 (cotton). The complementarity index of export of Australian agricultural products and import of Chinese agricultural products is greater than 1 in 1995-2014, indicating high complementarity, and this is higher than the complementarity index of export of Chinese agricultural products and import of Australian agricultural products.
5 Analysis on growth potential of Sino-Australian agricultural product trade
The trade intensity index is used to analyze closeness of trade relation between two trade partners. The higher the trade intensity index, the closer the trade relation. The calculation formula is as follows:
(5)

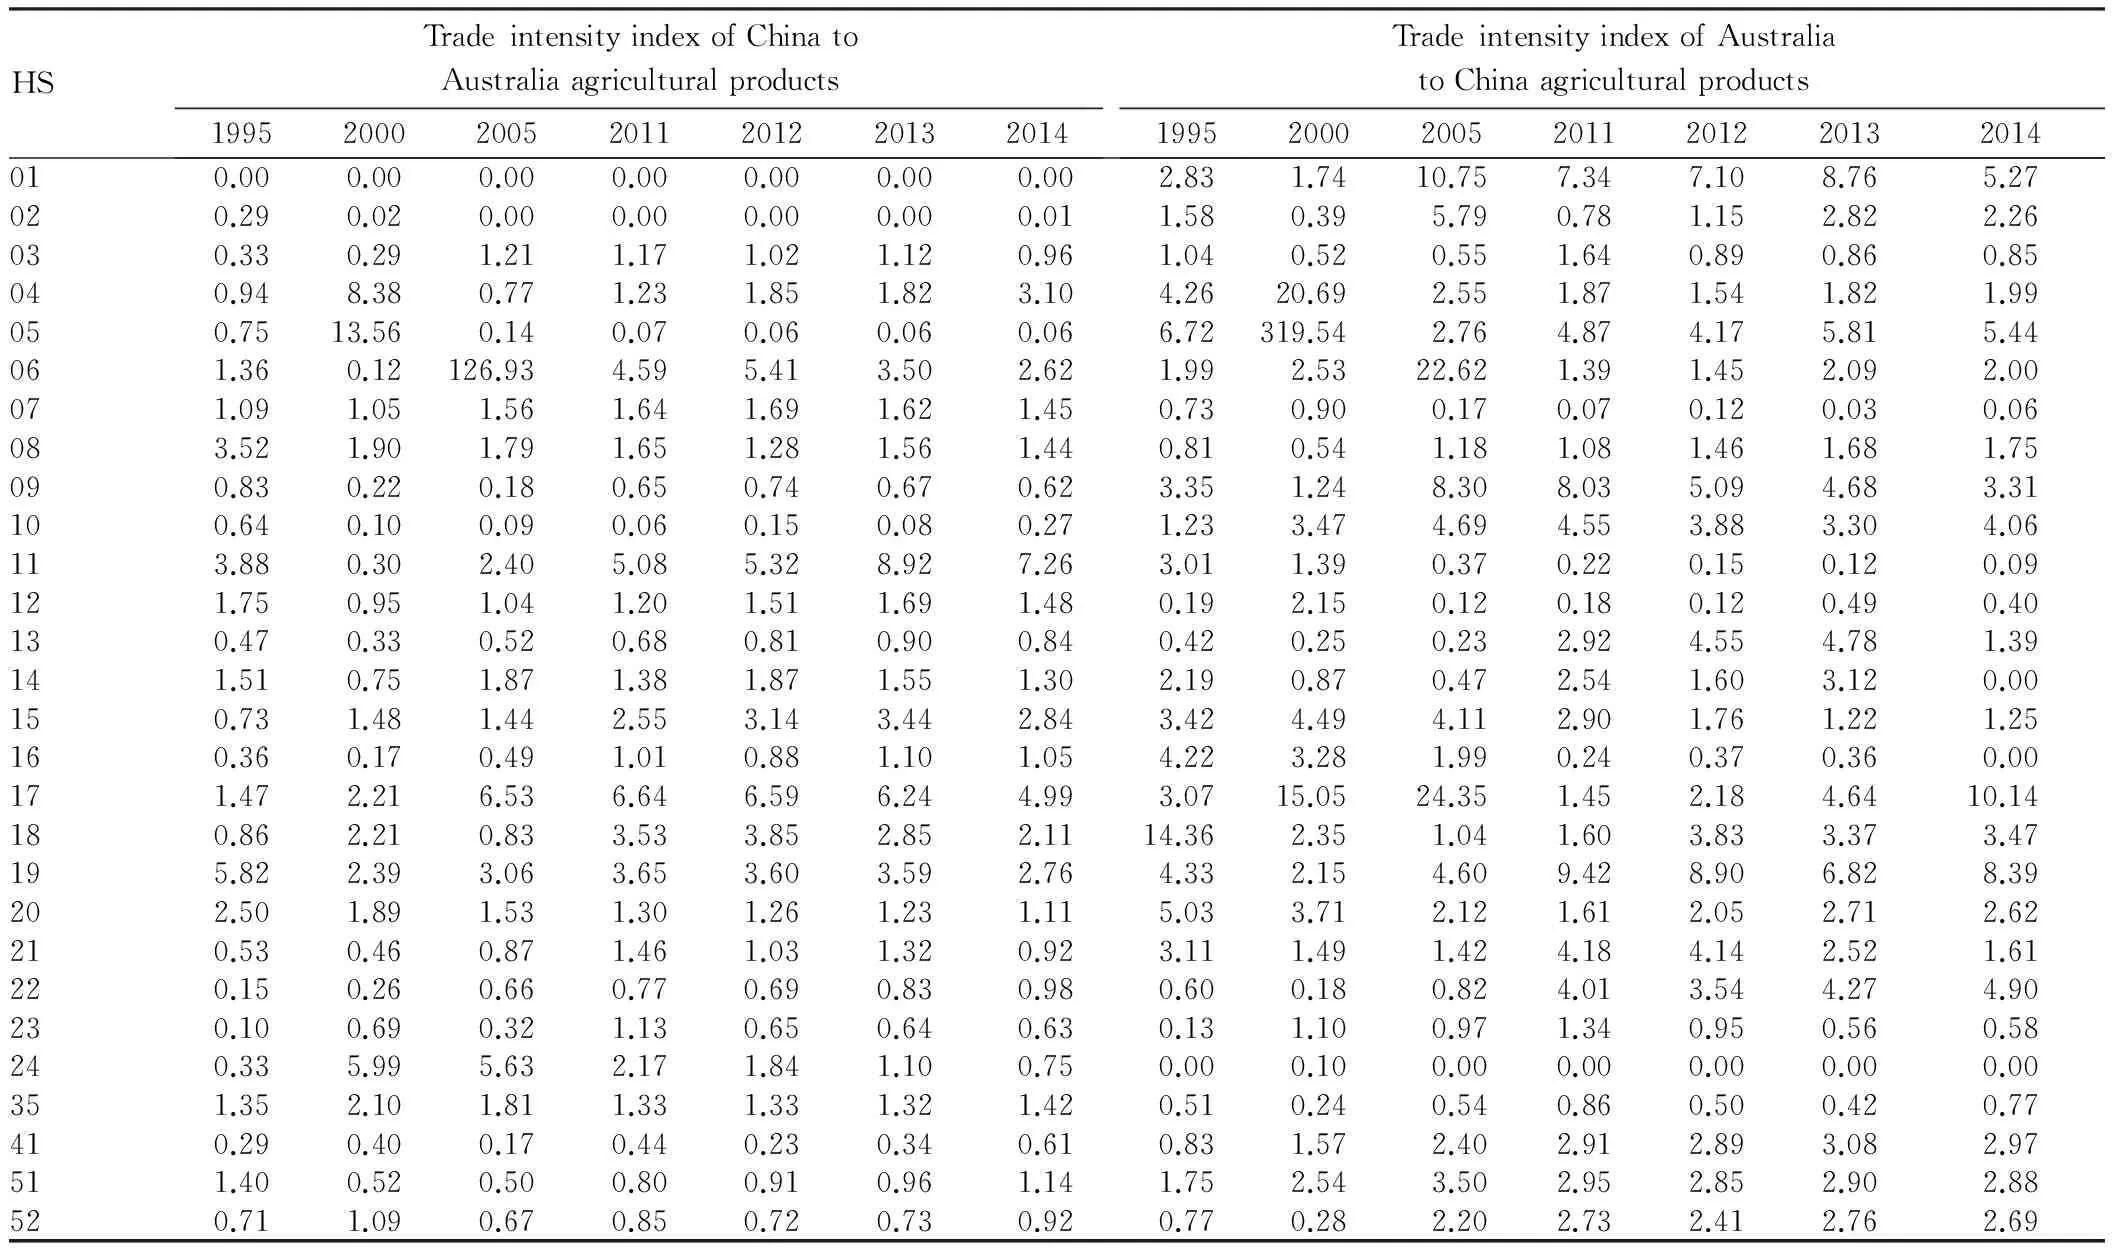
Table6ThetradeintensityindexofSino-Australianagriculturalproducts
HSTradeintensityindexofChinatoAustraliaagriculturalproducts1995200020052011201220132014TradeintensityindexofAustraliatoChinaagriculturalproducts1995200020052011201220132014010.000.000.000.000.000.000.002.831.7410.757.347.108.765.27020.290.020.000.000.000.000.011.580.395.790.781.152.822.26030.330.291.211.171.021.120.961.040.520.551.640.890.860.85040.948.380.771.231.851.823.104.2620.692.551.871.541.821.99050.7513.560.140.070.060.060.066.72319.542.764.874.175.815.44061.360.12126.934.595.413.502.621.992.5322.621.391.452.092.00071.091.051.561.641.691.621.450.730.900.170.070.120.030.06083.521.901.791.651.281.561.440.810.541.181.081.461.681.75090.830.220.180.650.740.670.623.351.248.308.035.094.683.31100.640.100.090.060.150.080.271.233.474.694.553.883.304.06113.880.302.405.085.328.927.263.011.390.370.220.150.120.09121.750.951.041.201.511.691.480.192.150.120.180.120.490.40130.470.330.520.680.810.900.840.420.250.232.924.554.781.39141.510.751.871.381.871.551.302.190.870.472.541.603.120.00150.731.481.442.553.143.442.843.424.494.112.901.761.221.25160.360.170.491.010.881.101.054.223.281.990.240.370.360.00171.472.216.536.646.596.244.993.0715.0524.351.452.184.6410.14180.862.210.833.533.852.852.1114.362.351.041.603.833.373.47195.822.393.063.653.603.592.764.332.154.609.428.906.828.39202.501.891.531.301.261.231.115.033.712.121.612.052.712.62210.530.460.871.461.031.320.923.111.491.424.184.142.521.61220.150.260.660.770.690.830.980.600.180.824.013.544.274.90230.100.690.321.130.650.640.630.131.100.971.340.950.560.58240.335.995.632.171.841.100.750.000.100.000.000.000.000.00351.352.101.811.331.331.321.420.510.240.540.860.500.420.77410.290.400.170.440.230.340.610.831.572.402.912.893.082.97511.400.520.500.800.910.961.141.752.543.502.952.852.902.88520.711.090.670.850.720.730.920.770.282.202.732.412.762.69
Data source: arranged and calculated using UN Comtrade database.
From Table 6, we can see that export level of China to Australia is higher than import share of Australia from the world market in Chapter 04 (dairy products and edible products of animal origin), Chapter 06 (live trees and other plants), Chapter 07 (edible vegetables and certain roots and tubers), Chapter 08 (edible fruits and nuts), Chapter 11 (products of the milling industry, malt, starches), Chapter 12 (oil seeds and oleaginous fruits), Chapter 14 (vegetable products), Chapter 15 (animal or vegetable fats and oils and their cleavage products prepared edible fats), Chapter 17 (sugars and sugar confectionery), Chapter 18 (cocoa and cocoa preparations), Chapter 19 (preparations of cereals, flour, starch or milk), Chapter 20 (preparations of vegetables, fruits, nuts or other parts of plants), and Chapter 35 (albuminoidal substances, modified starches), showing close trade relation between China and Australia in these products. The trade intensity of agricultural products of Australia to China is higher than that from China to Australia. The export level of Australia to China is higher than the import level of China from the world market in Chapter 01 (live animals), Chapter 02 (meat and edible meat offal), Chapter 04 (dairy produce and edible products of animal origin), Chapter 05 (products of animal origin), Chapter 06 (live trees and other plants), Chapter 08 (edible fruits and nuts), Chapter 09 (coffee, tea, mate and spices), Chapter 10 (cereals), Chapter 13 (gums, resins and other vegetable saps and extracts), Chapter 15 (animal or vegetable fats and oils and their cleavage products), Chapter 17 (sugars and sugar confectionery), Chapter 18 (cocoa and cocoa preparations), Chapter 19 (preparations of cereals, flour, starch or milk), Chapter 20 (preparations of vegetables, fruits, nuts of other parts of plants), Chapter 21 (miscellaneous edible preparations), Chapter 22 (beverages, spirits, and vinegar), Chapter 41 (raw hides and skins and leather), Chapter 51 (animal hair), and Chapter 52 (cotton), showing close trade relation between China and Australia in these agricultural products. On the whole, agricultural products showing close relation between China and Australia have strong complementarity. Combining Table 3, China has comparative advantage in Chapters 03, 05, 09, 13, 16, 51, and 52, but Sino-Australian trade relation in these products is not close. Besides, the total bilateral trade volume is not high and the complementarity is not brought into full play, indicating that there is huge growth potential in trade of agricultural products.
6 Conclusions
Using the HS92 two-digit code data in UN Comtrade database of Sino-Australian agricultural product trade from 1995 to 2014, the export similarity index, index of revealed comparative advantage, trade complementarity index and trade intensity index, we discussed the current situations of Sino-Australian agricultural product trade from the perspective of competition, complementarity and the growth potential. We came up with following conclusions. (i) The competition degree of Sino-Australian agricultural product trade after China’s entry to the WTO becomes mitigated. (ii) There is high similarity in export market of Chinese and Australian agricultural products, mainly concentrated in six markets, highest in Japanese market, followed by the ASEAN market, and the lowest is in the EU market. (iii) There are huge differences in agricultural products with competitive advantages and types of exported agricultural products between China and Australia, showing Sino-Australian agricultural products are highly complementary. (iv) The export of Australian agricultural products and import of Chinese agricultural products are highly complementary, and the complementarity index is greater than that of export of Chinese agricultural products and import of Australian agricultural products. (v) China and Australia exhibits close trade relations in many agricultural products and there is a strong complementarity between them, but part of the competitive agricultural trade relationship is not close, and the two countries have great potential in the agricultural product trade.
[1] ZHOU CY. The comparison and cooperation of Chinese citrus industry[J].China Fruit News,2005(7):4-7.(in Chinese).
[2] PENG KM, QI CJ, LEI HZ. The calculation on the competition and complementarity of fruit and processed goods trade in China and Australia[J].China Price,2006(7):55-67.(in Chinese).
[3] LIU LF, LIU HG. Analysis on the current situation and prospect of trade in China and Australia[J].World Economy Study,2006(5):45-50.(in Chinese).
[4] ZHOU HY. Study on the complement of agricultural products trade between China and Australia[J].World Agriculture,2014(9):105-108.(in Chinese).
[5] CHEN XY, ZHU J. Analysis on the export competition of agricultural products between China and India[J].World Economy Study,2006(4):52-58.(in Chinese).
[6] SUN ZL, LI XD. Agricultural product trade development between China and India upon economic globalization: An empirical analysis based on trade complementarities, trade competitiveness and growth potentiality[J]. Journal of International Trade,2013(12):68-78. (in Chinese).
[7] GLICK R,ROSE AM. Contagion and trade:Why are currency crises regional [J].Journal of International Money and Finance ,1999,18(4):603-617.
[8] TANG B. On the trade of agricultural products between China and other BRICS:The comparative advantage and cooperative potential[J]. Issues in Agricultural Economy ,2012(10):67-76.(in Chinese).
[9] TANG B, CHEN J. An analysis on the complementarity and competitiveness of electromechanical trade between China and India[J].Asia-pacific Economic Review,2012(5):65-69.(in Chinese).
[10] BALASSA B. Trade liberalization and revealed comparative advantage[J]. Manchester School of Economics and Social Studies,1965, 33(2):99-123.
[11] YU JP. Comparative advantage and trade complementarity between China and other Asian economics[J].The Journal of World Economy,2003(5):33-40.(in Chinese).
[12] KOJIMA K. The pattern of international trade among advanced countries[J].Hitotsubashi Journal of Economics,1964,5(1):16-36.
杂志排行
Asian Agricultural Research的其它文章
- On the Government’s Responsibility in China’s Rural Land Transfer
- Is the Farmland of China Sufficient?
——Analysis Based on the Second National Land Survey - Research on Management Mode of Small-scale Irrigation Works for Farmland Based on Self-governance
- Industrial Upgrade, Vocational Ability and Migrant Worker Education and Training
- A Study of Soil Nutrients in the Terrace Field Changed from Mountain Slope in Three Gorges Reservoir Region
- Influence of Transplantation in Different Stage on Growth and Yield of Spring Maize in Shanxi Early Mature Area
