Extreme Learning Machines Based on Least Absolute Deviation and Their Applications in Analysis Hard Rate of Licorice Seeds
2015-12-13LimingYangJunjianBaiandQunSun
Liming Yang,Junjian Baiand Qun Sun
Extreme Learning Machines Based on Least Absolute Deviation and Their Applications in Analysis Hard Rate of Licorice Seeds
Liming Yang1,2,Junjian Bai1and Qun Sun3
Extreme learning machine(ELM)has demonstrated great potential in machine learning and data mining fields owing to its simplicity,rapidity and good generalization performance.In this work,a general framework for ELM regression is first investigated based on least absolute deviation(LAD)estimation(called LADELM),and then we develop two regularized LADELM formulations with the l2-norm and l1-norm regularization,respectively.Moreover,the proposed models are posed as simple linear programming or quadratic programming problems.Furthermore,the proposed models are used directly to analyze the hard rate of licorice seeds using near-infrared spectroscopy data.Experimental results on eight different spectral regions show the feasibility and effectiveness of the proposed models.
Extreme learning machine,robust regression,least absolute deviation estimation,near-infrared spectroscopy
1 Introduction
Extreme learning machine(ELM)[Huang,Siew,and Zhu(2006)]is a popular and important learning algorithm for single-hidden-layer feed forward neural networks(SLFNs)[Huynh and Won(2008);Tiago,Francisco,Rui,and Carlos(2014);Huang,Song,and You(2015)],and has been successfully applied in regression and classification problems.Compared with traditional neural networks,the main advantages of ELM are that it runs fast and is easy to implement.Its hidden nodes and input weights are randomly generated and the output weights are expressed analytically.ELM overcomes some drawbacks of traditional neural networks,such as local minima,imprecise learning rates and slow convergence rates[Deng,Zheng,and Chen(2009);Zhang and Luo(2015);Zhua,Miao,and Qing(2014)].ELM outputs its weights based on the least-squares estimation(LSE)[Xiang,Nie,Meng,Pan,and Zhang(2012)],but LSE is known to be highly sensitive to outliers.Therefore the traditional ELM is sensitive to noise and outliers,which may lead to poor performance.To tackle this drawback,the robustness of ELM has been investigated recently.For example,Huynh and Won proposed a weighted ELM[Huynh and Won(2008)],Deng et al.presented a regularized ELM[Deng,Zheng,and Chen(2009)],Zhang et al.developed an approximation algorithm[Zhang and Luo(2015)],and Horata et al.proposed robust ELM formulations to reduce the effects of outliers[Horata,Chiewchanwattana,and Sunat(2013);Zhua,Miao,and Qing(2014)].These researches show that ELM is obviously affected by outliers,and thus reducing the effect of outliers is extremely important and necessary to build a robust ELM.
Least-absolute-deviation(LAD)estimation[Cao and Liu(2009);Yang,Liu,and You(2011)]is more resistant to outliers than least-squares estimation.The regression coefficients of LAD are estimated by minimizing the sum of the absolute values of the residuals,which involves nonsmooth optimization problem.Thus there are relatively few researches in LAD.
Inspired by LAD strategy,we present in this investigation a robust ELM regression framework based on LAD estimation.Two regularized LADELM formulations are developed.Furthermore,the proposed models are reformulated as convex programming with low computational burden.
Near-infrared(NIR)spectroscopy[Wang,Xue,and Sun(2012);Yang,Gao,and Sun(2015)]is based on the absorption of electromagnetic radiation ranging from 4000 to 12000cm-1.NIR spectra can provide rich information on molecular structure.Recently,NIR spectroscopy has demonstrated great potential in the analysis of complex samples owing to its simplicity,rapidity and nondestructivity,and has been successfully applied to analyze the chemical ingredients or quality parameters of compounds.
Licorice is a traditional Chinese herbal medicine.Its seed is characterized by hardness.Usually,the hard rate of licorice-seed is determined by soaking the seeds,although this method is time-consuming and sometimes destroys the seeds.Therefore,developing a fast and nondestructive analysis technique for determining hard rate of licorice seeds is important and could promote the application of hard seeds in cultivation.
The main contributions of this work are summarized as follows:
·We first present an ELM framework based LAD regression(called LADELM)and then develop two regularized LADELM formulations with l2-norm and l1-norm regularization respectively.
·We reformulate the proposed models into as simple linear programming or quadratic programming problems with global solutions.
·The proposed models can yield robust solutions and thus are more resistant to outliers.
·The proposed methods are directly applied to analyze the hard rate of licorice seeds using NIR spectroscopy data.
Throughout the paper we adopt the following notations.An arbitrary dimension vector of ones is denoted by e and|·|denotes absolute value operator.
The rest of the paper is organized as follows:Section 2 briefly summarizes ELM.Section 3 proposes a robust ELM framework based on LAD.Section 4 further develop two regularized LADELM formulations.Experiments for licorice-seed hard rate are analyzed in Section 5.Finally,we conclude this work and provide some ideas for future research in Section 6.
2 Background
2.1 Extreme learning machine(ELM)
ELM is a type of SLFNs and has been successfully applied to both classification and regression problems.Here,we give a brief definition of ELM regression;a more detailed description of ELM is available in the literature[Huang,Siew,and Zhu(2006);Jose,Martinez,and Pablo(2011)].
The essence of ELM is that its hidden-layer parameters are not necessarily tuned,and training error is minimized.Specifically,given a set of N patterns:{(xi,ti),xi∈Rn,ti∈ R,i=1,···,N},where xiis the input vector,and tiis the target value.The goal of regression problem is to find a relationship between xiandti,(i=1,···,N).We expect to find a standard SLFN with L hidden nodes to approximate these N patterns with zero error,which means that the desired output for the j-th pattern is

where wiis the weight vector connecting the i-th hidden node with the input node,and bidenotes the bias term of the i-th hidden node.The βiis the output weight from the i-th hidden node to the output node.The g(x)is an activation function and g(wi·xj+bi)is the output of the i-th hidden node.The linear system(1)is equivalent to the following matrix equation


where β =(β1,β2,···,βL)T.H is defined as the hidden layer output matrix,the i-th column of which is the i-th hidden node output with respect to the input xi.The T is the desired output.
Huang et al.pointed out that the input weights wiand hidden layer biases bifor the SLFN are not necessarily tuned during training and may be assigned values randomly.Based on this scheme,Huang et al.proposed a simple SLFN algorithm,called ELM,the goal of which is to find a least-squares solution of the linear system(2).This can be posed as the following optimization

which is a normal quadratical programming with no constraints.With HTH being positive definite,its optimal solutionˆβ can be obtained by

where H†is the Moore-Penrose generalized inverse of matrix H.The regression function of ELM is given by

2.2 Regularized extreme learning machine
To prevent overfitting data,the regularized ELM were investigated in literature[Deng,Zhang,and Chen(2009);Jose,Martinez,and Pablo(2011)].A type version of the regularized ELM models is

whereµ>0 is a tuning parameter that balances l2-norm regularization and empirical error.The problem(6)is also a convex optimization and thus it has global optimal solution.Whenµ=0,it is equivalent to the original ELM.Thus,model(6)is an expansion of the traditional ELM(3).
3 Extreme learning machine based on LAD method(LADELM)
Least-squares estimation(LSE)is suitable for the situations where the distribution of residual error assumes as a zero-mean Gaussian distribution.However in practical applications,this assumption is unrealistic.Least absolute deviations(LAD)method is more resistant to outliers and noise than LSE.LAD estimation,as a robust alternative to LSE,can overcome the shortcoming of LSE.Thus we replace the l2-norm with the l1-norm in ELM regression(3)to obtain a robust ELM based on LAD,called LADELM:

This involves a nonsmooth problem,and thus it is generally difficult to optimize.In the following section,we reformulate this problem as a linear programming.
Specifically,by introducing an additional variable z∈Rnwith component zj(j=1,···,N)such that the absolute values of the components for vector Hβ -T satisfy:

then problem(7)can be reformulated as the following constrained optimization in variable(β,z)

This is a linear programming and can be quickly solved.LADELM(7)can yield a robust solution since it is based on LAD strategy.Thus LADELM(7)is more resistant to outliers and noise.
Given a set of training samples{(xi,ti),i=1,...,N},the algorithm for LADELM(7)is summarized as follows:
Algorithm 1
·Choose a suitable hidden-layer units number L and an activation function g(x).Assign randomly the hidden-unit parameters(wi,bi),i=1,...,L.
·Calculate the hidden layer output matrix H.

ptimal solution of LADELM(7).
4 Regularized extreme learning machine based on LAD method
In this section,we consider two regularized LADELM regression formulations with l2-norm and l1-norm regularization respectively.
4.1 Regularized extreme learning machine based on LAD method
To prevent over fitting data,we add the l2-norm regularization into the objective function of LADELM(7),and then obtain a regularized LADELM,called LADRELM

where C>0 is a tuning parameter that balances l2-norm regularization and empirical error.Similarly,by introducing an additional variable p with components pj(j=1,···,N)satisfying

the problem(10)is posed as the following optimization in variable(β,p)

This is a quadratic program problem with global optimal solution,and thus it is easy to solve.In this investigation,we only report the numerical simulation results for this problem.WhenC=0,problem(10)is equivalent to the original LADELM(7).Thus RLADELM(10)is an expansion of LADELM.Moreover,LADRELM is superior to the regularized ELM(6)by obtaining a robust solution.
4.2 Sparse extreme learning machine based on LAD method
In this section,we consider a sparse LADELM model based on the l1-norm regu-larization.In particular,we incorporate the robust l1-norm(‖β‖1)into the objective function for LADELM(7),and then get a sparse LADELM(called LADSELM)

Where parameter λ>0 balances the empirical risk and the l1-norm of the output vector β.Similarly,by introducing an additional variable q with components qjsatisfying:

the problem(13)is reformulated as

Furthermore,by adding a variable u with components ujsatisfying|βi|≤ ui,LADSELM(13)can be expressed as:

This is also a linear programming in variable(β,q,u)and can be quickly solved.Note that LADSELM(13)is entirely different from the traditional regularized ELM(6)which is based on LSE and the l2-norm regularization.The main benefits of the proposed LADSELM are summarized as follows:
·LADSELM is superior to the traditional ELM(3)because it is based on LAD.Thus it leads to a more robust solution and can reduce the sensitivity against outliers and noise.
·One appealing feature of l1-norm regularization is that it can force sparsity.Thus LADSELM can yield a sparse model representation since it incorporates the l1-norm regularization into its objective function.Therefore,LADSELM can control the tradeoff between the number of hidden-layer nodes and the empirical risk.
·LADSELM has low computational burden,only requiring to solve a linear programming.
Given a set of training samples{(xi,ti),i=1,...,N},according to the analysis above,the algorithm for solving LADSELM(13)summarized as follows:
Algorithm 2
·Choose a suitable activation functiong(x)and the number of hidden nodes L.Assign randomly hidden-layer parameters(wi,bi),i=1,...,L.
·Calculate the hidden layer output matrixH.
·Solve the linear programming(16)to obtain the output weightˆβ.
5 Experiments
5.1 Sample set
The licorice seeds used in this experiment were harvested between 2002 and 2007,from various locations within China,including the Xinjiang municipality,Ningxia province,Inner-Mongolia municipality,Gansu province,Shanxi province and Heilongjiang province.The licorice-seed hard rate varied from 0.3%to 99.3%.After removing impurities,the seeds were put in a sample pool with the a diameter of 50mm.A total of 112 licorice seeds were used in the experiment.
The NIR spectra were acquired by using a spectrometer fitted with a diffuse reflectance fiber probe.Spectra were recorded over a range of 4000 to 12000cm-1with a resolution of 8cm-1.Each spectrum was the average of 32 scans.This procedure was repeated four times for each sample:twice from the front at different locations and twice from the rear at different locations.A final spectrum was taken as the mean spectrum of these four spectra.Consequently,the spectral data set contains 112 samples measured at 2100 wavelengths in the range of 4000 to 12000cm-1.The NIR spectra of the licorice seeds are shown in Figure 1.
To evaluate the performance of the proposed models,numerical experiments are carried out on eight different spectral regions:4000-6000cm-1,6000-8000cm-1,8000-10000cm-1,10000-12000cm-1,6000-10000cm-1,4000-8000cm-1,4000-10000cm-1and 4000-12000cm-1;denoted A-H,respectively.Information on them is summarized in Table 1.
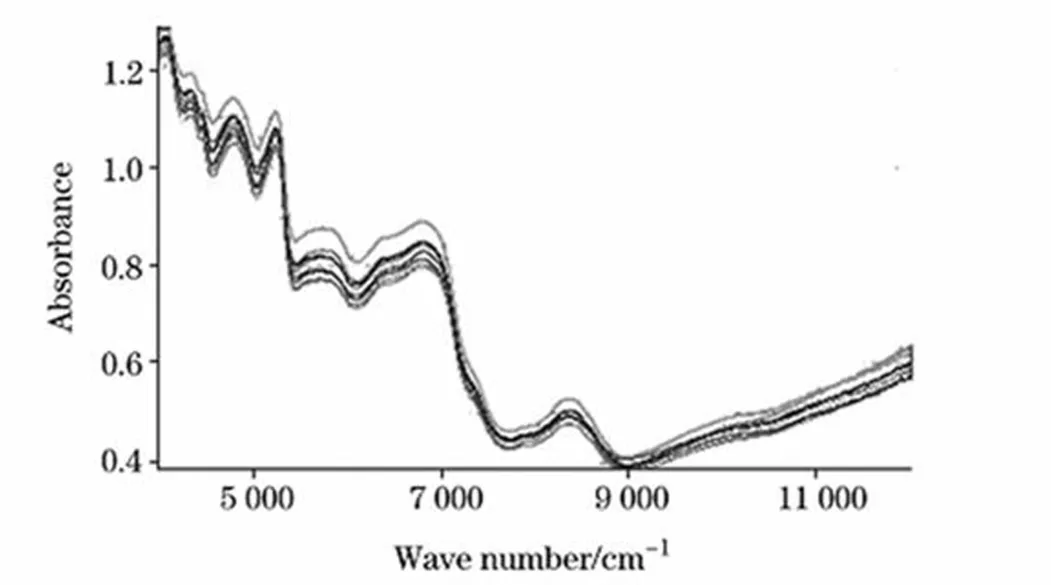
Figure 1:The near-infrared spectra of licorice samples.
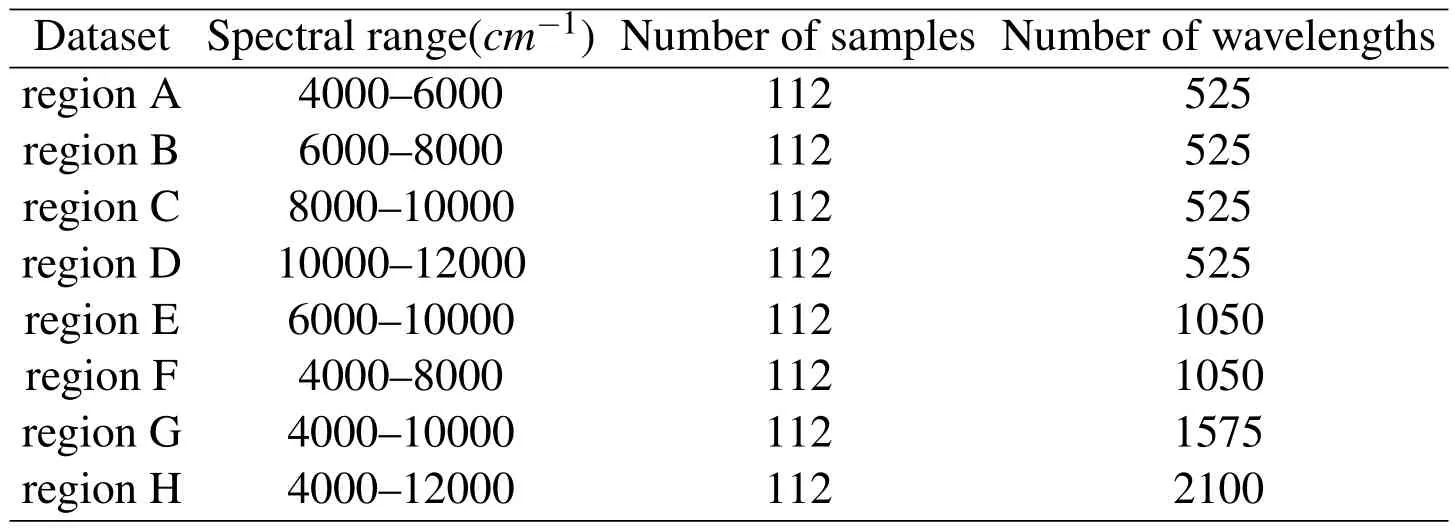
Table 1:Near-infrared spectral sample regions of licorice seeds
5.2 Software and computing
We use MATLAB2012a to analyze the experiment results.The initial spectra were digitized by OPUS 5.5 software.After digitization,each spectrum in the 4000-12000cm-1wavelength range was represented as a column vector;the length of the vector was defined by the number of wavelengths.The following toolboxes were used in this investigation:
MATLAB Statistics Toolbox.
MATLAB Linear Programming Toolbox.
MATLAB Quadratic Programming Toolbox.
5.3 Experimental design

·SSE:the sum-squared error of test,defined as

SSE represents the fitting precision.Generally,the smaller the SSE,the better the estimation.However,an excessively small SSE value means that the regressor is probably overfitting.
·SST:the sum-squared deviation of test samples,defined as

SST reflects the underlying variance of the test samples.
·SSR:the sum-squared deviation,defined as

SSR reflects the explanation ability of the regressor.A larger SSR means that more statistical information was obtained from the test samples.
·SSE/SST:the ratio of the SSE to the SST of the test samples.
·SSR/SST:the ratio of the SSR to the SST of the test samples.
In general,a small SSE/SST means the estimates are consistent with the real values.Typically the SSR/SST increases as the SSE/SST decreases.In fact,an extremely small value for the SSE/SST is not desirable because it probably means that the regressor is overfitting.Therefore,a good estimator should strike the balance between the SSE/SST and SSR/SST.
·Average percent of selected hidden nodes numbers(PSHN).

In this investigation,we select sigmoid function as the activation function in hidden layer.Moreover,we apply a tenfold crossvalidation to the experiments.
The parameter λ in LADSELM implements a tradeoff between the empirical risk and the number of hidden-layer nodes.In general,when λ is large,the risk minimization is predominant leading to smaller regression error.Thus,the parameter λ should be optimized beforehand.The relationship between the SSE and parameter λ is illustrated in Fig.2,from which we know that the SSE decreases when λ goes from 1 to 1000;at the same time,LADSELM produces smaller errors when λ > 1000.These findings help to select the value of λ in the following benchmark experiments.
In addition,the performance of the proposed LADELM and LADRELM also depends on the choice of the number of hidden nodes L.In this work,the value L is adjusted from the set{20,40,60,80,100,112,500,1000}by a tenfold crossvalidation.In each spectral region,the SSE is calculated and the optimal L is selected to minimize the SSE.The parameter L in the other models is set to be the same as LADELM.
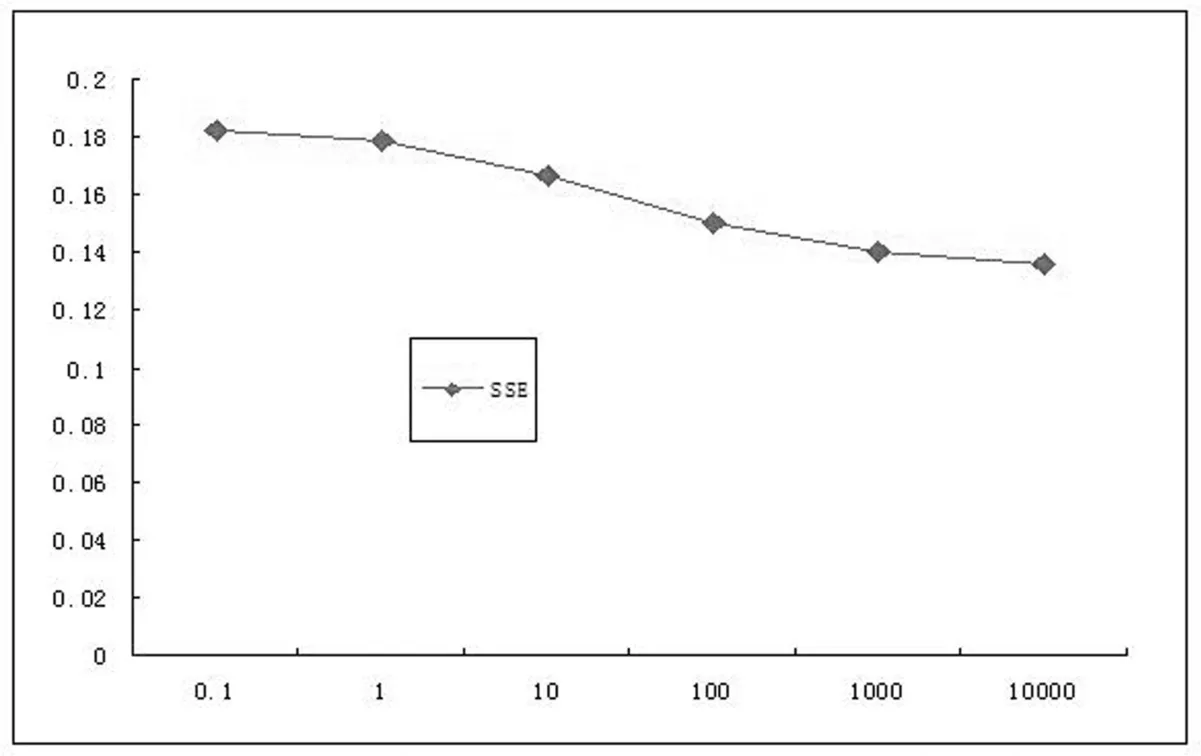
Figure 2:SSE versus parameter λ for LADSELM in region F.
For comprehensive evaluation,we compare the proposed models with the following baseline models:LSE,ELM,LAD,robust ELM(RELM)[Horata,Chiewchanwattana,and Sunat(2013)]and linear support vector regression(SVR)[Sangwook,RheeMan,and Minho(2015)]with parameter ε=0.001.Experiment results on eight different spectral regions are reported in Table 2.To examine the sparseness of LADSELM,the average value of the PSHN is used as a measure of performance.We compare the performance of ELM,LADELM and LADSELM in the four broad spectral regions E,F,G,and H.Moreover,we choose two different valuesL,L=sample numbers andL=the number of wavelengths.The average value of the PSHN on tenfold cross-validation is reported in Table 3.In addition,we compare the proposed models with other models(LSE,LAD,SVR,ELM and RELM)with respect to the percent reduction in the SSE for LADELM and LADSELM.And the results are illustrated in Fig.3 and Fig.4 respectively.
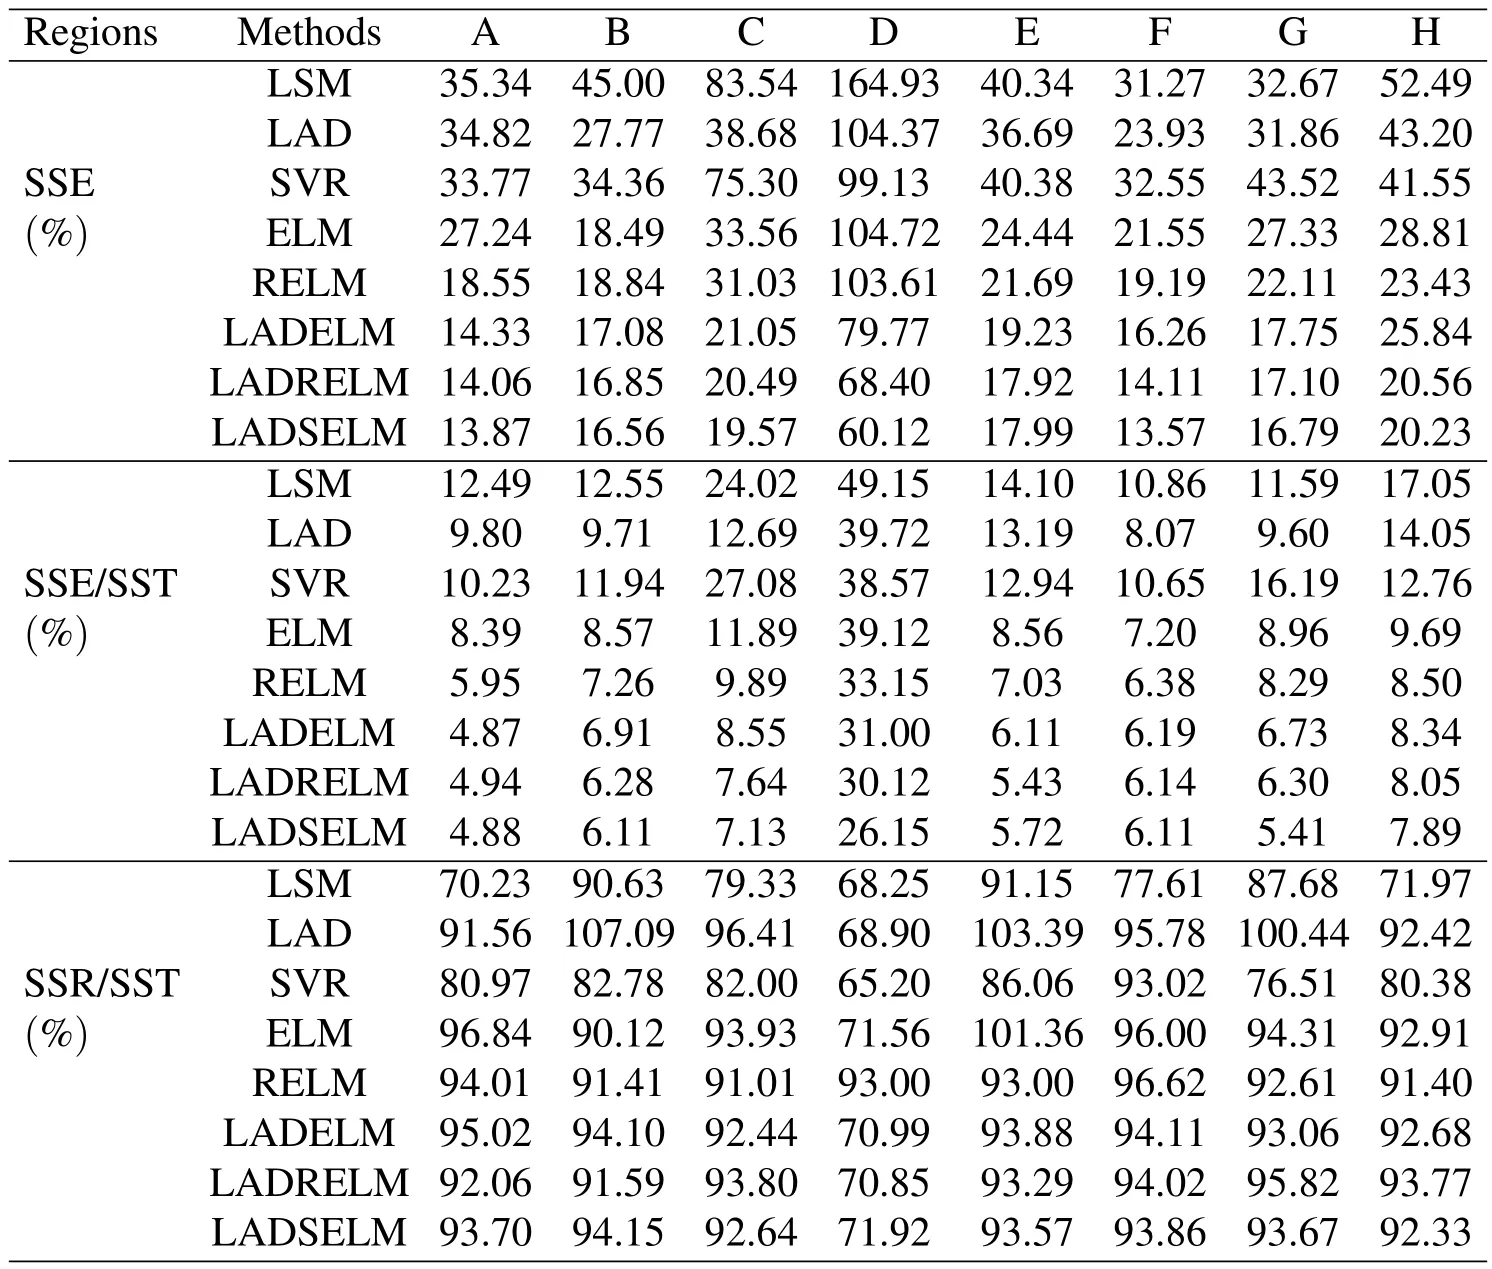
Table 2:Comparisons of eight algorithms:LSM,LAD,SVR,ELM,RELM,LADELM,LADRELM and LADSELM in linear case.

Table 3:Comparisons of LAD,ELM and LADELM in terms of PSHN.
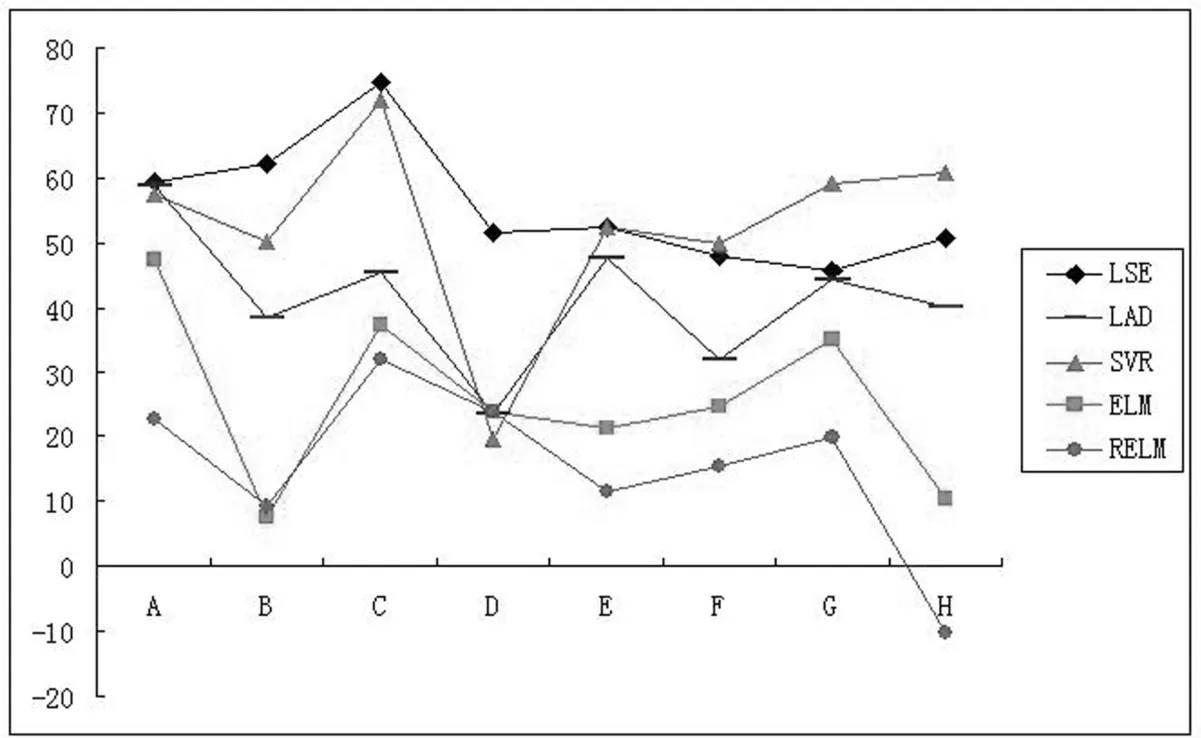
Figure 3:Percent reduction in the SSE of LADELM versus other models.
5.4 Experiment results
5.4.1Comparisons of the proposed models with other models
As expected,the above results show that the proposed models perform satisfactorily.The results are summarized as follows:
·Comparisons of the proposed models with the baseline models:LSE,LDA and SVR
Compared with the baseline models(LSE,LAD and SVR),the above results show that the proposed models(LADELM(7),LADRELM(10)and LADSELM(13))achieve remarkable improvements in generalization for all eight spectral ranges.
Compared with LSE,the proposed LADELM,LADRELM and LADSELM decrease averagely the SSE by 55.59%,59.48%and 60.77%,respectively.Especially,in the high-frequency region C,the values of the SSE decrease by 74.80%,75.47%and 76.57%,respectively.At the same time,three models reduce the SSE/SST and SSR/SST in all eight spectral regions.Especially in region C,LADSELM and LADSELM decrease averagely the SSE/SST by 64.4%,68.19%and 70.31%,respectively.Moreover the SSR/SST decreases more than 90%in seven of eight spectral regions.
Compared with SVR,the proposed LADELM and LADSELM decrease averagely the SSE by 52.74%and 56.32%,respectively.Meanwhile,the performance of LADSELM and LADSELM are significantly superior to SVR in terms of the SSE/SST and SSR/SST analysis.
Compared with LAD,the proposed LADELM,LADRELM and LADSELM reduce averagely the SSE by 41.33%,46.42%and 48.39%,respectively.In terms of the SSE/SST,the proposed LADELM and LADSELM outperform clearly LAD in all eight spectral regions.
·Comparisons of the proposed models with the traditional ELM models
As expected,Table 2 illustrates that the proposed models achieves better performance than the traditional ELM(3)in all eight regions.To be more specific,compared with ELM,the proposed models,LADELM,LADRELM and LADSELM,decrease averagely the SSE by 25.92%,32.27%and 34.48%,respectively.Moreover,three proposed models outperform clearly the ELM(3)with respect to the SSR/SST.Especially in the two high-frequency regions C and D,the proposed LADSELM decreases the SSE/SST by 40.03%and 33.15%,respectively.At the same time,the three proposed model outperform ELM with respect to the SSR/SST in six of the eight regions.
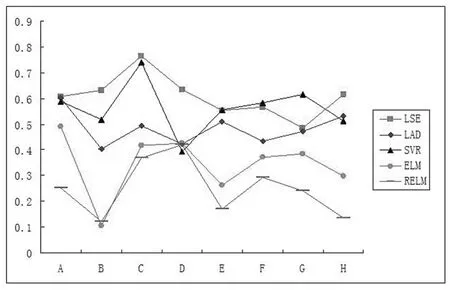
Figure 4:Percent reduction in the SSE of LADSELM versus other models.
·Comparisons of the proposed models with other robust ELM model
The performance of LADELM is superior to that of the robust ELM(RELM)[Horata,Chiewchanwattana,and Sunat(2013)]in seven of the eight spectral regions(the exception is region H).LADSELM yields smaller regression error than RELM,and decreases averagely SSE by 25.04%in eight regions.Compared with RELM in the two high-frequency regions C and D,LADSELM decreases the SSE by 36.93%and 41.97%respectively,and decreases the SSE/SST by 9.63%and 21.11%respectively.Finally,the performance of LADSELM is similar to that of RELM with respect to SSR/SST.
·Comparisons of ELM,LADELM,and LADSELM with respect to the PSHN.In terms of the PSHN criterion,Table 3 shows that the proposed LADSELM(13)outperforms significantly the ELM(3)and LADELM(7),whereas
LADELM performs slightly better than ELM(3)in four spectral regions.These results suggest that LADSELM can select fewer hidden-node numbers than LADELM and ELM.
5.4.2Comparisons of the three proposed models
The above results illustrate that the proposed LADSELM(13)and LADRELM(10)outperform LADELM(7)with respect to the SSE and SSE/SST in seven of eight regions,whereas there is no significant difference with respect to the SSR/SST.Compared with LADELM,two models LADSELM and LADRELM decrease averagely the SSE by 11.01%and 8.03%respectively.These results suggest that the regularized LADELM improves the generalization for analysis of the licorice-seed hard rate using NIR spectroscopic data.Moreover according to the above analysis,the effectiveness of the proposed methods can be arranged in the following order

6 Conclusions and Future Directions
We propose a robust ELM framework based on LAD regression.Moreover the proposed framework is used for the direct analysis the hard rate of licorice seeds using near-infrared spectroscopy data.We rigorously verify the proposed strategy in different spectral regions.The main results of this work are summarized as follows:
·A robust ELM framework is first proposed based on LAD regression,called LADELM.Then we develop two regularized LADELM formulations with thel2-norm andl1-norm regularization,respectively.
·The proposed models are more resistant to outliers and noise than the original ELM which is based on LSE.
·Compared with the original ELM,the proposed LADRELM improves regression accuracy.The proposed LADSELM can yield a sparse solution due to incorporatingl1-norm regularization in its objective function.
·Three proposed ELM models can be reformulated as simple linear programming or quadratic programming problem,and thus are easy to solve.
·The proposed models are applied directly to analyze licorice-seed hard rate using near-infrared spectroscopy technology.Experiments results in different spectral regions show that the proposed methods obtain better generalization than traditional methods.
Analyzing licorice-seed hard rate is an important part of seed testing.The results presented herein show that it is possible to analyze licorice-seed hard rate by using the proposed modles and near-infrared spectroscopy technology.We hope that this work will help further investigations of the hard rate of crop seeds and promote the application of hard seeds in cultivation.The question of building ELM classification framework based on LAD will be studied in the future work.
Acknowledgement:This work is supported by National Nature Science Foundation of China(11471010,11271367).
Cao,H.;Liu,X.(2009):System identification based on the least absolute criteria.Techniques of Automation and Applications,vol.28,no.7,pp.8-10.
Deng,W.;Zheng,Q.;Chen,L.(2009):Regularized extreme learning machine.in:IEEE Symposium on Computational Intelligence and Data Mining,CIDM’09,pp.389-395.
Horata,P.;Chiewchanwattana,S.;Sunat,K.(2013):Robust extreme learning machine.Neurocomputing,vol.102,pp.31-44.
Huang,G.B.;Siew,C.K.;Zhu,Q.Y.(2006):Extreme learning machine:Theory and applications.Neurocomputing,vol.70,pp.489-501.
Huang,G.;Huang,G.B.;Song,S.;You,K.(2015):You.trends in extreme learning machines:A review.Neural Netwokrs,vol.61,no.1,pp.32-48.
Huynh,H.T.;Won,Y.(2008):Weighted least squares scheme for reducing effects of outliers in regression based on extreme learning machine.International Journal of Digital Content Technology and its Applications,vol.2,no.3,pp.40-46.
Jose,M.;Martinez,M.;Pablo,E.M.(2011):Regularized extreme learning machine for regression problems.Neurocomputing,vol.74,pp.3716-3721.
Peng,X.(2010):TSVR:An efficient twin support vector machine for regression.Neural Networks,vol.23,no.3,pp.365-372.
Sangwook,K.;ZH.Yu.;RheeMan,K.;Minho,L.(2015):Deeplearning of support vector machines with class probability output networks.Neural Networks,vol.64,pp.19-28.
Tiago,M.;Francisco,S.;Rui,A.;Carlos,H.A.(2014):Learning of a singlehidden layer feedforward neural network using an optimized extreme learning machine.Neurocomputing,vol.129,pp.428-436.
Wang,Q.;Xue,W.;Sun,Q.(2012):Quantitative analysis of seed purity for maize using near infrared spectroscopy.Transaction of the Chinese Society of Agricultural Engineering,vol.28,pp.259-264.
Xiang,Sh.M.;Nie,F.P.;Meng,G.F.;Pan,Ch.H.;Zhang,Ch.G.(2012):Discriminative least squares regression for multiclass classification and feature selection.IEEE Transactions on Neural Networks and Learning Systems,vol.23,no.11,pp.1738-1754.
Yang,L.M.;Go,Y.P.,Sun,Q.(2015):A new minimax probabilistic approach and its application in recognition the purity of hybrid seeds.Computer Modeling in Engineering and Sciences,vol.104,no.6,pp.493-506.
Yang,M.;Liu,Y.;You,Zh.(2011):Estimating the fundamental matrix based on least absolute deviation.Neurocomputing,vol.74,pp.3638-3645.
Yang,L.M.;Sun,Q.(2012):Recognition of the hardness of licorice seeds using a semi-supervised learning method.Chemometrics and Intelligent Laboratory Systems,vol.114,pp.109-115.
Zhang,K.;Luo,M.(2015):Outlier-robust extreme learning machine for regression problems.Neurocomputing,vol.151,pp.1519-1527.
Zhua,W.;Miao,J.;Qing,L.(2014):Robust regression with extreme support vectors.Pattern Recognition Letters,vol.45,pp.205-210.
1College of Science,China Agricultural University,Beijing,100083,China.
2Corresponding author:Liming Yang;E-mail:cauyanglm@163.com
3College of Agriculture and Biotechnology,China Agricultural University,Beijing,100193,China
