Meta-analysis for psychiatric research using free soft ware R
2015-12-09DingGengCHEN
Ding-Geng CHEN
•Biostatistics in psychiatry (27)•
Meta-analysis for psychiatric research using free soft ware R
Ding-Geng CHEN
meta-analysis; fixed-effects model; random-effects model; bipolar disorder; lamotrigine
1. Introducti on
In all scientific fields there is an increasing importance placed on the synthesis of information and data from diverse studies to draw more reliable inferences and,thus, to arrive at more robust conclusions. This process of scientifically integrating diverse information is called‘systematic review’ and, when it involves generating overall results based on pooled data, is usually referred to as ‘meta-analysis’ (MA). The widespread use of MA– over 500 have been published in the New England Journal of Medicine over the last decade – has led to numerous important discoveries. Interested readers can refer to several recent books about MA: Whitehead,[1]Hartung,[2]Borenstein,[3]Pigott ,[4]and Chen and Peace.[5]MA has been widely used in psychiatry. This article introduces the classical fixed-effects and random-effects models in MA and uses a meta-analysis about the use of lamotrigine in bipolar disorder[6]as an example to illustrate the step-by-step implementation of MA using R, an open source statistical soft ware package that can be freely accessed from http://www.r-project.org.
2. Meta-analysis models
2.1 Fixed-effects MA model
A typical MA combines K independent studies in which the population effect-size (ES) δk(k = 1, 2, ..., K) is estimated using the observed ES, ˆkδ.These studies can be single-arm studies or multi ple-arm studies, randomized controlled studies or observational studies. The MA for the lamotrigine studies used as an example are twoarm studies, where the δkare the underlying population effect size between the treatment and control groups.
In fixed-effects meta-analysis (FE-MA), a strong assumption is that there is no between-study variation among the K studies regardless of where, when, with whom, and how the studies were conducted. This is the ‘homogeneity assumption’, which assumes that the underlying population effect sizes δkare constant across all studies (i.e., δ1= ...=δk=δ) and that the observed study effect sizes ˆkδ are a simple random sample from the population with a known sampling error. Therefore a typical FE-MA model can be described as
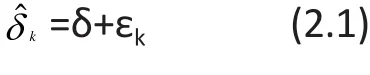
where εkrepresent the within-study variati ons and are assumed to be a normal distribution with mean 0 and a known variance σk2, that is, εk~N(0,σk2). Note that σk2for all included studies are assumed to be known in MA, which is very different from the assumptions in analysis of variance or regression models where the error variance is estimated. These variances from K studies can be calculated for dichotomized outcome variables (to be illustrated for the lamotrigine example)but for continuous target variables or other types of variables the variance usually needs to be estimated from previously reported literature. The meta-estimate for the global population ES (combining data from all the independent studies) can then be estimated using a weighted-mean method where the weights are the inverse of these known variances. That is:
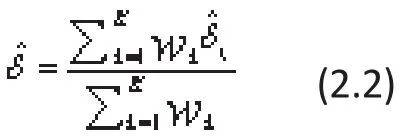
where ωk=1/σk2(k=1,...,K). The variance of this FE-MA global estimate of ES can be expressed as:

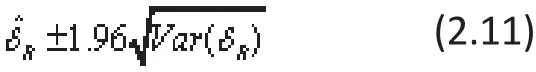
Using this weighted-mean estimate in (2.2) and its variance in (2.3), the 95% confidence interval for the global ES of δ can be constructed as:

and a test-statistic can be formulated as
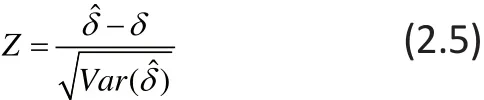
to test the hypothesis that the global ES is zero as H0:δ=0 versus Ha: δ≠0.
2.2 Random-effects MA model
The FE-MA is simple, but the fundamental homogeneity assumption of no between-study variati on is oft en too restrictive. Intuitively when we synthesize a group of studies with meta-analysis, we expect these studies to have enough in common to merit combining the information for statistical inference, but it is impractical to require that all included studies have identical true effect size. The homogeneity assumption in FEMA needs to be relaxed for practical applications of MA to include situations where there is betweenstudy variation in the true effect size of the studies included in the MA, that is, when the study results are‘heterogeneous’. The random-effects meta-analysis(RE-MA) model is used when the included studies are heterogeneous.
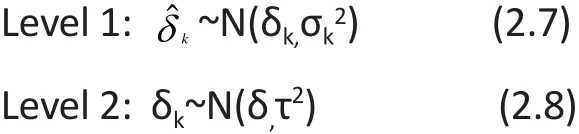
To incorporate heterogeneity as random-effects, it is assumed that the underlying population effect sizes δkare normally distributed with a global mean of δ and a between-study variance of τ2, that is, δk~N(δ,τ2).Therefore the FE-MA model in (2.1) can be extended to the RE-MA model as:

where νk~N(0, τ2). The RE-MA model in (2.6) can be also be expressed in a two-level model as follows:
The global population ES for RE-MA can be estimated using a weighted-mean methods similar to that in the FE-MA model (2.2), but the weights in RE-MA must incorporate both within-study variance(σk2) and between-study variance(τ2) as ωkR=1/(σk2+2ˆτ) where the subscript ‘R’ represents notations for the randomeffects meta-analysis model to distinguish them from notations for the fixed-effects meta-analysis model.With these new weights, the estimate of global ES in REMA is:

The variance of this RE-MA estimate can be expressed as:

The 95% con fi dence interval for the global ES of δ in REMA can be constructed using (2.9) and (2.10) as:
and a test-stati stic can be formulated as
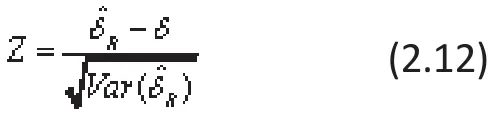
to test the hypothesis that the global ES is zero as H0:δ=0 versus Ha: δ≠0 in RE-MA.
To make use of the estimation in RE-MA from equati ons (2.9) to (2.12), the estimate of the betweenstudy variance τ2is required. There are several methods to estimate τ2, including the DerSimonian and Laird’s method of moments (MM),[8]the maximum likelihood estimation (MLE) method,[9]the restricted maximum likelihood (REML) method,[10]and the Sidik-Jonkman (SJ)estimator.[11]Among these estimators, MM and SJ are distribution-free and non-iterative, whereas both MLE and REML are parametric methods that need multiple iterations to estimate τ2. A discussion that compares these estimators can be found in the paper by Sidik and Jonkman.[12]
The most commonly used estimate is the DerSimonian-Laird method of moments which is also commonly called the Cochran-DerSimonian-Laird procedure. This estimate is given as:
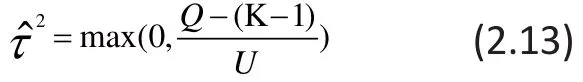
where U is a constant defined as Q is the weighted sum of squared errors defined asT his Q-stati stic is commonly used to test the statistical significance of heterogeneity across studies; it has a χ2distribution with K-1 degrees of freedom.
It is impossible for a group of independent studies to be identical in every respect, so even when the chi-square value for the Q-statistic suggests that the studies included in the review are homogeneous it is recommended that the RE-MA model be used to combine the results of the studies because this method considers both within-study and between-study variation.
3. Meta-analysis about lamotrigine for the treatment of bipolar depression
3.1. Data from five clinical trials on lamotrigine
Although there is definitive evidence of the long-term efficacy of lamotrigine in the maintenance treatment for bipolar I disorder, five placebo-controlled clinical trials of lamotrigine in the acute phase of the illness did not find statistically significant benefit of lamotrigine over placebo.[7]However, Geddes and colleagues[6]pooled the patient-level results of these five studies using MA to demonstrate that lamotrigine is, in fact, superior to placebo in the acute phase of bipolar I disorder. A comprehensive description of this analysis is provided in Chen and Peace,[5]but the following discussion will be limited to the part of the paper that pooled results for the Hamilton Rating Scale for Depression (HRSD)[13]from the five studies. In this analysis, a patient was considered a ‘responder’ if he or she experienced at least a 50%reduction from baseline in the HRSD. The basic results for the lamotrigine group and the control group from the five studies are shown in the first five columns of Figure 1; in this figure the ‘Total’ columns represent the sample size in each group and the ‘Events’ columns represent the number of individuals in each group who met the ‘responder’ criteria at the end of the trial.
3.2 Meta-analysis with risk-rati o
The purpose of meta-analysis is to combine individual estimates of treatment effect or effect sizes (ESs) across studies. If estimates of the treatment effect or effect size are not provided for the individual studies but the number of patients who respond to treatment are provided (as in this example), it is possible to calculate the effect size for each study and to subsequently pool the estimated effect sizes across all of the studies in a meta-analysis. For binomial outcome measures,such as response to treatment versus non-response to treatment, the most commonly use estimator of effect size is the risk-ratio. The risk-ratios for the studies included in the MA of the effectiveness of lamotrigine are defined as:
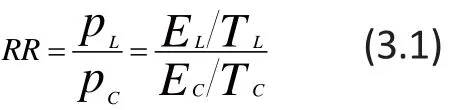

Figure 1. Forest plot for meta-analysis of five lamotrigine clinical trials
where the risk (i.e., the probability,p) in each group is the proportion of the ‘total’ sample (i.e., ‘T’) in each group that experience the ‘event’ (i.e., ‘E’) of interest(in this case, respond to treatment); for the lamotrigine group pL=EL/TLand for the control group pc=Ec/Tc. The method of estimating the variance of this risk ratio is based on the normal distribution approximation; the RR is transformed using the natural logarithm and the variance of the natural log of RR is estimated using the delta method:

Subsequently, the point estimate for ln(RR) and the corresponding confidence intervals are transformed back to RR and the con fi dence interval for RR.
When conducti ng the MA using R, data from column 1 to 5 in Figure 1 would fi rst be loaded into R as:
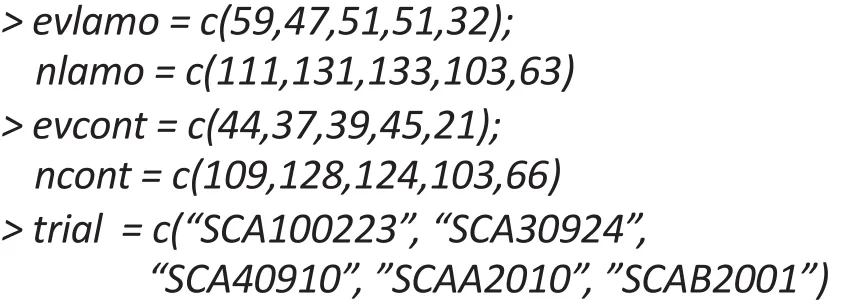
The MA can be done using the function ‘metabin’(denoting meta-analysis for binary variables) in the R library labelled ‘meta’. [For explanation about the use of this R library, activate the help function by entering ‘library(help=‘meta’)’, which will display all the functionalities for this library.] The R coding to metaanalyze the five lamotrigine trials using this function would be as follows:

In the above coding, ‘studlab’ is the data field when the labels for the different studies are located (i.e.,‘trial’); ‘label.e’ is the label assigned to the experimental group (‘Lamotrigine’); ‘label.c’ is the label assigned to the control group (‘Placebo’); ‘method’ is the method used to pool the studies (‘inverse’, inverse-weighting as described above for FE-MA [2.2] and RE-MA [2.9]);and ‘sm’ is the summary measure being used (‘RR’, riskratio). Alternative methods that can be selected in R to combine the target measure included the Mantel-Haenszel method (which was used in Geddes and colleague’s report[6]) or the Peto method. The printout for this coding would be as follows:

The first part of the summary provides the risk-ratios,associated 95% confidence intervals, and the weightings for fixed-effects and random-effects MA models for each individual study based on the formulae in (3.1) and(3.2). Notice that the weights for both fixed-effects and random-effects are the same since the heterogeneity is not statistically significant and therefore the estimated τ2=0. The first four trials are not statistically significant (i.e.,the 95% confidence intervals of the RRs include 1, which is the RR at which lamotrigine and placebo are equally effective), but the fifth trial is statistically significant(RR=1.60, 95% CI=1.04,2.45), indicating a significant advantage for lamotrigine over placebo. The second part of the summary provides the pooled RR and the associated 95% confidence intervals both for the fixedeffects and random-effects models; in this example both pooled RRs were statistically significant and the values using the FE-MA and RE-MA models were identical.
The last part of the summary first quantifies the level of heterogeneity of the included studies and then tests whether or not there is statistically significant heterogeneity. In the ‘Quantifying heterogeneity’section, between study variance (τ2or ‘tau^2’) is estimated to be 0; the standardized heterogeneity index (H) is estimated to be 1 with a 95% CI of 1 to 1.47,and the proportion of the total variance attributed to between-study heterogeneity (I2) if 0% with a 95% CI of 0% to 53.8%. In the ‘Test of heterogeneity’ section, the p-value for the Q-statistic, 0.772, is not significant which indicates that there was no significant heterogeneity between the five studies (which is the reason the pooled RRs for the fixed-effect and random-effect models were so similar).
The Q statistic only assesses the presence or absence of heterogeneity. Test can only tell us about the presence versus the absence of heterogeneity and‘Quantifying heterogeneity’ is then to report the extend of such heterogeneity which shows that the betweenstudy heterogeneity τ2(‘tau^2’) is estimated to be 0;the standardized heterogeneity index H is estimated to be 1 with 95% CI [1; 1.47]; the measure of proportion of observed heterogeneity from the total heterogeneityI2= 0% with 95% CI [0%; 53.8%] indicating again that there is no statistically significant heterogeneity for this MA.
For any MA, a forest plot is typically produced for summary and publication purposes. The forest plot for this dataset shown in Figure 1 can be simply produced in R by using the ‘forest’ function as follows:
> forest(RR1.Lamo)
3.3. Meta-analysis with risk-difference and odds-ratio
The risk-ratio is probably the most commonly used measure of ES in MA for binomial data, but other measures of ES include the risk-difference and oddsratio. The definition of risk difference (RD) is simply the difference of the risks between a treatment (or intervention) group and control group, defined as:

with the risk (or probability) of a target outcome defined as in (3.1). The statistical inference for RD is to test whether this RD is statistically significant different from zero.
The odds-ratio (OR), which is familiar because of its use in logistic regression, is intuitively less appealing than the RR or RD. The odds-rati o (OR) associated with an event is defined as the ratio of the odds of the event in one study group to the odds of the event in another study group. The odds of the event is de fi ned as:
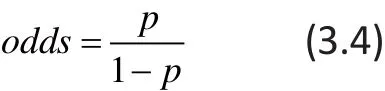
Thus the odds-rati o (OR) of the treatment group (such as, lamotrigine) to the control group for kth study can be formulated as follows:

The statistical inference for the OR in meta-analysis is usually conducted by converting the odds-ratio to the log scale and estimating the log odds-ratio and its standard error based on an approximate normal distributi on.
The implementation of these alternative methods for estimated ES in R is very straightforward. It is done by specifyingsm=‘RD’for risk-difference andsm=‘OR’for odds-rati o in the R functi on ‘metabin’ in the coding block shown in section 3.2.
4. Discussion
This paper provides an overview for meta-analysis using the classical fixed-effects and random-effects models and illustrates the models using the ‘meta’ package in R.Other commonly used R packages for conducting metaanalysis, such as ‘rmeta’ and ‘metafor’, and extensive illustrations of their application can be freely accessed from http://www.r-project.org. Further description of this meta-analysis methodology and its implementation using R is available inApplied Meta-Analysis with Rby Chen and Peace.[5]
Conflict of interest
The author declares no conflict of interest.
Funding
No funding was provided to prepare this paper.
1. Whitehead A.Meta-Analysis of Controlled Clinical Trials.New Jersey: John Wiley & Sons, Inc.; 2003
2. Hartung J, Knapp G, Sinha BK.statistical Meta-Analysis with Applicati ons. New Jersey: John Wiley & Sons, Inc.; 2008
3. Borenstein M, Hedges, LV, Higgins JPT, Rothstein HR.Introducti on to Meta-Analysis. New Jersey: Wiley; 2009
4. Pigott TD.Advances in Meta-Analysis. New York: Springer;2012
5. Chen DG, Peace KE.Applied Meta-Analysiswith R. Chapman and Hall/CRC Biostati stics Series. London: Taylor & Francis Group, Inc.; 2013
6. Geddes JR, Calabrese JR, GodwinGM. Lamotrigine for treatment of bipolar depression: independent meta-analysis and meta-regression of individual patient data from five randomized trials.BJP.2009; 194: 4-9
7. Calabrese JP, Huff man RF, White RL, Edwards S, Thompson TR, Ascher JA. Lamotrigine in the acute treatment of bipolar depression: results of fi ve double-blind, placebo-controlled clinical trials.Bipolar Disorder.2008; 10(2): 323-333. doi:http://dx.doi.org/10.1111/j.1399-5618.2007.00500.x
8. DerSimonian R, Laird N. Meta-analysis in clinical trials.Control Clin Trials. 1986; 7: 177-188. doi: http://dx.doi.org/10.1016/0197-2456(86)90046-2
9. Hardy RJ, Thompson SG. Detecting and describing heterogeneity in meta-analysis.Stat Med. 1998; 17(8):841-856. doi: http://dx.doi.org/10.1002/(SICI)1097-0258(19980430)17:8<841::AID-SIM781>3.0.CO;2-D
10. Raudenbush SW, Bryk AS. Empirical Bayes meta-analysis.J Educ Stat. 1985; 10(2):75-98. doi: http://dx.doi.org/10.2307/1164836
11. Sidik K, Jonkman JN. Simple heterogeneity variance estimation for meta-analysis.J R Stat Soc Series C. 2005;54(2): 367–384. doi: http://dx.doi.org/10.1111/j.1467-9876.2005.00489.x
12. Sidik K, Jonkman JN. A comparison of heterogeneity variance estimators in combining results of studies.Stat Med.2007;26(9): 1964–1981. doi: http://dx.doi.org/10.1002/sim.2688
13. Hamilton M. A rating scale for depression.J Neurol Neurosurg Psychiatry.1960; 23(1): 56-62
2015-05-29; accepted, 2015-06-18)

Ding-Geng (Din) Chen received his Ph.D. in Statistics from University of Guelph (Canada) in 1995 and he is now the Wallace H. Kuralt Distinguished Professor and Director of statistical Development and Consultation at the School of Social Work, University of North Carolina at Chapel Hill. Professor Chen was a professor in biostatistics at the University of Rochester from 2010 to 2015 and the Karl E. Peace endowed eminent scholar chair in biostatistics from the Jiann-Ping Hsu College of Public Health at the Georgia Southern University from 2009 to 2010. Professor Chen is also a senior biostatistics consultant for biopharmaceuti cals and government agencies with extensive expertise in clinical trials and bioinformati cs. He has more than 100 referred professional publications and co-authored/co-edited six books on ‘Clinical Trial Methodology (2010)’, ‘Clinical Trial Data Analysis Using R(2011)’, ‘Interval-Censored Time-to-Event Data: Methods and Applications (2012)’, ‘Applied Meta-Analysis Using R(2013)’and ‘Clinical Trials Biostatistics and Biopharmaceuti cal Applicati on (2014)’ published by Chapman and Hall/CRC and ‘Innovative statistical Methods for Public Health Data (2015) by Springer.
使用免费软件R进行精神病学研究的Meta 分析
Chen DG
meta分析;固定效应模型;随机效应模型;双相情感障碍;拉莫三嗪
Summary:This paper provides a brief overview of meta-analysis (MA) with emphasis on classical fixedeffects and random-effects MA models. It illustrates the application of MA models with the open-source software R using publicly available data from five studies on lamotrigine to treat bipolar depression and finds that meta-analysis identifies a statistically significant advantage of lamotrigine over placebo that was not evident in the individual studies.
[Shanghai Arch Psychiatry. 2015; 27(3): 195-199.
http://dx.doi.org/10.11919/j.issn.1002-0829.215063]
School of Social Work, University of North Carolina at Chapel Hill, Chapel Hill, United States
correspondence: DrDG.Chen@gmail.com
概述:本文对meta分析(meta-analysis, MA)作了简要概述,并着重于经典的固定效应和随机效应MA模型。文章以综合分析5项使用拉莫三嗪治疗双相障碍抑郁发作的研究的公开数据为范例,介绍了MA模型的应用及免费软件R在meta分析中的使用方法,该meta分析证实拉莫三嗪的效果优于安慰剂,且有统计学显著性,而在单个的研究中此优势并不明显。
本文全文中文版从2015年08月06日起在http://dx.doi.org/10.11919/j.issn.1002-0829.215063可供免费阅览下载
猜你喜欢
杂志排行

上海精神医学的其它文章
- Development of a checklist of short-term and long-term psychological symptoms associated with ketamine use
- Oligodendroglioma presenti ng as chronic mania
- Comparisons of family environment between homeless and non-homeless individuals with schizophrenia in Xiangtan, Hunan
- Abnormal inter- and intra-hemispheric integrati on in male paranoid schizophrenia: a graph-theoreti cal analysis
- Metacognitive training for schizophrenia: a systematic review
- Addressing risk of bias in trials of cognitive behavioral therapy