Statistical estimations for Plasmodium vivax malaria in South Korea
2015-11-30YoungsaengLeeHyeongapJangJeongAeRheeJeongSooPark
Youngsaeng Lee, Hyeongap Jang, Jeong Ae Rhee, Jeong-Soo Park*
1Department of Statistics, Chonnam National University, Gwangju, 500-757 Korea
2JW LEE Center for Global Medicine, College of Medicine, Seoul National University, Seoul, 110-744 Korea
3Department of Preventive Medicine, Chonnam National University, Gwangju, 501-757 Korea
Statistical estimations for Plasmodium vivax malaria in South Korea
Youngsaeng Lee1, Hyeongap Jang2, Jeong Ae Rhee3, Jeong-Soo Park1*
1Department of Statistics, Chonnam National University, Gwangju, 500-757 Korea
2JW LEE Center for Global Medicine, College of Medicine, Seoul National University, Seoul, 110-744 Korea
3Department of Preventive Medicine, Chonnam National University, Gwangju, 501-757 Korea
ARTICLE INFO
Article history:
Received 15 December 2014
Received in revised form 20 January 2015
Accepted 15 February 2015
Available online 20 March 2015
Back calculation
Incidence
Incubation period
Infection
Poisson model
Prevalence
Regression model
Objective: To calculate the numbers of weekly infections and prevalence of malaria, and to predict future trend of malaria incidences in South Korea. Methods: Weekly incidences of malaria for 13 years from the period 2001-2013 in South Korea were analyzed. The backcalculation equations were used with incubation period distributions. The maximum likelihood estimation for Poisson model was also used. The confidence intervals of the estimates were obtained by a bootstrap method. A regression model for time series of malaria incidences over 13 years was fitted by the non-linear least squares method, and used to predict futuretrend. Results: The estimated infection curve is narrower and more concentrated in the summer than in the incidence distribution. Infection started around the 19th week and was over around the 41st week. The maximum weekly infection 110 was obtained at the 29th week. The prevalence at the first week was around 496 persons, the minimum number was 366 at 22nd week, and the maximum prevalence was 648 at 34th week. Prevalence drops in late spring with people that falling ill and had had long incubation periods and rose in the summer with new infections. Our future forecast based on the regression model was that an increase at year 2014 compared to 2013 may reach a peak (at maximum about 70 weekly cases) at year 2015, with a decreasing trend after then. Conclusions: This work shows that back-calculation methods could work well in estimating the infection rates and the prevalence of malaria. The obtained results can be useful in establishing an efficient preventive program for malaria infection. The method presented here can be used in other countries where incidence data and incubation period are available.
1. Introduction
About 3 billion people in the world are at risk of malaria infection and 350-500 million people become newly infected each year. Malaria kills more than one million people each year. Most are children. Malaria is still one of the important diseases of the 21st century[1]. Moreover, global climatic change will allow malaria to spread into northern latitudes, including Europe and large parts of the United States[2]. It is caused by a protozoan parasite in the phylum, Apicomplexa, and in the genus, Plasmodium. There are four species that are in the genus: Plasmodium falciparum, Plasmodium vivax (P. vivax), Plasmodium ovale (P. ovale), and Plasmodium malariae. Two species of these, P. vivax and P. ovale, tend to have a hypnozoites stage and long incubation period[3].
P. vivax in South Korea was highly endemic until 1910 and decreased gradually after applications of modern medicine. It was thought to be eradicated after 1984. But malaria reemerged in the demilitarized zone region, the border between North and South Korea, after 1993 because of the shortage of malaria eradication programs in North Korea[4]. Around 2 000 people are infected annually in South Korea[5].
Information on the infection time is needed for public prevention programs and other societal related projects such as the blood supply for transfusions. However, it is hard to know the exactinfection time in an endemic country by an epidemiologic survey. A malarial patient cannot know when he got infected. The infection time of a malarial patientin a non-endemic country can be estimated approximately by investigating residence time in an endemic area, but it is also not exact. For this reason, incidence time data is more commonly used.
Many countries having endemic for malaria epidemics have seasonality for malaria incidences because of the calendar related climates. For example, the malaria incidence in South Korea occurs only around summer in temperate countries because winter is not suitable to the survival of the vector mosquito. We assume that if some diseases with a seasonal fluctuation have a long incubation period, their infection curve would be different from their incidence curve. Malaria in South Korea satisfies those two requirements. P. vivax, the only species in Korea, has a long incubation period and clear seasonality reflecting the population dynamics and other entolological characteristics of the vector, Anopheles sinensis, which hibernates during the winter season[4]. More exact information on the infection period can be used for public prevention programs and other social work projects such as blood transfusion.
The back-calculation method, a major technique described in this paper, has been used for calculating annual HIVinfections from the annual incidence, their incubation distribution and other information[6-8]. The method has also been used for estimating the number of dependent heroin users in Australia[9] and for estimating long-term trends in the incidence and prevalence of opiate use/ injecting drug use in England for 1968-2000[10]. It was used in estimatingthe number of SARS cases imported by international air travel[11], and in estimating age specific cancer incidence rates[12]. In this study, we estimated weekly infection rate and prevalence of malaria in South Korea using incidence data and incubation period distributions by a back-calculation formula and maximum likelihood estimation using Poisson modeling. The confidence intervals of the estimates are obtained by a bootstrap method. A regression model for time series of malaria incidences over 13 years is fitted, and is used to predict future trend.
2. Materials and methods
2.1. Data
As a notifiable disease, all medical facilities in South Korea should report their malaria cases to public healthcenters and then to the Korean Centers for Disease Control and Prevention (KCDCP). Because the KCDCP service tracked daily incidence days after mid 2000, we used their reporting data from 2001 to 2013 for our incidence data[13]. Figure 1 shows the time series of reported cases for 13 years. We used only domestic malaria infection and excludedall overseas infection. A total of 17 280 cases were reported entirely for 13 years. As we counted all cases on a weekly interval, the first week included 8 days since there was no incidence on January 1st.
The out-break data for each year was smoothed to eliminate weekend and holiday effects. We used Friedman's Super Smoother (“supsmu” function in R program[14]).
2.2. Incubation period
Different incubation periods by region have been reported[15,16]. P. vivax from temperate countries, tends to havea longer incubation time than from tropical countries although it is also known that some tropical malaria have long incubation periods[17].
The incubation period of P. vivax in South Korea has been investigated by Nishiura et al[18]. They selected 225 persons who visited an endemic area from a non-endemic area in South Korea, stayed less than a week, and did not visit more than 2 times. They concluded that the incubation period of P. vivax in South Korea, consisted of short and long incubation periods. A total of 142 cases (63.1%) out of 225 with short incubation periods were fitted witha gamma distribution, Γ(1.2, 22.2), and 83 cases (36.9%) with long incubation periods were fitted with a normaldistribution, N(337.4, 40.62).
P. vivax infection, with a long incubation period, resulted from the hypnozoites stage. In the hypnozoites stage, the sporozoites is discharged from the salivary glands of the hibernating mosquito in the hepatic cell without multiplication[19].
2.3. Back-calculation and Poisson modelling
Assuming that the out-break observations follow a Poisson distribution, we can estimate the number of infectionsusing the backcalculation formula and the maximum likelihood method. Details are given in followings.
From the back-calculation method[6,7,10], we have for y=2001,…,2012 and for w=1,…,52,
where fwis the incubation probability computed for each week w, Gwis the infection numbers for the week w, Aywis a random variable representing the malaria cases at y year and w week, and the random variable ε is the error term. The range of k (from 0 to 103) is set to cover two years. Thus, we actually assume that Aywfollows a Poisson distribution with a mean function.
Since we already know Aywand fw, the unknown quantities Gw+kare treated as regression coefficients and are subject to being estimated. Here, we assume that Gw= Gw+52 = Gw+104for w = 1, …,52. fwis computed by adding the corresponding daily incubation probabilities for seven days.
The log-likelihood function of Gwfor given data Âywis proportional to
where Âywis the super-smoothed value from the observed malaria cases at y year and w week, and λwis the mean function of Equation (2). Since no explicit maximizers of Equation (3) exist, a numerical optimization routine is needed to estimate Gwfor w = 1,…,52. We used quasi-Newton algorithm (“optim” function) in R program[14] to minimize the negative value of Equation (3).
2.4. Estimating prevalence of malaria and confidence intervals
We compute malaria prevalence using the convolution equation with estimated infection rates and the survival function. To calculate the confidence intervals of weekly number of infections and the prevalence, we used a bootstrap approach.
2.4.1. Estimating prevalence of malaria
We compute malaria prevalence using the following convolution equation with estimated infection rates and the survival function:
for w = 1,…,52, where Pwis the prevalence at week w, Gtis the estimated numbers of infection at week t which were computed at the above subsection, and Stis the survival function at week t. Note that the survival function is
where FU(t) is the cumulative distribution function of the incubation period U and fwis the incubation probability computed for each week w. Here Stmeans the probability that an infected man is in the incubation period at week t.
2.4.2. Confidence intervals
To calculate the confidence intervals of the weekly number of infections (Gw), we used a bootstrap approach[20]. For this purpose, we treated a time series of each year as an observation, so that consisted of 13 observations. We constructed a bootstrap sample from these 13 time series by sampling with replacement. From this bootstrap sample, we estimated Gwby minimizing Equation (3), and
The 95% confidence intervals for the prevalence were also calculated by using the bootstrap estimates for Gwwhich were obtained at the above computation, ie.,for every w. Using, we can calculate the B series of prevalence by (4). Then, the 100×(1-α)% confidence interval of the prevalence at a week w is obtained as;
2.5. Regression modelling for malaria time series
Forecasting future incidences of an infectious disease is a major concern for the public health care policy. For fitting the time series data of malaria by a regression model, we first considered the SIR model which has been used for infectious diseases[20]. Upon our failure of fitting the SIR model to the time series, we introduced more parameters (regression coefficients) and built a complex regression model. Using the model, we tried to predict the future trend of malaria incidences in South Korea. Statistical details are as follows:
For fitting the time series data of malaria by a regression model, we first considered the susceptible-Infective-Recovered (SIR) model which has been used for infectious diseases[22]. The SIR model is derived from the differential equation that describes the epidemiology of the infectious disease. One of the modified SIR model for fitting an asymmetric cyclical oscillations is the following model with three parameters, I∞,k and ζ ;
Here, I∞is the equilibrium value, k and ζ are related to the maximum magnitude and period of the cyclical oscillations, respectively. The time t ranges from the first week to the last week of the 13 years (ie., from 1 to 13×52).
Upon our failure of fitting the above SIR model to the weekly time series, we introduced more parameters (regression coefficients) and built the following model.
This model is built by modifying a model for tourist arrival data in Kedem and Fokianos[21]. The regression coefficients ( β0, …β4) are estimated by the non-linear least squares method. That is, the coefficients are calculated by minimizing ∑t(yt-yt(β))2with respect to β, where ytis the observations and yt(β) is the Equation (9). The estimates we obtained are β0= -1.07, β1= 0.308, β2= 256.12, β3= -3.189 and β4=0.917. Figure 5 shows the time series plot of observed (circles) versus fitted weekly number (solid line) of incidences from the model (9), and forecasts for the years from 2014 to 2018.
3. Results
3.1. Estimated numbers of weekly infections
Figure 2 shows the estimated weekly infections (a solid line) and 95% confidence intervals (dotted lines). It is more concentrated in the summer than in weekly incidence. Significant infection starts around the 19th week and is over around the 41st week. The maximum value 110 is obtained at the 29th week. The curve of the infection distribution is a bit asymmetric in the sense that it increases steeply and decreases gradually. Note that the upper intervals of confidence band are wider than the lower ones, especially for the high values of the estimates. That is because the Poisson distribution is right skewed, and mean and variance are the same. The numbers corresponding to Figure 2 are given in Table 1.
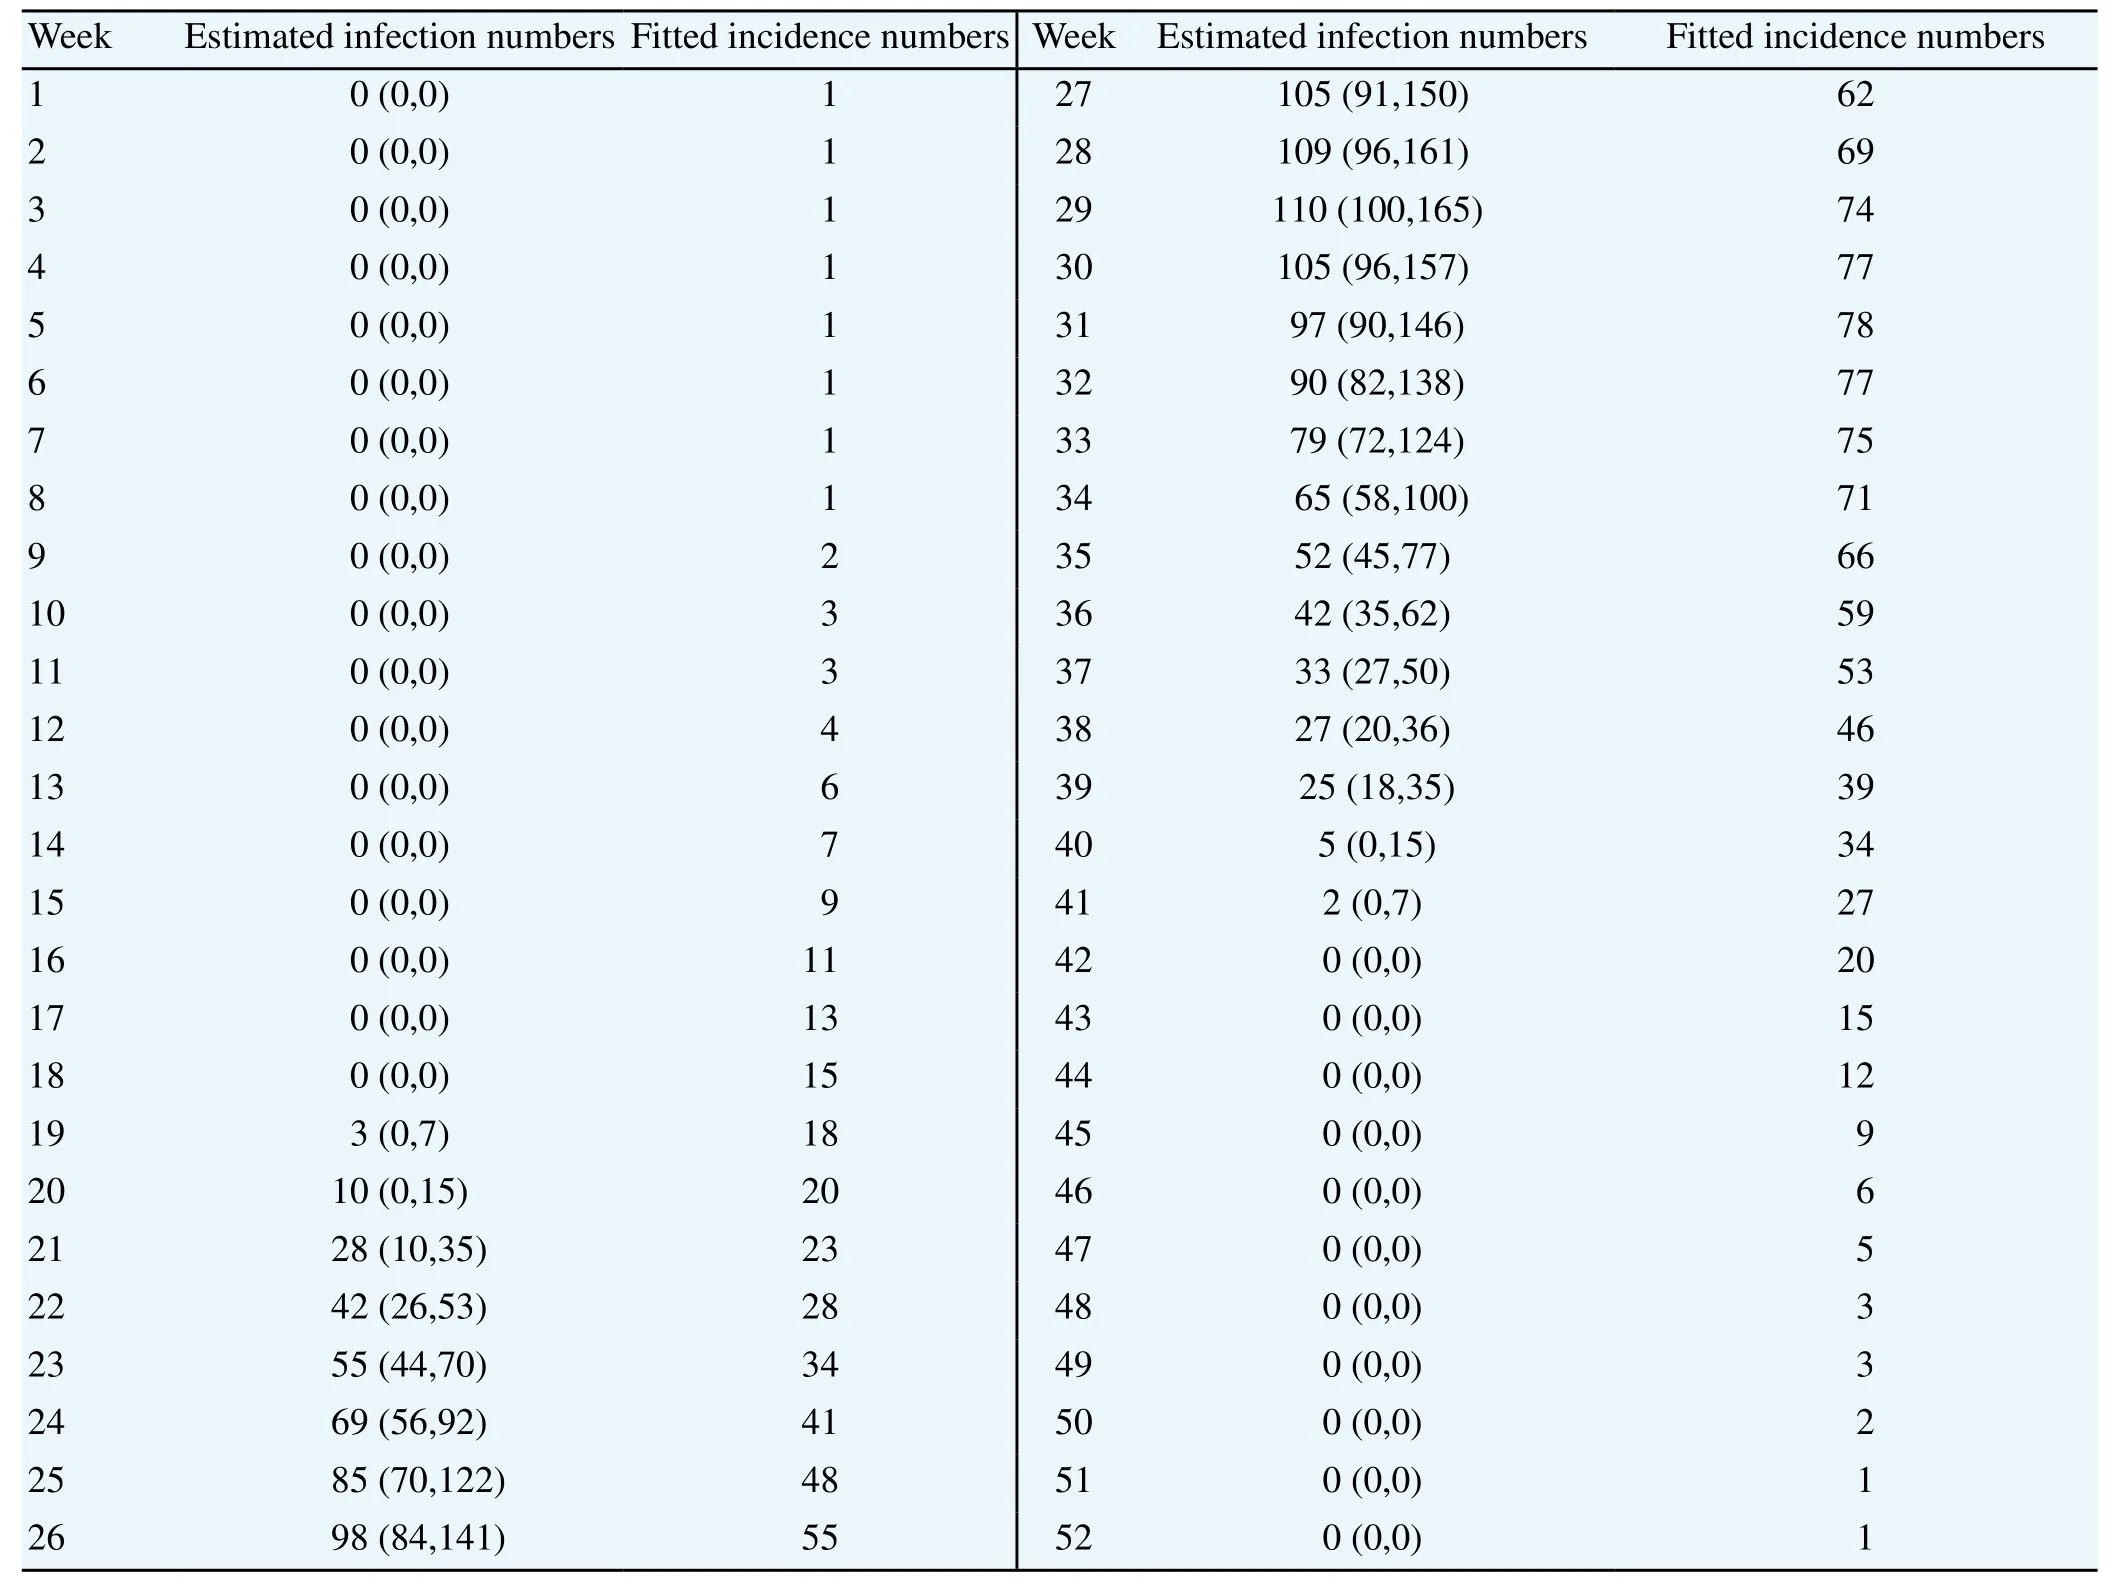
Table 1 Estimated numbers of weekly infection and numbers for the fitted incidence by Poisson modelling.
3.2. Fitted weekly incidences
In addition, Figure 3 illustrates malaria cases weekly for 13 years. The fitted incidence values ( λw) are obtained by a back-calculation using Equation (2) where the estimated infection numbers ( ■w) are inserted. The numbers corresponding to Figure 3 are given in Table 1.
The Chi-square goodness of fit test statistic value between the averaged cases of 13 years and the fitted incidence values are 9.89 with 51 degrees of freedom. The P-value is about 0.99. Hence, we can say that the estimation of weekly infection based on the maximum likelihood and Poisson modeling is good enough.
3.3. Prevalence of malaria
Figure 4 illustrates a result of the prevalence (a solid line), obtained from the convolution Equation (4). The dashdotted lines are 95% confidence intervals computed by bootstrap technique. The starting (winter) prevalence at the first week is 496 and the minimum number is 366 at the 21st and 22nd weeks. The decreasing pattern during this period is due to the cure of long-term incubated patients. Note that the 21nd week on the bottom line is just a 2 weeks delay from the starting 19th week of the infection. The winter number is recovered at week 28, and the maximum number is 648 at the 34th week. This increasing pattern is due to the high infection rate during this period. The decreasing pattern after the peak is due to the low infection rate and the cure of the short-term incubation patients. Note again that the upper intervals of confidence band are wider than the lower ones. The numbers corresponding to this figure are given in Table 2.
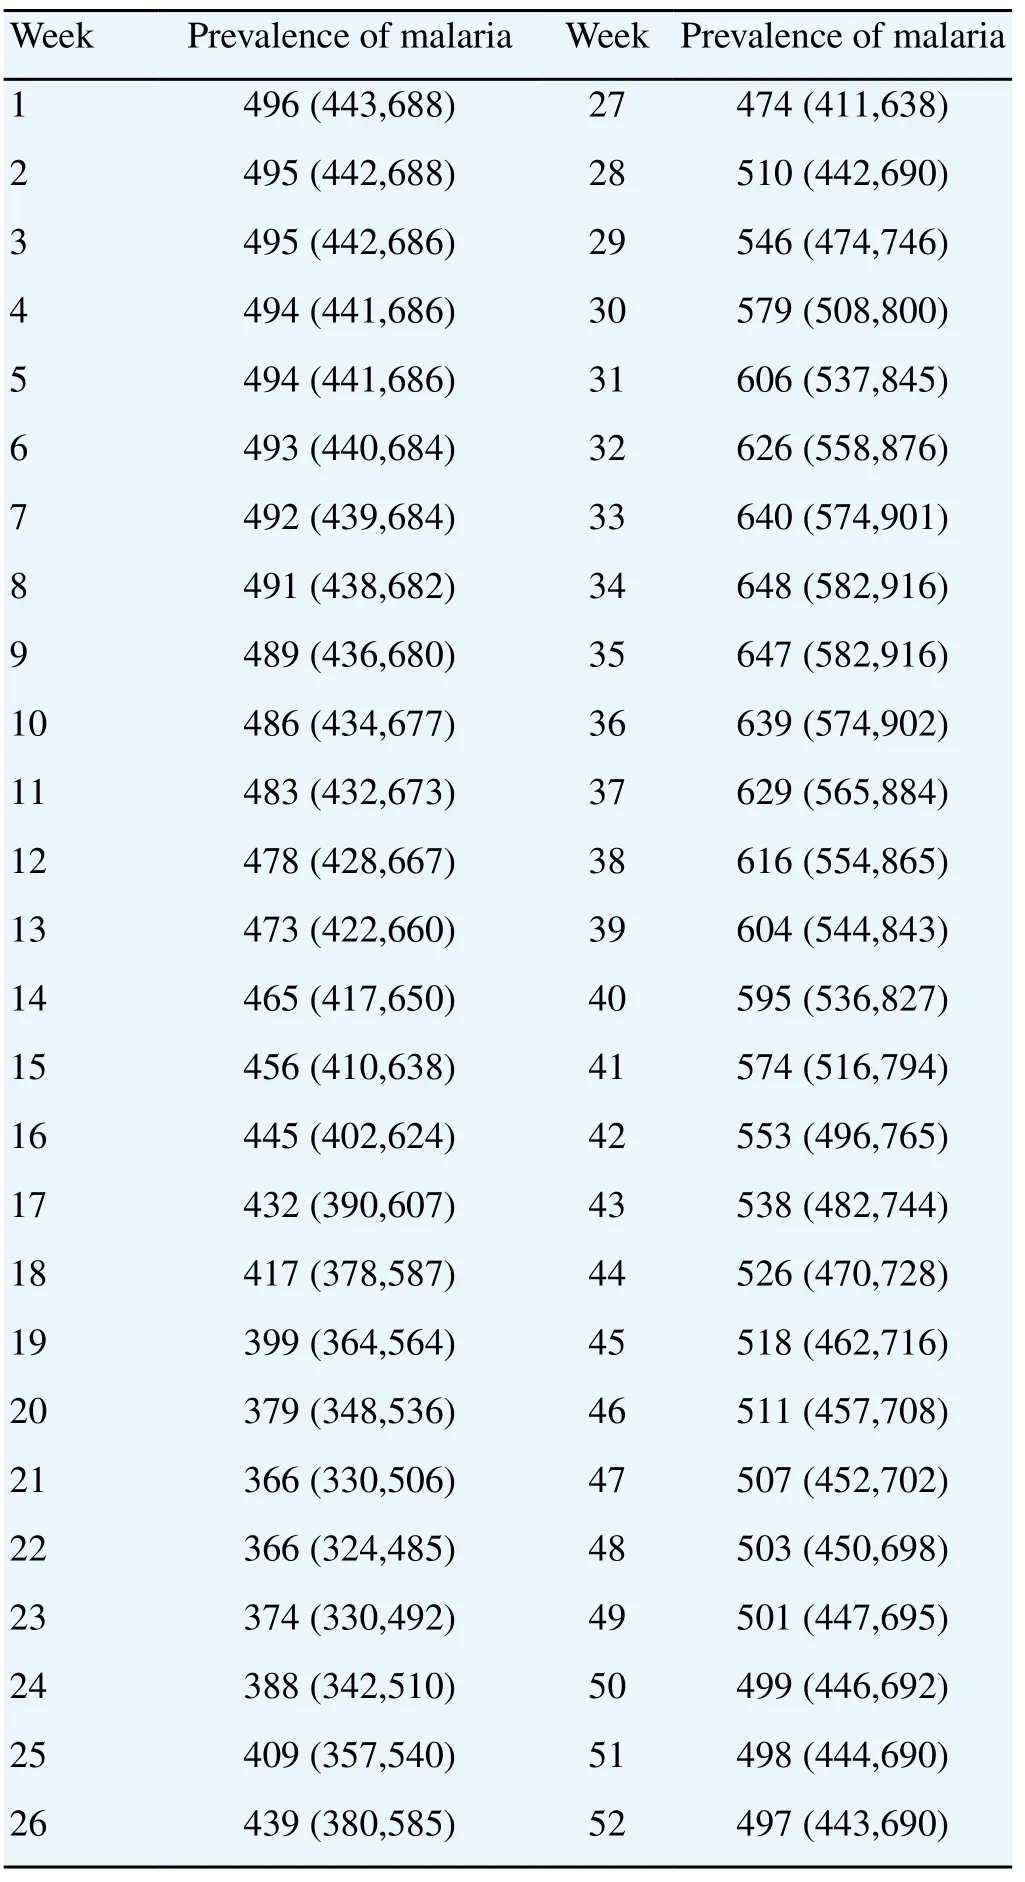
Table 2 Estimated numbers of weekly prevalence.
3.4. Prediction by a regression model
Figure 5 shows the time series plot of observed (circles) versus fitted weekly number (solid line) of incidences from the regression model (9), and forecasts for the years from 2014 to 2018. Our forecast based on the model (9) is that an increase at year 2014 compared to 2013 may reach a peak (at maximum about 70 weekly cases) at year 2015, with a decreasing trend after then.
4. Discussion
We analyzed the incidence data on a weekly basis even though the original source from the KCDC was on a daily basis. The weekly data was then smoothed to eliminate weekend and holiday effects. The first time in our study, we tried to calculate the daily infection rate using the daily incidence data, but itwas very difficult because there were too many regression coefficients (n=365). The variation of the daily infection rate was too big to accept when we calculated the rate using the matrix inversion method. We also did not use 2 weeksof interval data because the loss of information was considerable.
The estimated infection curve was narrower and more concentrated in summer than the incidence curve was. Significant infection starts around the 19th week and is over around the 41st week. The malaria infection rate is thought to be related to the life cycle of the vector, Anopheles sinensis. Therefore, we require more study on mosquitoes' lives. Moreover, an efficient preventive program of malaria infection using the infection curve needs to concentrate ona date after the 18th week. Prevalence in the first week is approximately 496 persons reflecting infected persons who have long incubation periods. Prevalence drops in late spring with people falling ill who have had a longincubationperiods and rises in the summer with new infections.
Brookmeyer[6], and Hall et al[7] estimated the HIV infection rate of each year by the back-calculation method from AIDS incidence. The back-calculation of AIDS is simpler than that of malaria because AIDS data is counted on a yearly interval and thus has only a few (7 for example in Brookmeyer[6]) coefficients. However, the analysis of malaria is more difficult because a phase of malaria infection is repeated yearly with some variations. It has meaning when the interested statistics are obtained as daily or weekly on a monthly interval (so it has more coefficients). Our study estimated 52 coefficients in the back-calculation formula using a maximum likelihood estimation method under a Poisson distribution assumption. One may try it under a negative binomial distribution assumption.
The confidence intervals were computed conditionally on the assumed incubation period distribution (and so the survival probabilities), by treating the distribution fixed. One can take account into the uncertainty of the assumed distribution by generating random numbers from it in the bootstrap procedure. This may give wider confidence intervals than the present one.
Spatial mapping or modelling of malaria incidences in Korea might be useful in establishing an efficient preventive program for malaria infection, which is our future study. Lee et al[23]developed a statistical methodology for estimating the transmittable prevalence associated with short-term and long-term incubation periods. They obtained the probabilities of reactivation and of parasitemia by repeatedly using the back-calculation formula.
We found that the estimated infection curve was narrower and more concentrated in the summer than in the incidence distribution. Numbers of infections start around the 19th week and end around the 41st week. The estimated infection curve can be useful in establishing an efficient preventive program for malaria infection. Prevalence is around 496 persons reflecting the infected persons who have had long incubation periods. Prevalence drops in late spring with people who fall ill and have had long incubation periods and rises in the summer with new infections. The confidence intervals of the estimates are obtained by a bootstrap method. This work shows that back-calculation methods could work well in estimating the infection rates and the prevalence of malaria.
A regression model for time series of malaria incidences over 13 years is fitted, and is used to predict future trend. Our forecast based on the regression model (9) is that an increase at year 2014 compared to 2013 may reach a peak (at maximum about 70 weekly cases) at year 2015, with a decreasing trend after then. We used the result of Nishiura et al[18] for the incubation period of P. vivax for what is essential for the back calculation of infection rates. We think the malaria data of other countries can be analyzed in the same way as presented here if they have information aboutincubation periods for their own malaria and incidence surveillance data. Moreover, we think this method can be used for other infectious diseases too.
Conflict of interest statement
We declare that we have no conflict of interest.
Acknowledgments
The authors thank Seok Ju Park who helped computation.
[1] World Health Organization. World malaria report 2010. Geneva: World Health Organization; 2010.
[2] Murray CJL, Rosenfeld LC, Lim SS, Andrews KG, Foreman KJ, Haring D, et al. Global malaria mortality between 1980 and 2010: A systematic analysis. Lancet 2012; 379(9814): 413-431.
[3] Centers for Disease Control and Prevention. President’s malaria initiative seventh annual report. Atlanta: CDC; 2013. [Online] Available at: http:// www.cdc.gov/malaria/
[4] Kim HC, Pacha LA, Lee WJ, Lee JK, Gaydos JC, Sames WJ, et al. Malaria in the Republic of Korea, 1993-2007: Variables related tore-emergence and persistence of Plasmodium vivax among Korean populations and U.S. Forces in Korea. Mil Med 2009; 174(7): 762-769. [5] Korean Centers for Disease Control and Prevention. 2007 Malaria infection control and management policy. Seoul: KCDCP; 2007.
[6] Brookmeyer R. Reconstruction and future trends of the AIDS epidemic in the United States. Sci 1991; 253: 37-42.
[7] Hall HI, Song R, Rhodes P, Prejean J, An Q, Lee LM, et al. Estimation of HIV incidence in the United States. J Am Med Assoc 2008; 300: 520-529.
[8] Punyacharoesin N, Viwatwongkasem C. Trends in three decades of HIV/AIDS epidemic in Thailand by nonparametric back calculation method. AIDS 2009; 23: 1143-1152.
[9] Law M, Lynskey M, Ross J, Hall W. Back-projection estimates of the number of dependent heroin users in Australia. Addiction 2001; 96: 433-443.
[10] DeAngelis D, Hickman M, Yang S. Estimating long-term trends in the incidence and prevalence of opiate use/injecting drug use and the number of former users: Back-calculation methods and opiate overdose deaths. Am J Epidemiol 2004; 160: 994-1004.
[11] Goubar A, Bitar D, Cao WC, Feng D, Fang LQ, Desenclos JC. An approach to estimate the number of SARS cases imported by international air travel. Epidemiol Infect 2009; 137: 1019-1031.
[12] Mezzetti M, Robertson C. A hierarchical Bayesian approach to agespecific back calculation of cancer incidence rates. Stat Med 1999; 18:919-933.
[13] Korean Centers for Disease Control and Prevention. Statistics of communicable diseases. Seoul: KCDCP; 2013.[Online] Available at: http://stat.cdc.go.kr.
[14] R-CRAN. R programs. [Online] Available at: http://cran.r-project.org/ bin/windows/base/R-3.0.1-win.exe. 2013.
[15] Imwong M, Boel ME, Pagornrat M, Pimanpanarak M, McGready R, Day NPJ, et al. The first Plasmodium vivax relapses of life are usually genetically homologous. J Infect Dis 2012; 205(4): 680-683.
[16] Kim J-R, Nandy A, Maji AK, Addy M, Dondorp AM, Day NPJ, et al. Genotyping of Plasmodium vivax reveals both short and long latency relapse patterns in Kolkata. PLoS ONE 2012; 7(7): e39645. doi:10.1371/ journal.pone.0039645
[17] Mangoni ED, Severini C, Menegon M, Romi R, Ruggiero G, Majori G. Case report: an unusual late relapse of Plasmodium vivax malaria. Am J Trop Med Hyg 2003; 68: 159-160.
[18] Nishiura H, Lee HW, Cho SH, Lee WG, In TS, Moon SU, et al. Estimates of short- and long-term incubation periods of Plasmodium vivax malaria in the Republic of Korea. Trans Royal Soc Trop Med Hyg 2007; 101: 338-343.
[19] Markus MB. The hypnozoite concept, with particular reference to malaria. Parasit Res 2011; 108(1): 247-252.
[20] Efron B, Tibshirani RJ. An introduction to the bootstrap. Baton Rouge: Chapman & Hall/CRC; 1993.
[21] Kedem B, Fokianos K. Regression models for time series analysis. Hoboken: Wiley; 2002.
[22] Lindsey JK. Nonlinear models in medical statistics. New York: Oxford University Press; 2001.
[23] Lee Y, Jang HG, Kim TY, Park JS. Estimating the transmittable prevalence of infectious diseases by using a back-calculation approach. Commun Stat Appl Methods 2014; 21(6): 487-500.
ent heading
10.1016/S1995-7645(14)60310-2
*Corresponding author: Jeong-Soo Park, Professor, Department of Statistics, Chonnam National University, Gwangju, 500-757 Korea.
Tel: +82-62-530-3445
Fax: +82-62-530-3449
E-mail: jspark@jnu.ac.kr
Foundation project: This work is supported by Basic Science Research Program through the National Research Foundation of Korea (NRF) funded by the Ministry of Education, Science and Technology(NRF-2013R1A1A4A01009355).
杂志排行

Asian Pacific Journal of Tropical Medicine的其它文章
- Afebrile presentation of 2014 Western Africa Ebolavirus infection: the thing that should not be forgotten
- Dengue in pregnancy: an under-reported illness, with special reference to other existing co-infections
- Relevance of EGFR gene mutation with pathological features and prognosis in patients with non-small-cell lung carcinoma
- Influence of artificial luminous environment and TCM intervention on development of myopia rabbits
- MicroRNA-126 inhibits the proliferation of lung cancer cell line A549
- Expression and significance of netrin-1 and its receptor UNC5C in precocious puberty female rat hypothalamus