The analysis of flow characteristics in multi-channel heat meter based on fluid structure model*
2015-11-24LIUZhenggang刘正刚DUGuangsheng杜广生LIULiping刘丽萍
LIU Zheng-gang (刘正刚), DU Guang-sheng (杜广生), LIU Li-ping (刘丽萍)
School of Power and Energy Engineering, Shandong University, Jinan 250061, China,E-mail: lzhenggang@sdu.edu.cn
The analysis of flow characteristics in multi-channel heat meter based on fluid structure model*
LIU Zheng-gang (刘正刚), DU Guang-sheng (杜广生), LIU Li-ping (刘丽萍)
School of Power and Energy Engineering, Shandong University, Jinan 250061, China,E-mail: lzhenggang@sdu.edu.cn
In this paper, a fluid structure interaction (FSI) model is used to study the internal flow field and the measurement performance of a multi-channel flow meter. The RNG k-εturbulent model and the finite element model are used separately in the fluid domain and the structure domain to obtain the meter factorK and the deformation of the structure. The meter factorK of the flow meter is obtained through the FSI model at temperatures of 20oC, 50oC and 80oC. The calculated results show the thermo expansion of the structure can significantly influence the measurement performance of the flow meter. The meter factor of the flow meter is also measured experimentally, and the comparison between the experimental results and the calculated results shows the validity of the fluid-structure interaction model. In order to reduce the measurement error, the meter factor K should be modified as the water temperature changes.
fluid structure model, heat meter, numerical calculation
Introduction
With the continuous improvement of the heating fee system, more and more Chinese households use heat meters to measure the heat energy of the central heating system. The heat meter can measure the water flow flux and the temperature difference between the inlet and the outlet of the heating system, by which the heat energy consumed by the family can be calculated. The water temperature can be measured accurately by an integrated circuit module, so the accuracy of the heat meter is determined by the accuracy of the flow rate mainly. Many heat meters use the impeller flow meter to measure the water flow rate, Fig.1 shows the structure of a multi-channel impeller flow meter. In Fig.1, the circumference of the impeller chamber is divided into multiple channels, the water enters the impeller chamber through channels and drives the impeller to rotate. The impeller flow meter measures the volume flux based on Eq.(1)
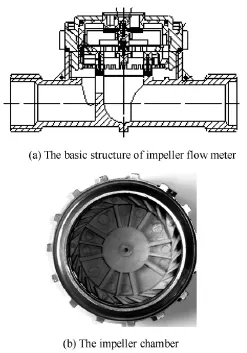
Fig.1 The multi-channel impeller flow meter
where Qvis the water volume that flows through the flow meter,f is the cycles of the impeller rotation,Kis the meter factor of the heat meter.
According to the national standards for the household heat meter, the heat meter should measure the flow flux accurately while the water temperature changes from 5oC to 95oC. As shown in Fig.1(b), the impeller chamber housing is made of engineering plastics. Plastic has a large thermal expansion rate and can expand as the temperature rises, and the measurement error can be magnified after a long time use of the heat meter, which is induced by the structural deformation during the variation of the water temperature. In order to improve the measurement accuracy, the effect of the thermal expansion on the measurement performance of the flow meter must be considered.
The numerical calculation based on computational fluid dynamics (CFD) is one of the main methods of studying the flow characteristics. For studying the influence of the thermal expansion of the impeller on the flow characteristics, the fluid structure interaction(FSI) model should be used. The fluid structure interaction model plays a very important role in many engineering applications, especially for the coupling effect between the fluid and the structure. Zhang et al.[1]used the FSI model to study the influence of the wind shear on the wind turbine blade and obtained the displacement and the stress along the span of the turbine blade. Pita Claudio and Felicelli Sergio[2]presented an immersed element-free Galerkin method (IEFG) to solve the fluid-structure interaction problems involving large deformation of a slender solid body. Patek et al.[3]et al researched the dynamic characteristics of a transformer-bushing system by using the fluid structure interaction approach. Benra and Dohmen[4]simulated the deflection deformation of the pump impeller with a fluid structure interaction method and it is shown that the impeller orbit curves obtained by the FSI is consistent with the measurement. Sun and Gu[5]analyzed the wind-induced responses of a saddle membrane structure under wind actions by the FSI model. Zhang et al.[6]investigated the fluid-structure interaction for a super-long flexible beam with the FSI model. Liu et al.[7]investigated the propulsive performance of a flexible articulated caudal fin by the FSI model. Gim et al.[8]simulated the interaction between a fluid and a 2-D/axisymmetric hyperelastic body based on FSI model. Wen et al.[9]researched the relastic parameters of artery bypass graft with FSI method. These researches mainly focus on the structural deformation and the stress caused by the fluid, the change of the fluid field caused by the structural deformation is largely ignored. Some references only study the structural deformation and the stress with an unidirectional coupling, the fluid field change is not considered.
In the study of the flow meter, Liu et al.[10]and Shi et al.[11]analyzed inter flow characteristic of impeller flow meter. But the researches that consider the fluid structure coupling effect were rarely carried out for impeller flow meter. But there are not so many studies that consider the fluid structure coupling effect for the impeller flow meter. In this paper, the flow characteristics of the multi-channel impeller flow meter are studied based on the fluid structure interaction model and the effect of the structure deformation on the fluid field is analyzed. The model and the methods used in this study can also be used for similar problems.
1. The calculation model and calculation domain
In this paper, the FSI model is used to study how the structure deformation affects the measurement performance of the heat meter. The turbulence model is adopted to calculate the velocity and pressure distributions of the flow field in the fluid domain and the finite element model (FEM) is used to calculate the stress and deformation of the structure caused by the thermal expansion and the water impact in the structure domain.
1.1The turbulence model of fluid domain
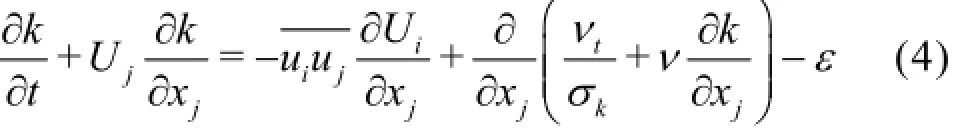
Because the flow in the heat meter is turbulent in most cases, so the RNG k-εturbulent model is used to obtain the velocity and pressure distributions. The RNGk-εturbulent model consists of the continuity equation, the momentum equations, and thekandε equations[12-15].
(1) Continuity equation
whereU is the mean velocity.
(2) Momentum equations
whereP is the mean pressure,ρis the density,ν is the kinematic viscosity andis the Reynolds stress tensor.
(3)kequation
(4)εequation

wherekandεare the turbulent kinetic energy and the dissipation rate, respectively,νtis the turbulent viscosity.σk,σε,Cε1and Cε2are empirical constants. In the RNG k-εturbulent model, the turbulent viscosity is calculated by

where Cµis an empirical constant. The Reynolds stresscan be obtained by
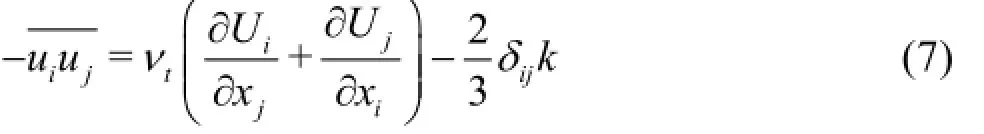
δijis the Kronecker delta. The last term in theε equation is an extra strain rate term and be given by:
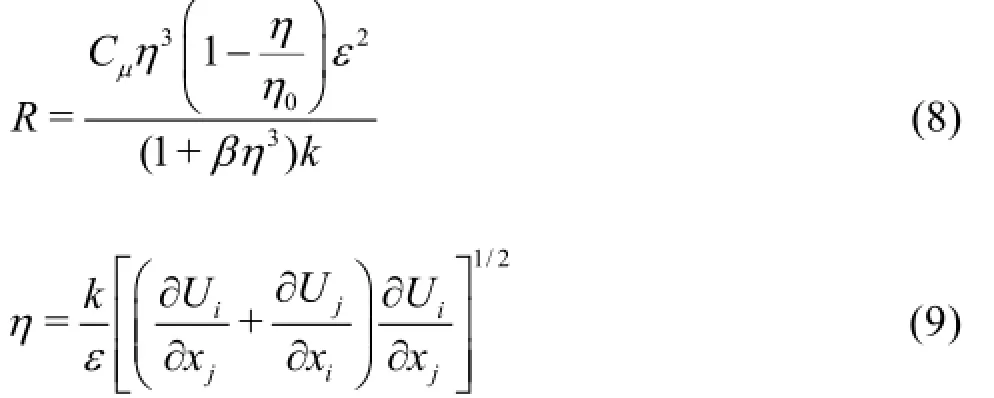
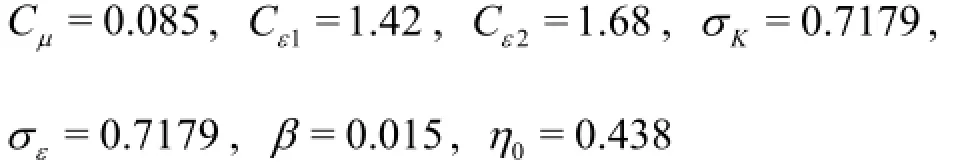
where βand η0are empirical constants. The RNG k-εmodel contains seven constants, the most commonly used set of constants are
1.2The numerical model for structure domain[16]
The finite element analysis model is used to calculate the structural stress and deformation. The structure domain is divided into finite elements that are connected to each other, the node displacement vectors of elements are calculated by linear equations as follows

where{F}is the force vectors caused by the water flow and the thermal expansion,[k ]is the stiffness matrix of all elements,{δ}is the displacement vectors of all nodes. According to the theory of the finite element analysis,[k ]is formed by superposition of all element stiffness matrixes:

where [k ]eis the stiffness matrix of one element,[B]is the geometric matrix of each element, which is determined by the type of element,[D]is the elasticity matrix of each element. When the boundary conditions, the constraint conditions and the force exerted on the structure are known, the Eq.(10) can be solved. The stress and strain of the structure can also be obtained with Eqs.(12) and (13) after Eq.(10) have been solved.
where{ε}is the strain vector and {σ}is the stress vector.
1.3The steps of FSI method
Using the iteration method to perform the numerical simulation of the FSI model, the implementation steps of FSI model are:
(1) Simulate the fluid domain with the turbulent model, obtain the pressure and velocity fields of the fluid domain.
(2) Calculate the force exerted on the structure by the fluid at the interface between the fluid and the structure according to the parameters of the fluid field obtained in step (1).
(3) Convert the force exerted on the structure and the thermal expansion to the equivalent load on the structure.
(4) Calculate the stress and strain of the structure with the finite element analysis according to the load obtained in step (3).
(5) Update the meshes of the structure and fluid domains according to the structure deformation obtained in step (4), get the fluid pressure and velocity distributions again in the fluid domain.
(6) Recalculate the structure stress, strain and deformation according to the updated flow field in step(5).
(7) Compare the calculated results of step (6) andthe calculated result of step (4). If the maximum relative error is less than 1%, the iteration at this time step is finished and start the iteration of the next time step,otherwise go to step (4) and continue the calculation. In this paper, the commercial software ADINA 8.4 is used to complete the numerical simulation of the FSI model. In the fluid domain, the velocity inlet boundary condition is adopted at the inlet, the inlet speed is determined by the flow rate, the outflow boundary condition is adopted at the outlet. In the structural domain, on the surfaces that contact with rhe copper case,the total constraints are applied and on the rest surfaces, no constrains are imposed.
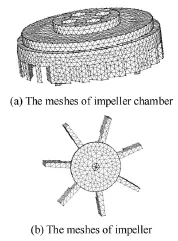
Fig.2 The meshes of structure domain
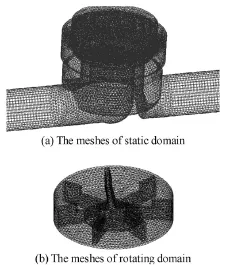
Fig.3 The meshes of fluid domain
1.4The domain of numerical simulation
As shown in Fig.1, select the impeller chamber housing and the impeller as the solution domain of the structure in the FSI model. The impeller chamber housing and the impeller are made of polyphenylene oxide. The meshes of the structure domain are shown in Fig.2, the tetrahedral meshes are used in the structure domain. The meshes of the fluid domain are shown in Fig.3. The meshes of the static domain and the rotating domain are generated, respectively, and the sliding mesh method is used to deal with the rotation of the impeller. The sliding mesh method allows adjacent grids to slide relative to one another. The rotating domain can rotate together with the impeller and slide relative to the static domain. In order to improve the calculation stability,10D(D is diameter of pipe) straight meshes are located at the inlet and5D straight meshes are located at the outlet.
1.5The calculation method of impeller rotational speed
When the flow rate is constant, the meter factor K in Eq.(1) can be calculated as
whereωis the angular velocity of the impeller,qvis the volume flow rate. In order to obtain the meter factorK , the angular velocity of the impeller must be calculated. During the numerical simulation, the momentum moment equation is used to calculate the angular velocity of the impeller. The motion equation of the impeller is
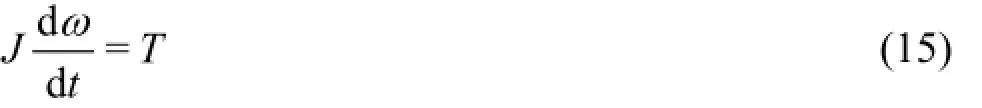
In Eq.(15),J is the moment of inertia of the impeller,t is the time and Tis all moment exerted on the impeller.Tincludes the moment caused by the water flow and the friction resistant moment of the impeller shaft. The diameter of the impeller shaft is very small,so the friction moment of the impeller shaft is also very small and can be neglected. The moment of inertia of the impeller can be obtained when the density and the structure of the impeller are determined, the moment caused by the water flow can be calculated by the CFD method, so the angular acceleration of the impeller can be obtained from Eq.(15). When the angular acceleration is known, the angular velocity of the impeller at time t can be calculated as

where Δtis the time step.
2. Experimental equipment and experimental method
The numerical simulation should be validated by experiments. The meter factor Kof the flow meter is measured by the experimental equipment shown in Fig.4. The experimental equipment is composed offour parts: a water recycle system, an electronic scale,a control unit and a workbench. The water recycle system consists of a water tank, a pump, a frequency conversion motor, pipes and electromagnetic valves,an electric heater is installed in the water tank for adjusting the water temperature. The control unit can adjust the flow rate by changing the frequency of the motor and the valve opening. When the flow meter is tested, the water is heated to a certain temperature,and then flows into the container through the tested flow meter. The electronic scale can measure the weight changes of the container. The cycles of the impeller rotation can be measured by the electronic circuit located on the top of the tested flow meter, the mass of the water that flows through the tested flow meter can be obtained by the electronic scale. Because the density of the water is known, the volume that flows into the flow meter can be calculated and the meter factor Kcan be obtained by Eq.(1). The measurement accuracy of the experimental equipment is mainly determined by the electronic scale. This study adopts the Sartorius EA150FEG-I electronic scale to measures the weight of the water, the accuracy of the electronic scale is 5 g. The minimum flow flux that flows into the water tank is 10 kg, the relative error is less than 0.1%. The comparison between experimental results and numerical results can be used to validate the numerical simulation method.
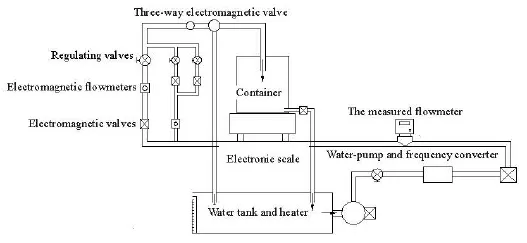
Fig.4 Schematic diagram of experimental equipment
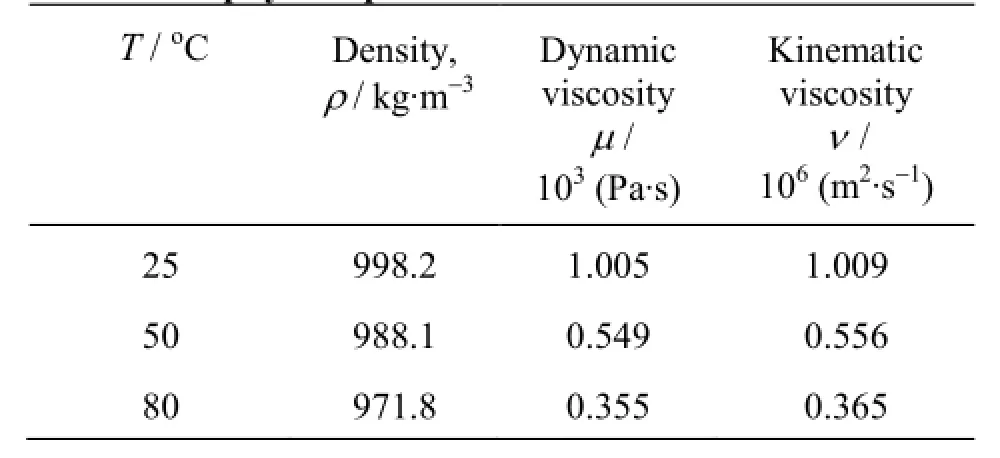
Table 1 The physical parameters of water[17]
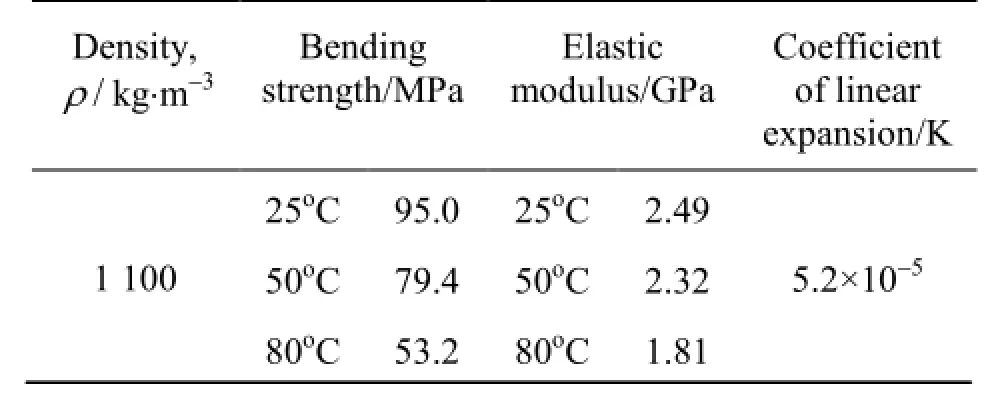
Table 2 The performance parameters of polyphenylene oxide[18]

Fig.5 The changes of impeller rotating speed with time
3. The results of numerical simulation and analysis
3.1The effect of structure deformation on measurement performance of flow meter
For two different cases, considering the structure deformation and not considering the structure deformation, the flow field within the heat meter is simulated and the meter factorK of the heat meter is obtained at the water temperatures of 25oC, 50oC and 80oC, respectively. Table 1 gives the water viscosity and Table 2 gives the performance parameters of the polyphenylene oxide at different temperatures. ThePoisson's ratio of the polyphenylene oxide is 0.35. In the process of the numerical simulation, the water viscosity and the elastic modulus of the structure are changed according to the change of the temperature. The angular velocity of the impeller can be obtained by Eq.(16). Figure 5 shows the relationship between the calculated angular velocity and the time at the water temperature of 25oC and the flow rate of 2.5 m3/h. In Fig.5, the angular velocity is obtained by the FSI model that consider the structural deformation. According to Fig.5, the rotation speed of the impeller changes periodically with time, so the average angular velocity can be obtained by the average instantaneous angular velocity of the impeller andK can be calculated by Eq.(14).
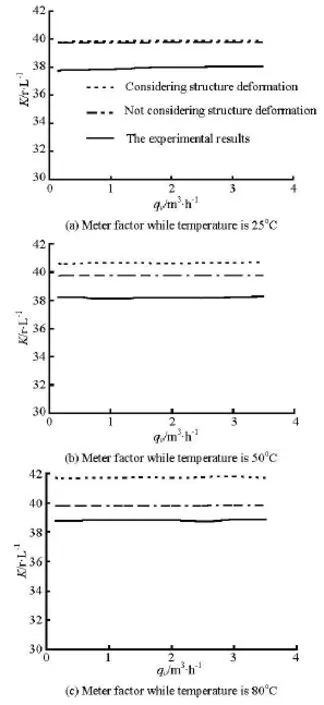
Fig.6 The relationship of Meter factor Kwith the flow rate at different water temperatures
Figure 6 shows the meter factorKat different flow rates at the water temperatures of 25oC, 50oC and 80oC, respectively. From Fig.6(a), the difference between the calculated results in the case of considering the elastic deformation of the structure and the results in the case without considering the elastic deformation is very small, the meter factorK changes very little when the flow rate increases, the performance of the flow meter is stable in the turbulent range. Because of ignoring the friction moment of the impeller shaft and the numerical error, the calculated results are 5.12% greater than the experimental results. From Figs.6(b)and 6(c), the meter factor Kis also unchanged when the flow rate changes, but with the increase of the water temperature, the calculated results in the case of considering the elastic deformation become deviate from the results without considering the elastic deformation of the structure. The calculatedKfor the case not considering the structural deformation is almost unchanged when the temperature increases. However,the calculated Kfor the case of considering the structural deformation is significantly increased with the increase of thje temperature. Figure 6 also shows the experimental results. TheKobtained by experiments is also significantly increased with the increase of the water temperature.
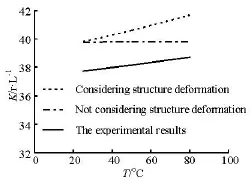
Fig.7 The changes ofK while temperature rises
Figure 7 shows the changes of the meter factor Kwith the inc3rease of the water temperature at the flow rate of 5 m/h. According to Fig.7, the calculated K in the case of considering the structure elastic deformation has a 2.47% increase when the water temperature is raised from 25oC to 50oC, and the calculated Kincreases by 5.87% when the temperature reaches 80oC. The calculatedK in the case of considering the structural deformation is in close agreement with experimental results, compared with the results at 25oC, the experimentalK increases by 1.35% and 3.34%, at the water temperature of 50oC and 80oC, respectively. Because of the errors of the numerical model and the calculation method, the calculated results increase faster with the increase of the water temperature than the experimental results. By contrast, the calculated K in the case of not considering structural deformation is not consistent with the experimental results, with K unchanged when the water temperature increases.Figure 6 and Fig.7 show that the FSI model in the case of considering the structural deformation is more reasonable when the temperature is high.
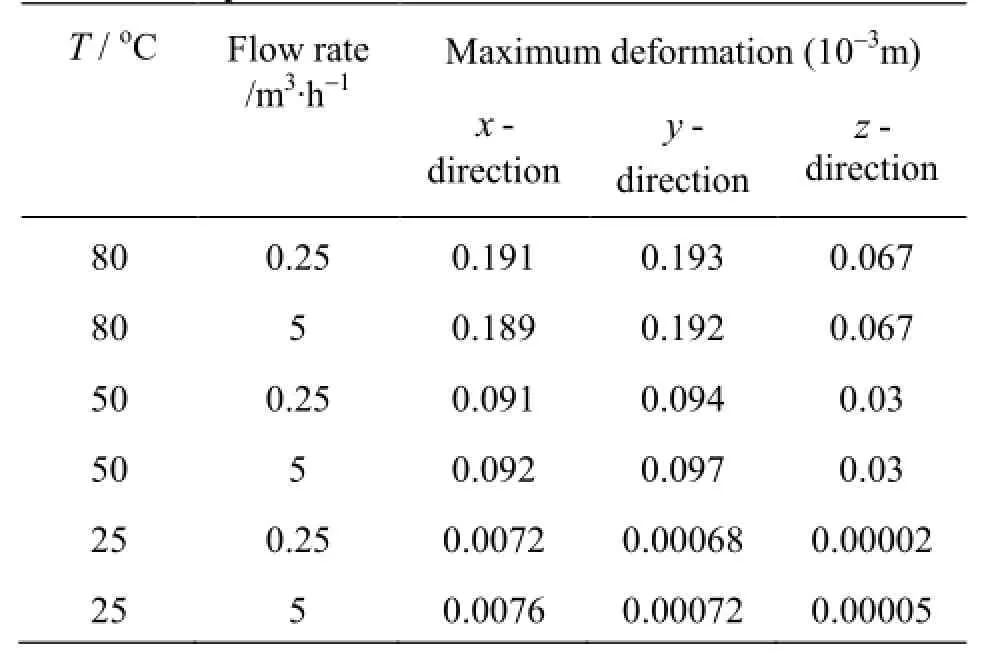
Table 3 The maximum deformation of impeller chamber at different temperatures and flow rates
The deformation of the structure can be obtained by the FSI model in different water temperatures and flow rates. Table 3 shows the maximum deformation of the impeller chamber, the maximum deformation occurs in the outermost part on the impeller chamber bottom. From Table 3, the deformation of the structure is little changed when the flow rate increases from 0.25 m3/h to 5 m3/h, and the deformation significantly increases when the water temperature is raised. Figure 7, Fig.8 and Table 3 show that the thermal expansion of the impeller chamber causes the performance change of the flow meter.

Fig.8 The speed vector and deformation of impeller chamber around flow channel while flow rate is 5 m3/h and water temperature is 25oC
Figure 8 shows the deformation of the impeller chamber and the flow velocity vector around the flow channel at the water temperature of 25oC and the flow rate of 5 m3/h, Fig.9(a) shows the calculated results obtained by the model that considers the elastic deformation of the structure and figure 9(b) shows the calculated results in the case when the elastic deformation of the structure is not considered. Figures 9(a)and 9(b) show that they are substantially the same, therefore, the elastic deformation caused by the impact of the water flow is very small.
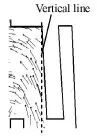
Fig.9 The speed vector and deformation of impeller chamber around flow channel while flow rate is 5m3/h and water temperature is 80oC
Figure 9 shows the deformation of the impeller chamber and the flow velocity vector around the flow channel at the water temperature of 80oC and the flow rate of 5 m3/h. From Fig.9, the outermost part on the impeller chamber bottom sees obvious deformation. The deformation of the impeller chamber causes the deflection of the water channel, so the water flow is deflected and the meter factorK is increased.
The results of the numerical simulation and the experiment show that the thermal deformation of the plastic parts influence the flow characteristics and the measurement performance of the flow meter and the meter factorK increases with the rising of the water temperature, and the meter factor K must be corrected as the water temperature changes.

Fig.10 The speed vectors and pressure contours on horizontal section of impeller chamber
3.2The characteristics of flow field in flow meter
Figure 10 shows the velocity vectors and the pre-ssure contours on the horizontal section in the impeller chamber. Figure 10 shows that the water flow enters the impeller chamber through the channels and the velocity vectors are symmetrically distributed about the center of the impeller. The uniform velocity field leads to a uniform force by the impeller, which is beneficial for reducing the wear of the impeller chamber bearings and the long-term stable operation of the flow meter.
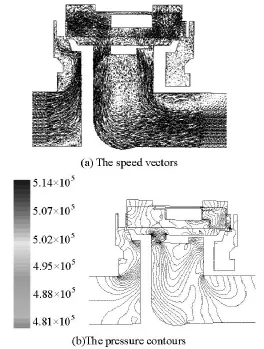
Fig.11 The speed vectors and pressure contours on vertical section
Figure 11 shows the velocity vectors and the pressure contours on the vertical section of the heat meter. The water flow enters the wan-wheel chamber from bottom to top at the inlet and outflows from the center of the impeller chamber. It is seen from Fig.11(b) that the pressure contours are relatively dense at the bend position of the water flow, which shows that the pressure loss mainly occurs in these positions.
From Fig.10 and Fig.11, it is seen that the water flows into the impeller chamber through narrow channels behind two bends. The flow speed is increased after the water flows through the narrow channel,which helps to increase the rotation speed of the impeller and improves the measurement resolution of the flow meter. Furthermore, the narrow channels also help to eliminate the effects of unsteady flows like the inlet vortex and improve the measurement accuracy and repeatability.
4. Conclusion
In this paper, the fluid structure interaction model is used to study the internal flow characteristics of the impeller flow meter. The results of numerical simulations show that the thermal expansion of the structure increases the meter factorK . The calculated meter factor is basically consistent with the experimental results, which validates the FSI model. The meter factor must be modified with the rising of the water temperature. This paper also gives the velocity vectors and the pressure contours on different sections, and the characteristics of the flow field show that the multi-channel impeller heat meter has a good measurement stability. This paper gives an example to show the influence of the structure deformation on the flow characteristics with the FSI model. The method and the model used in this paper can be applied in other similar cases. Results of the study can provide some guidance for the design of the heat meter and reduce the development costs of the impeller flow meter.
References
[1]ZHANG J., GUO L. and WU H. The influence of wind shear on vibration of geometrically nonlinear wind turbine blade under fluid-structure interaction[J]. Ocean Engineering, 2014, 84(3): 14-19.
[2]PITA CLAUDIO M., FELICELLI SERGIO D. A fluidstructure interaction method for highly deformable solids[J]. Computers and Structures, 2010, 88(3): 255-262.
[3]PATEK R., SEKUA R. and LEWANDOWSKI B. Fluid influence on dynamic characteristics of transformer-bushing system using fluid structure interaction (FSI) approach[J]. IEEE Transactions on Dielectrics and Electrical Insulation, 2010, 17(2): 408-416.
[4]BENRA F. K., DOHMEN H. J. Comparison of pump impeller orbit curves obtained by measurement and FSI simulation[C]. 2007 Proceedings of the ASME Pressure Vessels and Piping Conference Fluid-Structure. San Antonio, Texas, USA, 2008, 4: 41-48.
[5]SUN F., GU M. A numerical solution to fluid-structure interaction of membrane structures under wind action[J]. Wind and Structures, 2014, 19(1): 35-58.
[6]ZHANG Q., LIU J. and XU S. Fluid-structure interaction for super-long flexible beam at non-matching meshes[C]. 2012 9th International Conference on Fuzzy Systems and Knowledge Discovery. Chengdu, China,2012, 2683-2686.
[7]LIU B., ZHANG S. and QIN F. et al. Fluid-structure interaction study on the performance of flexible articulated caudal fin[J]. Advanced Robotics, 2014, 28(24):1665-1676.
[8]GIM G. H., CHANG S. M. and LEE S. et al. Fluid-structure interaction in a U-tube with surface roughness and pressure drop[J]. Nuclear Engineering and Technology, 2014, 46(5): 633-640.
[9]WEN J., DING G. and JIANG W. Numerical simulation of compliant artery bypass grafts using fluid-structure interaction framework[J]. ASAIO Journal, 2014, 60(5):533-540.
[10]LIU Yong-hui, DU Guang-sheng and LIU Zheng-gang et al. The influence of different design parameters and working conditions on characteristics of heat meters[J]. Journal of Hydrodynamics, 2009, 21(3): 394-400.
[11]SHI Shuo, LIU Zheng-gang and SUN Jian-ting et al.Study of errors in ultrasonic heat meter measurements caused by impurities of water based on ultrasonic attenuation[J]. Journal of Hydrodynamics, 2015, 27(1): 141-149.
[12] ZHANG Xue-lan, SUN Xi-huan and LI Yong-ye. 3-D numerical investigation of the wall-bounded concentric annulus flow around a cylindrical body with a special array of cylinders[J]. Journal of Hydrodynamics, 2015, 27(1): 120-130.
[13] MOMPEAN G.. Numerical simulation of a turbulent flow near a right-angled corner using the speziale nonlinear model with RNG k-εequations[J]. Computers and Fluids, 1998, 27(7): 747-850.
[14] JEONGA U. Y., KOH H. M. and LEE H. S. Finite element formulation for the analysis of turbulent wind flow passing bluff structures using the RNGk-ε model[J]. Journal of Wind Engineering and Industrial Aerodynamics, 2002, 90(3): 151-169.
[15]KIM J. J., BAIK J. J. A numerical study of the effects of ambient wind direction on flow and dispersion in urban street canyons using the RNG k-εturbulence model[J]. Atmospheric Environment, 2004, 38(19): 3039-3048.
[16] QU J. The infinite element method of engineering structure[M]. Xi'an: Northwestern Ploytechnical Univer- sity Press, 2004(in Chinese).
[17] STREETR V. L., WYLIE E. B. Fluid mechanics[M]. New York, USA: McGraw-Hill, 1985.
[18] SHI An-fu, GONG Yun-biao. The engineering plastic manual[M]. Shanghai, China: Shanghai Scientific and Technical Press, 2003(in Chinese).
(June 12, 2015, Revised July 9, 2015)
* Project supported by the Natural Science Foundation of Shandong Province (Grant No. ZR2014EEM015).
Biography: LIU Zheng-gang (1973-), Male, Ph. D., Lecturer
DU Guang-sheng,
E-mail: du@sdu.edu.cn
杂志排行

水动力学研究与进展 B辑的其它文章
- Theoretical analysis of slip flow on a rotating cone with viscous dissipation effects*
- Numerical and experimental study of Boussinesq wall horizontal turbulent jet of fresh water in a static homogeneous environment of salt water*
- Development of integrated catchment and water quality model for urban rivers*
- Analysis of temperature time series based on Hilbert-Huang Transform*
- A cavitation aggressiveness index within the Reynolds averaged Navier Stokes methodology for cavitating flows*
- RANS simulations of the U and V grooves effect in the subcritical flow over four rotated circular cylinders*