Analysis of Marketing of Garri in Delta State, Nigeria
2015-11-18EbeworeandIdoge
Ebewore S O, and Idoge D E
Department of Agricultural Economics and Extension, Delta State University, Asaba Campus, Delta State, Nigeria
Analysis of Marketing of Garri in Delta State, Nigeria
Ebewore S O, and Idoge D E
Department of Agricultural Economics and Extension, Delta State University, Asaba Campus, Delta State, Nigeria
The study examined the marketing of a cassava-based product (garri) in Delta State, Nigeria. Data was collected from 168 respondents using structured questionnaire. A multi-stage sampling procedure was employed in selecting 168 respondents from six markets in Delta State where garri is produced and marketed. Data was analyzed by the calculation of percentages, means and running of regression. The study revealed that the marketing of garri in Delta State was predominantly a female activity. The study also revealed that the garri was marketed in three channels and that 46.4% were retailers. The study further revealed a reasonable degree of freedom of entry and exit in the garri business in Delta State. Each trader or marketer was able to earn an average profit margin of N2 190.00 (for garri marketers), while the marketing margins for garri was 13.1%. Although the marketers were faced with some challenges the average profit per marketer per month was reasonably high (N40 722). The study further showed that the socioeconomic characteristics of the marketers to a large extent had a positive influence on the quantity of garri sold in the study area. From the findings it was recommended that storage facilities, extension services and good road network among others should be provided to improve the marketing of garri in Delta State, Nigeria.
garri, profit, market conduct, gross margin, marketing margin, market channel
Ιntroduction
Cassava is a very important crop in Africa and has recently become the most important root crop in Nigeria. More than 228 million tons of cassava were produced worldwide in 2002 of which Africa accounted for 52%. In 2007, Nigeria produced 46 million tons making it the world's largest producer. According to 2002 FAO estimates, Africa exports only one ton of cassava annually (FAO, 2008). Nearly every person in Africa eats around 80 kilograms of cassava per year. It is estimated that 37% of dietary energy comes from cassava. The Democratic Republic of Congo is the largest consumer of cassava in Sub-Saharan Africa,followed by Nigeria (FAO, 2008).
Cassava products are basic food items for many Nigerians. They also serve as feed for many livestock and industrial raw materials for production. Many Nigerians, especially those living in the rural community, derive their livelihoods from the production,processing and sales of cassava products. The everrising demand and prices of these products have led to the continued search for how to improve production,distributive trade and income of all the stakeholders in cassava-based enterprises.
A current initiative-global cassava development strategy (GCDS)-envisages that cassava will spur(stimulate) rural and industrial development and raise the income for producers, trader and all the stakeholders in the cassava chain Fawole and Odebode(2007). FAO's rationale for developing a Global Cassava Development Strategy is the belief that the crop will contribute to the economic development ofcassava producers and processers and the well-being of numerous disadvantaged communities and individuals around the world. The broad agro-ecological adaptability of cassava, and its ability to produce reasonable yields where most crops cannot make it the basis for food security at household level and an important source of dietary energy. The crop is an essential part of the diet of more than half a billion people and provides a livelihood for millions of farmers, processors and traders worldwide. Despite its importance as a staple crop and industrial raw material,it contribute to fight hunger and poverty in developing countries.
Cassava has often been neglected in agricultural development policies and has received considerably less emphases in genetic improvement and biotechnology than most of other major food crops. The Global Strategy is the result of the visionary efforts,dating from 1996, of a number of individuals and institutions that have spurred renewed interest in cassava and its links to the development process. The revival of interest in cassava can be traced back to May 1996, when a meeting called by the International Fund for Agricultural Development (IFAD) decided to form a Task Force to spearhead the development of a strategy for cassava. The goal of the Task Force was to realize the shared vision for cassava and move it closer to action and reality. In 1998, international experts prepared a Global Cassava Development Strategy(GCDS) document. GCDS was officially endorsed by stakeholders at a Validation Forum held at the headquarters of Food and Agriculture Organization of the United Nations (FAO) in Rome, in April, 2000. An implementation plan was also adopted.
Cassava is largely consumed in many processed forms in Nigeria. In Nigeria, the popular traditional processed cassava products are garri, fufu, starch,cassava flour, tapioca, animal feed and industrial starch of which garri stands out to be the most popularly produced in the country for household consumption. Other products of cassava are cassava leaves and stems which are used for cooking and fencing, respectively.
Garri is very important in the diets of west African people especially the urban dwellers (Lemchi et al.,2011). Its ease of preparation for household consumption has made it to be extremely popular among urban masses (Oyewole and Philip, 2006). Since cassava is important in the diet of many Nigerians and garri is the most widely consumed product of cassava (Agbamu and Waziri, 2007), this study aimed at analyzing its market and marketing potentials. According to Reddy et al. (2008), marketing is the economic process by which goods and services are exchanged between the producers and the consumers and their values determined in terms of prices. Acharya and Agarwal(1992) looked at agricultural marketing as the study of all the activities, agencies and policies involved in the procurement of farm inputs by farmers and the movements of agricultural products from the farmers to the final consumers. Agricultural marketing has been summarily defined by Adegeye and Dittoh(1985), Buell (1995) and Crammer et al. (2000) as all the processes involved from the production of a commodity until it get to the final consumer. These processes ensure that the right product (form utility) is available at the right place (place utility), at the right price (possession utility) and at the right time (time utility) to fully satisfy the consumer (Beierlein and Woolverton, 1991).
A market is any contact that exists between buyers and sellers for the purpose of business transaction while marketing involves all the activities in the movement of a commodity from the producer to the final consumer (Olukosi et al., 2007). Marketing is not synonymous with selling. It includes packaging,storage, transportation, pricing, financing, risk bearing and even product design (Olukosi et al., 2007).
Gross margin is the difference between the total variable cost and total return. It is not used in measuring profit except where fixed costs are negligible. In this study, gross margins and profits of garri traders were used interchangeably since they almost incurred zero fixed costs. Marketing margin represents the difference among the price paid by consumers andthat receive by producers (Olukosi et al., 2007). The size of the marketing margin varies from product to product depending on some features like processing,perish ability, bulkiness, seasonality of the product and institutional factors (Olukosi et al., 2007). Agbamu and Waziri (2007) observed that marketing margin for garri varies from market to market and even between wholesalers and retailers. Market conduct relates to the behaviour of market participants. In other words,it is the action which firms follow in adopting and adjusting to the market in which they buy and sell. A marketing channel is the path of products as it moves from the producers to the final consumers (Olukosi et al., 2007). Commodity distribution channels involve distributors, wholesaler, retailers and other agents (Olukosi and Isitor, 1990; Kotler et al., 2007). According to Adegeye and Dittoh (1985), there is a relationship between marketing channel and margin. In fact, the longer the channel, the greater the margin.
In spite of the importance of garri in Delta State and the trade on the product, little or no major attention had been placed on the behaviour of participants in the garri market, especially the conduct and performance of garri marketers and their profit margins. The following research questions thus arise: what are the socio-economic characteristics of garri marketers? What is the conduct of participants in the garri business? How profitable is garri business to the traders? What is the channel of garri sale? What problems are garri marketers likely to encounter?This study was intended to investigate marketing of a cassava product (garri) in Delta State, Nigeria. The specific objectives were to describe the socioeconomic characteristics of the marketers, assess the conduct of garri marketing in the study area,assess the profit margin of garri marketers, determine the marketing channels of garri, and ascertain the problems facing garri marketers.
The following hypothesis stated in the null form was tested:
Ho: socio-economic characteristics of the marketers did not affect the quantity of garri sold by marketers in the study area.
Research Methodology
The study was carried out in Delta State. Delta state was created from the defunct Bendel state on August 27, 1991 by the then regime of General Ibrahim Babangida. Delta State shares common boundaries with Edo and Ondo States to the North-West, Imo and Anambra States to the North-East, Rivers and Bayelsa to the South-East. In the South and South-West, it has approximately 122 kilometres of coast line bounded by the Bight of Benin on the Atlantic Ocean. The major ethnic groups are Urhobo, Igbo, Ezon, Isoko and Itsekiri. Major crops grown include cassava (from which garri is produced), yam, coco yam, potato,plantain/banana, oil palm, rubber and pepper. Animal husbandry and fishing activities are also prevalent in the state. Delta State lies approximately between longitude 5°00' and 6°45' East, and latitude 5°00' and 6º30' North. It has an estimated population of 4 098 291 (NPC, 2006) and the total land area of 18 050 square kilometres, and about one-third of this is swampy and waterlogged. It experiences average rainfall of about 2 000 mm per annum with an average monthly temperature of 30.4-36.4℃ and a relative humidly varying from 56%-86% per annum. Delta State is divided into three agricultural zones namely,Delta South, Delta central and Delta North.
A multi-stage sampling procedure was used for the study. The first stage was the random selection of six local government areas, two from each agricultural zone based on the high concentration of garri markets. The selected local government area included: Oshimili South and Ika South in Delta North; Ethiope South-West and Ughelli North in Delta Central; and Uvwie and Isoko South in Delta South. Next was the random selection of major garri markets from each of the six selected local government areas. Thus, a total of six markets were used for the study which were Abavo,Ogbe-ogonogo, Oghara, Ughelli, Effurun and Oleh markets. Finally, 28 major garri marketers wererandomly selected from each market, which gave a total of 168 respondents that were used for the study. Data used for this study was collected using well structured questionnaire.
Descriptive statistical techniques, such as tables,percentages, means and standard deviation were used to aid interpretation and easy explanation. Marketing margin was calculated as the difference between purchase price and selling price expressed as a percentage of selling price. Marketing margins could be expressed in cash or in percentage of the retail cost(Adegeye and Dittoh, 1985). The formula adopted for this study was (Olukosi and Isitor, 1990):
Marketing efficiency at each stage of the channel was measured as:
Marketing efficiency=Value added by marketing/ Cost of marketing services (100)
Thus, marketing efficiency was expressed in percentage.
Chart was used to indicate the channels of garri marketing.
Multiple regression model was used to examine the relationships between the socio-economic characteristics of marketers, as it affected the quantity of cassava product (garri) sold in the study area. Nwaru et al. (2011) and Nwaru and Iwuji (2005) were abli to establish that some socio-economic variables including age and level of education affected the quantity of agricultural products sold, hence, the profit margins of agricultural marketers. Different functional forms were actually tried (semi-log, double log, linear and exponential models).
Mathematically, the linear regression model was implicitly specified as:
Y=F(X1, X2, X3, X4, X5, X6)
While the explicit form of the linear relationship was given as:
Y=b0+b1x1+b2x2+b3x3+b4x4+b5x5+b6x6+e
Where,
Y=Physical quantity or output of garri sold in kilograms
X1=Sex/Gender
X2=Marital status
X3=Level of education
X4=Age
X5=Occupation
X6=Marketing experience
e=Stochastic error term
The double log function was explicitly expressed as:
Log Y=Logb0+b1LogX1+b2LogX2+b3LogX3+
b4LogX4+b5LogX5+b6LogX6+e
The semi log form was expressed as:
Y=Logb0+b1LogX1+b2LogX2+b3LogX3+
b4LogX4+b5LogX5+b6LogX6+e
The exponential functional form was expressed as:
Log Y=b0+b1X1+b2X2+b3X3+b4X4+b5X5+b6X6+e
Where,
Log=Natural logarithm
All other variables were as defined earlier.
However, the linear functional form was the lead equation as it had the highest R2, the highest number of significant variables and the lowest standard error. F value of the linear functional form also fit the data.
Results and Discussion
Socio-economic characteristics of respondents
The study found that females were mostly involved in the marketing of garri. The results shown in Table 1 indicated that 84.5% of the respondents were females,while 15.5% were males, 42.4% of the marketers were married, 10.7% never married, 3.6% divorced, 23.3% widowed and 19.0% were separated; 48.8% of the respondents were within the age range of 41-50 years,while 25.0% of them fell within the range of 21-30 years. This showed that the majority of the respondents were still in their economically active age. It was also found that the majority (33.3%) of the respondents had primary education, 29.8% had secondary education,while 20.2% had no formal education. This showed that the literacy level in the study area was at itsminimum level. The study also showed that 35.3% were farmers/processors, 17.9% of them were wholesalers, while 46.4% were retailers. This showed that the majority of the respondents were retailers and farmers/processors (35.7%) that processed the raw cassava tubers into comestible form (garri).

Table 1 Socio-economic characteristics of respondents
The study revealed that 21.4% of the respondents had marketing experience of the range of 5-9 years,while 31.0% had 10-14 years experience in marketing. The numbers of years in business of trader enabled him or her to know the best ways to make profit and the secrets of the business. The study also revealed that garri marketers to a large extent (37.7%) produced their own commodity for sale.
Again, the study also revealed that a large percentage of the respondents (61.9%) got their source of finance from their own income savings. Because these traders lacked capital (which is a vital ingredient in any business), their returns from investment would be low. And this could hinder expansion of the business. Thus, traders in the study area needed to be educated on how to source for funds, and credits facilities should be made available to them.
Distribution of respondents based on market conduct
Table 2 revealed that the majority (54.1%) of the respondents sold garri in an open air market, while 28.2% of them sold garri in covered/roofed stores/ shops. With this finding, it was obvious that traders who sold their products in the open air market would find it difficult to trade during the rainy season. Therefore, there was great need for market infrastructures in the study area. The majority (91.8%) of the respondents sold their products in intervals of every four market days. And this was the traditional pattern of trading in the study area.
Most of the respondents came from the nearby villages and cities to sell their products in these markets. For this reason, only 28.2% of the traders stored their un-sold products in stores, where they paid on the average, a rent of N5 000 per annum;while 69.4% of the traders carried their un-sold garri home at the end of the market day. The products were usually sold at fixed price while very few traders sold their products through haggling. Most of the traders practiced saled promotion and got involved in tactics against rivals and potential new entrants.

Table 2 Distribution of respondents based on market conduct
Gross margin analyses of garri marketers
Table 3 showed the computation of gross margin of the garri marketers. Gross margin was calculated since it was difficult to determine the garri marketers' fixed costs. Thus gross margin was used as a proxy of marketers' profits. This was justified (Adegeye and Dittoh, 1985). From Table 3, it could be seen that the gross margin of the marketers on the average was high(40 772 Naira), indicating high profit for marketers.
Marketing margins
The data collected from the study indicated that the average selling price of garri at wholesale (supply)level for 50 kg bag of garri was N4 192.94, while at the retail level it was sold at N4 824.71. Therefore, the margins for garri marketers (at wholesale level) could be calculated using this formula:

The marketing margin was also calculated at the retail level using the same formula. These results are concisely presented in Table 4.

Table 3 Gross margin analysis of garri marketing
At the retail level the marketing efficiency (M.E)was calculated as:
Selling price/Purchase price (100)=6100.38/4824.71(100)=126.44%
At the wholesale level of the channel, M.E.= 4824.71/4192.94 (100)=115.07%
Thus, the garri market was more efficient at the retail level in the channel.
Marketing channel for garri
17.9% of the marketers were wholesalers that purchased products from the farmers/processors, while 46.4% were retailers that either purchased directly from the wholesalers or from the farmers/processors. The remaining 35.7% produced their products for sale. The major channels in the area are shown in Fig. 1.In the first channel, the consumer paid much more higher than in the second and the last channels. In the last channel, the consumer bought directly from the farmer (who in most cases were also the processors). Thus, apart from obtaining the product fresh, the consumer also purchased at a lower price, the same price as that of the wholesaler (Adegeye and Dittoh, 1985). In fact, the longer the channel, the more the margin.
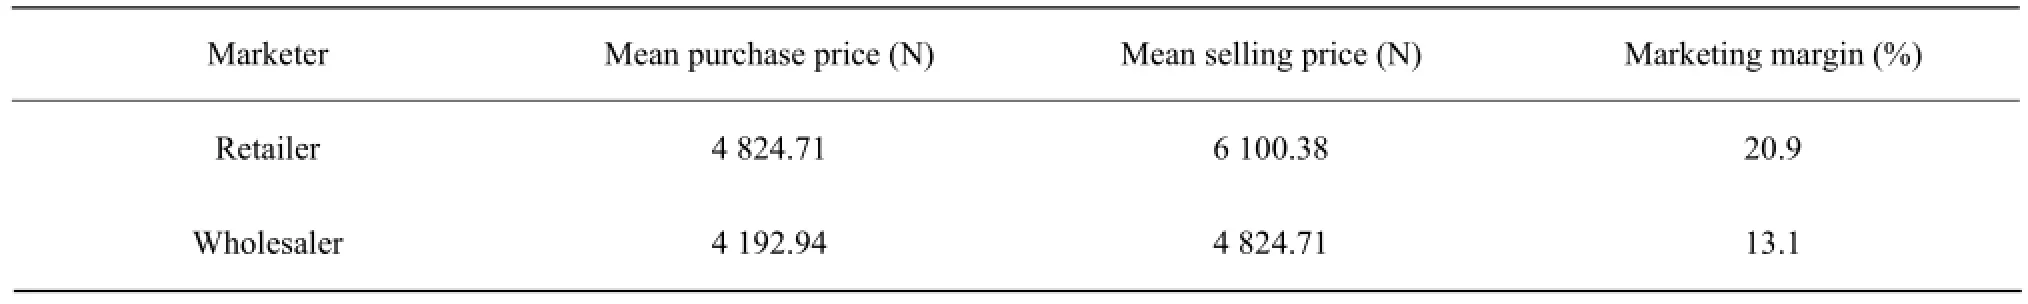
Table 4 Marketing margin at retail and wholesale levels

Fig. 1 Marketing channels for garri
Problems of garri marketers
The major problems encountered by the marketers are highlighted in Table 5. Inadequate finance, transportation problem and poor storage facilities were encountered by majority of the traders.
Regression results
The regression results using linear is shown in Table 6. Since the linear functional form in the regression analysis gave more statistically significant coefficients and higher magnitudes of R square and F value, it was chosen as the lead equation. The result showed that the independent variables combined explained 80.1% of the total variation in output of garri sold or marketed. In other words, the co-efficient of determination(Adjusted R) was used to ascertain the combine effect of the independent variables (Xs) on the dependent variable (Y); the significance of each variable was tested using the critical t-value at 5% level; while the regression significance was determined by F value. The test of R2produced an F value of 8.7364 which was significant at 0.01 level, implying that the linear function gave a good fit to the data. Four of the six explanatory variables were significant. The explanatory variables that were significant at 5% were sex (X1), education (X4), marketing experience(X6) and occupation (X5), while age (X2) and marital status (X3) were not significant. Consequently, from the findings of the regression result some socio-economic characteristics of the marketers to a large extent had positive influences on the quantity of garri sold or marketed in the study area. This result was in agreement with the findings of Nwaru and Iwuji (2005) and Nwaru et al. (2011) who asserted that some socio-economic variables did affect the volume of trade and hence the profit of agricultural marketers. Previous research efforts (Ayanwale and Ajetomobi, 2001) also showed that some socioeconomic variables like household size and age significantly influenced the level of marketing of agricultural products.

Table 5 Problems of garri marketers

Table 6 Regression result (linear)
Conclusions and Recommendation
This study had been able to establish that although the garri marketers incurred some marketing costs and faced many challenges, their marketing activities were nevertheless profitable. However, from the findings,the following recommendations were hereby suggested to improve the marketing of garri in Delta State.
Ⅰ) To ensure efficient marketing of garri, it is very important for the government to build store rooms to augment those owned by individuals and cooperative societies to ensure proper storage and good quality products.
Ⅱ) Agricultural extension services for garri marketers will be necessary in the aspect of information provision and for better price stability and market opportunities.
Ⅲ) The government should provide good road network from the production site (farm) to the market site.Ⅳ) Garri marketers should be enlightened on how to source finance for their marketing business.
Ⅴ) The marketers should be given credit to enable them to expand their business.
Acharya S S, Agarwal N L. 1992. Agricultural prices analysis and policy. Oxford and ISH Publishing Company PVT Ltd., New Delhi.
Adegeye A J, Dittoh J S. 1985. Essentials of agricultural economics. Impact Publishers, Ibadan.
Agbamu J U, Waziri R P. 2007. The marketing of cassava by-product(garri), in Delta State of Nigeria and the implications for agriculturaldevelopment. Proceedings of the 21st Annual National Conference of Farm Management Association of Nigeria (FAMAN), Ayetoro. 2007.
Ayanwale A B, Ajetomobi J O. 2001. The role of household composition in egg consumption in the Obafemi Awolowo University Community. Nigerian Journal of Agricultural Production, 28(1): 98-102.
Beierlein J G, Woolverton M W. 1991. Agri-business marketing. The Management Perspective Prentices Hall, New Jersey, USA.
Buell M J. 1995. Economics and marketing in the tropics. Hongkong London Group.
Crammer G L, Jensen C W, Southgate D D. 2000. Agricultural economics and agri-business. John Wily and Sons. Inc, New York,USA.
FAO. 2008. Online statistical data base, Rome, Italy. Food and Agriculture Organisation of the United Nations.www.fao.org.
Fawole O P, Odebode S O. 2007. Marketing of cassava products among women in Oyo State, Nigeria. Pakistan Journal of Social Sciences,4(1): 118.
Kotler D, Keller K L, Jha M. 2007. Marketing management: a South Asian perspective. 12th ed. Darling Kindersley (India) Pit Ltd, New Delhi, India.
Lawal W L, Ater P I, Ortese T. 2008. Value added cassava enterprises profitability assessment in Benue State, Nigeria. Proceedings of the 22nd Annual National ConferenceJ/FAMAN, Makurdi. pp.72.
Lemchi J, Ifeanyi-Obi C C, Olatunji S O. 2011. Socoi-economic factors affecting the marketing of garri in port harcourt city of Rivers State,Nigeria. Journal of Agriculture and Social Research, 11(2): 22-29.
Nwaru J C, Iwuji O. 2005. Marketing margins and their determinants in plantain marketing in Owerri agricultural zone of Imo State,Nigeria. In: Orheruata A M, Nwokoro S O, Ajayi M T, et al. Asumugha, Agricultural Rebirth for Improved Production in Nigeria. In proceedings of the 39th Annual Conference of the Agricultural Society of Nigeria, University of Benin, Benin City, Nigeria. pp. 385-387.
Nwaru J C, Nwosu A C, Agommuo V C. 2011. Socio-economic determinants of profit in wholesale and retail banana marketing in Umuahia agricultural zone of Abia State, Nigeria. Journal of Sustainable Development in Africa, 13(1): 200-211.
Olukosi J O, Isitor S U. 1990. Introduction to agricultural marketing and prices; principles and applications. Agitab Publication, Zaria.
Olukosi J O, Isitor S U, Ode M O. 2007. Introduction to agricultural marketing and prices. Living Books Series, Abuja.
Oyewole O J, Philip B. 2006. Agro-food chains and sustainable farming. A case study of cassava marketing in Nigeria. Research and Development Centre, University of Agricultue Abeoukuta.
Philip T P, Sanni L O, Akoroda M. 2004. Cassava: an industrial crop. IITA Ibadan.
Reddy S S, Reghu P R, Sastry T V N, et al. 2008. Agricultural economics. Vijay Primlani for Oxford and IBH Publishing Co. PVT. Ltd. 6.
F31 Document code: A Article lD: 1006-8104(2015)-04-0053-09
Received 8 May 2015
Ebewore S O, E-mail: ebeworesolomon@yahoo.com
杂志排行
Journal of Northeast Agricultural University(English Edition)的其它文章
- Effects of Ιnitial Ιnfestation Levels of Callosobruchus maculatus (F.)(Coleoptera: Chrysomelidae) on Cowpea and Use of Nicotiana tabacum L. Aqueous Extract as Grain Protectant
- Ιmpact of Microbial Ιnoculants on Microbial Quantity, Enzyme Activity and Available Nutrient Content in Paddy Soil
- Phenotypic and Genetic Characterization of Bacillus Species Exhibiting Strong Proteolytic Activity Ιsolated from Terasi, An Ιndonesian Fermented Seafood Product
- Effect of Quercetin on Egg Quality and Components in Laying Hens of Different Weeks
- Screening of Adoptive Elite Tea (Camellia sinensis) Clones
- Study on Hexagon-enveloping Leaf-stripping Mechanism for Corn Stalk