Research on Stability of Desert Climate of Minqin County in Gansu Province
2015-11-08ZhaofengCHANGDaweiWANGFuguiHANXiaofengDUAN
Zhaofeng CHANG,Dawei WANG,Fugui HAN,Xiaofeng DUAN
Gansu Desert Control Research Institute,Lanzhou 730070,China
Research on Stability of Desert Climate of Minqin County in Gansu Province
Zhaofeng CHANG*,Dawei WANG,Fugui HAN,Xiaofeng DUAN
Gansu Desert Control Research Institute,Lanzhou 730070,China
In order to study the stability of desert climate,the instability of climate in Minqin desert in response to global warming during 1961-2013 was analyzed by sliding standard deviation and a linear trend line.The results show that the instability of average temperature in January and April increased,and the isothermal date in February was 10.36 d earlier from 1961 to 2013.The instability of extreme maximum temperature in December and January improved.The instability of extreme minimum temperature in July instability also increased.The coefficient of variation of extreme minimum temperature in May was up to 287.3%.It is concluded that the instability of desert climate of Minqin County increased with global warming.The stability of climate is more worthy of attention.
Global warming;Desert climate;Instability;Minqin
I n recent years,global warming has been more attention to all over the world.According to the third assessment report of Intergovernmental Panel on Climate Change(IPCC),global average temperature increased by (0.6±0.2)℃in the 20thcentury,and climate was the warmest from the 1980s to the 1990s among the 100 years[1].The fourth assessment report of IPCC show that global surface average temperature rose by 0.74℃during 1906-2005,and average temperature in the Northern Hemisphere were the highest in the latter half of the 20thcentury among the 1 300 years[2].According to the fifth assessment report of IPCC,climate change has not been seen since the 1950s[3].Moreover,it was the hottest in the Northern Hemisphere in the 30 years from 1983 to 2012 since 1400.
Global warming has caused lots of ecological and environmental problems.For instance,an extreme high temperature event has made seasonal pollen allergy appear earlier in the middle and upper latitudes in the Northern Hemisphere and resulted in increase of human mortality in some areas of Europe[4-5].Chinese scholars predict global average temperature may increase by 1.84℃from today to 2100.If global average temperature increases by 1.5-2.5℃in future(in comparison with 1980-1999),20%-30%of species will be in peril of extinction;if global average temperature rises by above 3.5℃,40%-70%of species will be in peril of extinction[6].
The response to global warming is different in various regions[7].For example, South America, South Africa,North America,central Asia,northwestern China and other arid regions have tended to be dry in recent 100 years,and annual occurrence probability of drought is high in the period of global warming[8].In acid regions of China,annual average temperature increased by 1.8 ℃ from 1961 to 2007[9].Temperature increase in Shaanxi,Gansu,Ningxia and Xinjiang in northwestern China exceeds the national average[7,10].Average temperature in northern Xinjiang in recent 10 years increases by 0.7℃compared with the first 30 years[7].In Ulanaodu re-gion in Kerqin Sandy Land,temperature tends to rise in spring and winter,and the increase in winter is more obvious than that of spring[11].During 1961-2009,the increasing speed of annual mean temperature in Minqin Desert was higher than the global average and the national average in recent 100 years but lower than that in northeast China in recent 20 years[12].
At present,research on climatic instability mainly focuses on geologic climate[13-14].With global warming,annual and interdecadal variations of flood and drought in China have been more obvious.For instance,interannual variability of summer monsoon rainfall in East Asia has enhanced in the 21stcentury,and Asian summer monsoon has become stronger,which has made summerrainfallstrongerin northern and southern China,thereby increasing flood[15].In addition,climate has become more unstable in Hengshui County,Hebei Province[16]and Huojia County,Henan Province[17]with global warming.
In arid and semi-arid regions,many ecological environment problems may be closely related to global warming[18].Climatic instability,especially for instability of extreme temperature,has greater impact on agriculture,forestry and animal husbandry compared with global warming[19-20].A desert is the most fragile ecosystem,but there is no study on stability of desert climate at present.Here the stability of desert climate in Minqin County,Gansu Province was studied.
GeneralSituation ofthe Study Area and Methods
General situation of the study area
Minqin County(101°48′-104°13′E,38°05′-39°27′N)is located in the lower reaches of Shiyang River basin in northwest arid desert and to the west of Tengger Desert,with total land area of 16 016 km2and an elevation of 1 300-1 350 m (Fig.1).Ecological landscape in Minqin County changes from naturalecologicallandscape(before Han Dynasty),degraded ecological landscape (from the Western Han Dynasty to the Republic years),and artificial ecological landscape(since the 1950s).Minqin County is the most typical desertification area in China.According to statistics,the area of desert,gobi,saline-alkali wasteland,low mountains and small hills accounts for 94.20%of total land area in Minqin County at present,and desert area accounts for 55.03%.
In Minqin County,multi-year average precipitation is 116.52 mm,and multi-year average evaporation is 2 351.79 mm;there are 28.2 days of gale with speed≥17 m/s,25.8 days of sandstorm,37.8 days of sand blowing weather,and 30.2 days of floating dust weather.Ground water level has decreased to about 20 m in the oasis and its marginal areas.Due to dry climate and little rainfall,large areas of vegetation died,and meadow in the desert degraded.
Methods of observation and data processing
Meteorological observation data of temperature,air pressure,sunshine duration,rainfall,air humidity,ground temperature,wind speed and direction,days of gale,days of sandstorm,and so forth during 1961-2013 were from Minqin sand control station.Temperature indicators include monthly average temperature,annual average temperature,monthly extreme maximum temperature,monthly extreme minimum temperature,etc,while precipitation indicators contain annual,monthly and daily average precipitation.
Here climate instability refers to great variation in climatic indicators. The variation is shown by three-year sliding standard deviation,and its changing trend is expressed by a linear trend line,while the significance of the changing trend is judged by the significance test of a regression trend line.Data analysis was conducted by SPSS 13.0.The formulas are shown as follows:
where SDiis the ith standard deviation;xjis the jthobserved value;xi=(xj-2+ xj-1+xj)/3,j=1,2,…,n,i=3,4,…,n;yjis the equation of a trend line;k is the slope of a trend line;b is constant term.
Results and Analysis
Responseofclimatein Minqin desert to global warming
From 1961 to 2013,multi-year average temperature in Minqin desert was 7.80℃,while annual average temperature increased significantly(P<0.05),rising by 0.116℃/10 a(Fig.2a).As for monthly average temperature,it enhanced significantly in February,April and June (P<0.05),while there was no significant change in other months (P>0.05)(Fig.2b). Seen from standard deviation of temperature in each month,it was the highest in February,followed by January and December,while it was thelowest in July (Fig.2c).As shown in Fig.2d,the three-year sliding standard deviation of average temperature in January and April tended to increase significantly(P<0.05),while there was no significant increase in other months(P>0.05).
The period from 1961 to 2013 were divided into six groups (1961-1970,1971-1980,1981-1990,1991-2000,2001-2010,and 2011-2013). The standard deviation of average temperature was the maximum in January,followed by April,February,June and March;the increasing trend was significant in February and April(P<0.05);the coefficient of variation reached-42.7%in November(Table 1).
The trend equation of temperature change in February during 1961 to 2013 is y=-0.319 3x3+3.268 2x2-2.973 7x-9.814 5,and the fitting relationship is extremely significant(R2= 0.999 7).If isothermal date is calculated based on the equation,the isothermal date in February during 1961-2013 was 10.36 days earlier.
Variation of extreme maximum temperature in winter and spring
During 1961-2013,annual extreme maximum temperature averaged 37.16℃ ,and the maximum reached 41.0℃ on July 22 in 1997(Fig.3a).The increasing trend of extreme maximum temperature was significant in March and November(P<0.05),while there was no significant increase in other months (P>0.05)(Fig.3b).According to Fig.3c,the standard deviation of extreme maximum temperature was the highest in January,followed by December,February and March,while it was the lowest in June.As shown in Fig.3d,the increasing trend ofthe three-yearsliding standard deviation of extreme maximum temperature was extremely significant in December(P<0.01)and significant in January (P<0.05),while there was no significant increase in other months and the whole year(P>0.05).

Table 1 Changing characteristics of average temperature in each month and a year
According to Table 2,the standard deviation of extreme maximum temperaturewasthemaximum in March,followed by February,April,January and October,while it was the minimum in December;the increasing trend of extreme maximum temperature was not significant(P>0.05);the coefficientofvariation in January(12.5%)was the highest.
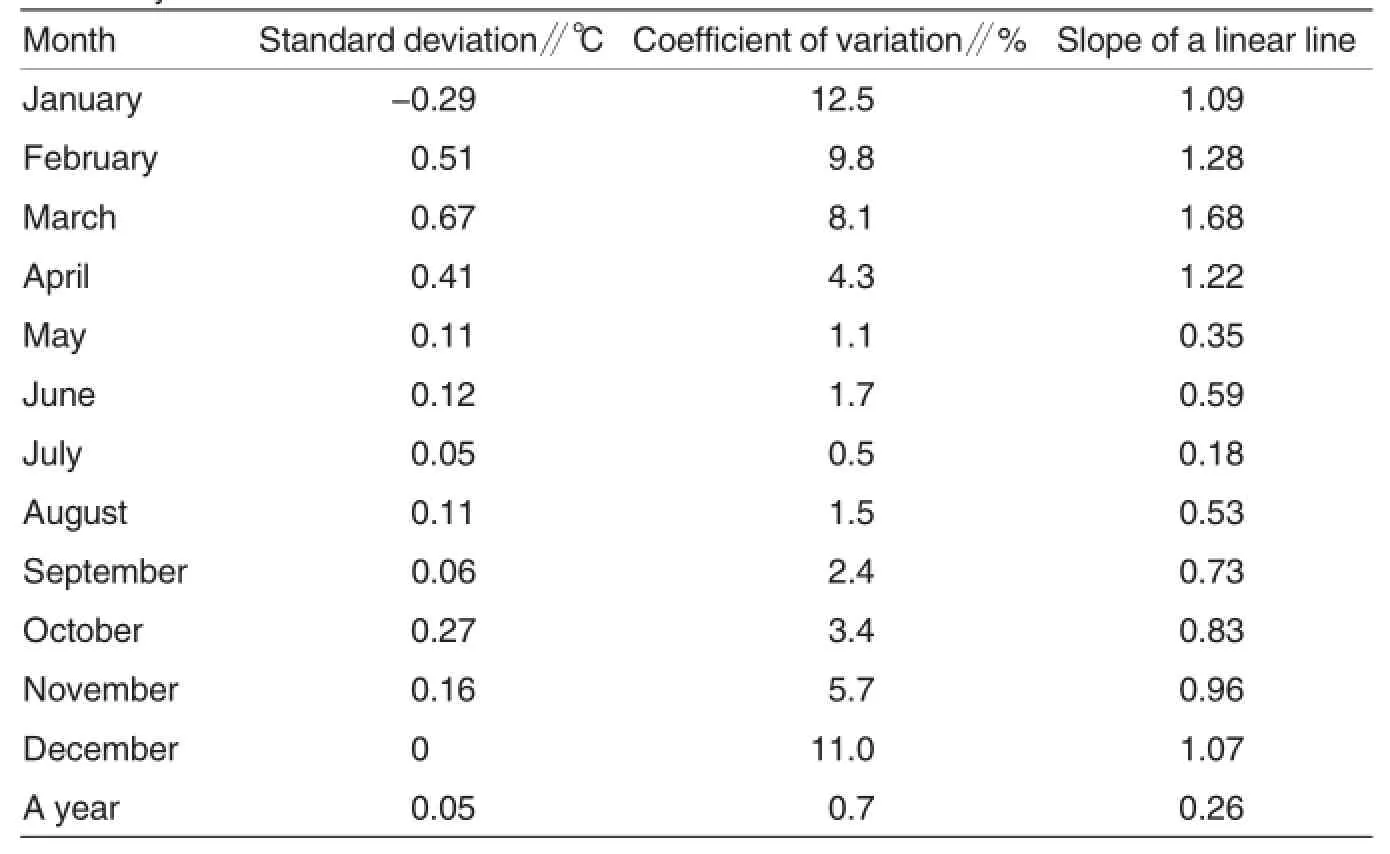
Table 2 Changing characteristics of extreme maximum temperature in each month and a year
Variation of extreme minimum temperature in summer
From 1961 to 2013,annual ex treme minimum temperature was -25.07℃on average,and the minimum was-32.2℃ on February 1 in 2008;the changing trend of extreme minimum temperature was not significant(P>0.05)(Fig.4a).The increasing trend of extreme minimum temperature was extremely significantin September(P<0.01)and significant in April and June(P<0.05)(Fig.4b).As shown in Fig.4c,the standard deviation of extreme minimum temperature was the highest in February,followed byNovember,December,October and March,while it was the lowest in June.As shown in Fig.4d,the decreasing trend ofthe three-yearsliding standard deviation of extreme minimum temperature was extremely significant in May(P<0.01)and significant in March(P<0.05),and the increasing trend of the three-year sliding standard deviation of extreme minimum temperature was significant in July (P<0.05),while there was no significant increase in other months and the whole year(P>0.05).
As shown in Table 3,the standard deviation of extreme minimum temperature was the highest in January,followed by October,April,September,February,and November,while it was the lowest in December;the changing trend of extreme minimum temperature in November and a year was significant(P<0.05),while there was no significant change in other months(P>0.05);the coefficient of variation in May(287.3%)was the highest.
Conclusions
With global warming,annual average temperature,average temperature in February,April and June in Minqin desert increased significantly from 1961 to 2013,and the instability of average temperature in January and April increased.The isothermal date in February during 1961-2013 was 10.36 days earlier.
Extreme maximum temperature in March and November rose significantly,while the instability of extreme maximum temperature in Decemberand January increased;annual extreme minimum temperature,extreme minimum temperature in April,June and September enhanced significantly,and the instability of extreme minimum temperature in July increased,while the coefficient of variation of extreme minimum temperature in May reached 287.3%.Meanwhile,the stability of extreme minimum temperature in March and May enhanced.
In comparison with continuous increase of temperature,climatic instability has greater impact on agricultural and animal husbandry production.In Minqin desert,climatic change,such as sudden increase of extreme maximum temperatureandsuddendecrease of extreme minimum temperature,had significant effects on agricultural and animal husbandry production.
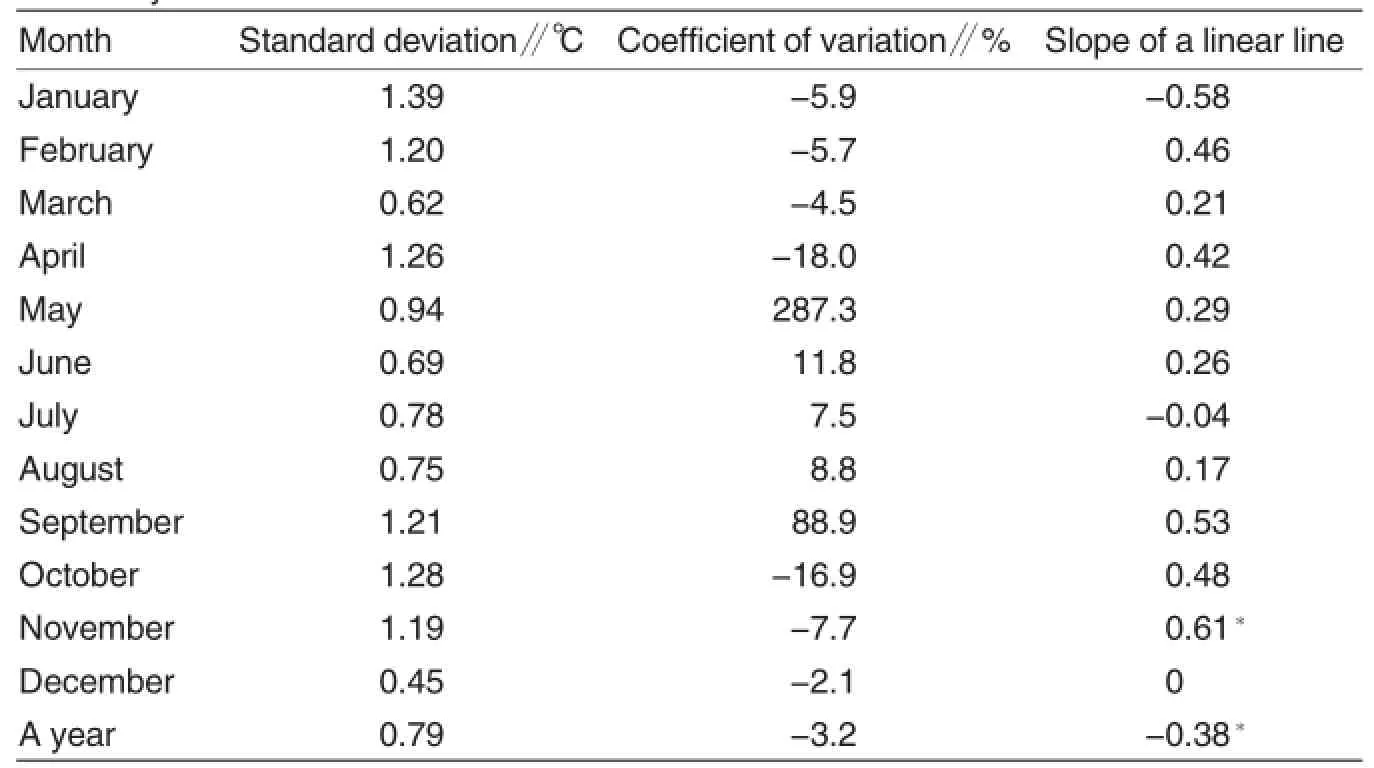
Table 3 Changing characteristics of extreme minimum temperature in each month and a year
Discussion
(1)There is very little vegetation coverage and large areas of bare sand in desert.The specific heat of sand is 0.9×10⁵J/(kg·℃),accounting for 1/4.7 of that of water;the coefficient of heat conductivity of sand is 0.03 W/(m·K),accounting for 1/19 of that of water,so temperature on sand surface increases fast,reaching above 70℃in summer.Large amounts of solar radiation is reflected from bare sand into the atmosphere near the ground,so temperature increases fast in desert in spring. As a result,temperature in desert was sensitive to global warming,and climatic instability enhanced with global warming.
(2)In recent years,some abnormal weather events occurred in China. For instance,a provincial extreme drought appeared in Yunnan Province,China in 2010.In spring of 2011,drought occurred in southern China for seven months.A torrential rainstorm appeared in Beijing on July 21,2012. During June 1-2,2005,a flood occurred suddenly in the Irtysh River basin[21].The events above show that the instability of climatic change has increased.
(3)The main responses of climate in Minqin desert are early increase of temperature and early beginning of phenological phase in spring.In Minqin County,the sown area of wheat and corn is the largest in summer[22].Tem-perature is unstable in spring,which can lead to freeze injury of crops and plants such as grape and apple.In addition,gale and sandstorm are frequent from March to May[23],gale often leads to yield reduction in agriculture and forestry and an accident even.For example,a extremely strong sandstorm appeared in Minqin County on April 24,2010,and the minimum visibility was 0 m,while the instantaneous maximum wind speed reached 28 m/s,so that several events such as power cut and fire occurred.
(4)In the study,sliding average standard deviation was calculated basedonthreedata.Somedata changed greatly,so the changing trend of standard deviation was not significant,but it can not be neglected. On the contrary,the change may reflect climatic instability.
[1]HOUGHTON JT,DING YH,GRIGGS DJ,et al.Climate change 2001:The scientific basis.Contribution of working group I to the third assessment report of the intergovernmental panel on climate change[M].Cambridge,UK:Cambridge University Press,2001:881.
[2]IPCC.Climate Change 2007:Impacts,adaptation and vulnerability contribution of working groupⅡto the fourth assessment repotr of the intergovernmental panel on climate change[M].Cambirdge UK:Cambridge University Press,2007.
[3]QIN DH(秦大河),Thomas S.Highlights of the IPCC Working GroupⅠ Fifth Assessment Report(IPCC第五次评估报告第一工作组报告的亮点结论)[C]. Progressus Inquisitiones DE Mutatione Climatis(气候变化研究进展),2014,10(1):1-6.
[4]IPCC.Summary for policymakers of the synthesis report of the IPCC fourth assessment repotr[M].Cambridge UK:U-niversity Press,2007.
[5]SUN CQ(孙成全),GAO F(高峰),QU JS(曲建升).Latest knowledge on global climate change(全球气候变化的新认识)[J].Chinese Journal of Nature(自然杂志),2002,24(2):114-122.
[6]QIN DH(秦大河),LUO Y(罗勇),CHEN ZL(陈振林),et al.Latest advances in climate change sciences:Interpretation of the synthesis report of the IPCC fourth assessment report(气候变化科学的最新进展—IPCC第四次评估综合报告解析[J].Progressus Inquisitiones DE Mutatione Climatis(气候变化研究进展),2007,3(6):311-314.
[7]DING YH(丁一汇).Prediction of environmental change in western China(中国西部环境变化的预测[A]//QIN DH(秦大河).Assessment of environmental evolution in the west of China(中国西部环境演变评估)[M].Beijing:Science Press(北京:科学出版社),2002:1-231.
[8]LI XZ (李新周),LIU XD(刘晓东),MA ZG (马柱国).Analysis on the drought characteristics in the main arid regions in the world since recent hundred-odd years(近百年来全球主要干旱区的干旱化特征分析)[J].Arid Zone Research(干旱区研究),2004,21(2):97-103.
[9]ZHANG XQ(张雪芹),SUN Y(孙杨),MAO WY(毛炜峄),et al.Regional response of temperature change in the arid regions of China to global warming(中国干旱区气温变化对全球变暖的区域响应)[J].Arid Zone Research(干旱区研究),2010,27(4):582-599.
[10]QIN DH(秦大河),DING YH(丁一汇),WANG SW (王绍武),et al.Ecological and environmental change in western China and its response strategy(中国西部生态环境变化与对策建议)[J].Advances in Earth Science(地球科学进展),2002,17(3):314-319.
[11]JIANG DM(蒋德明),WANG HM(王红梅),LI XH(李雪华),et al.Analysis on the change trend of air temperature in the Ulan'aodu region in the Horqin Sandland(科尔沁沙地乌兰敖都地区气温变化趋势分析)[J].Arid Zone Research(干旱区研究),2005,22(3): 322-325.
[12]ZHU SJ,CHANG ZF.Temperature and precipitation trends in Minqin desert during the period of 1961-2007[J].Journal of Arid Land,2011,3(3): 2140-219.
[13]CHEN YM (陈一萌).Instability of climate in the last glacial period recorded by Yuanbao loess profiles(塬堡黄土剖面记录的末次冰期气候不稳定性)[J]. Progress in Natural Science(自然科学进展),2008,18(5):538-545.
[14]PANG YZ(庞有智),ZHANG HC(张虎才),CHANG FQ(常凤琴),et al.Instability record of the late glacial period in the southern Tengger Desert(腾格里沙漠南缘末次冰消期气候不稳定性记录)[J].Quaternary Sciences(第四纪研究),2010,31(1):69-79.
[15]HUANG RH(黄荣辉),DU ZC(杜振彩). Evolution characteristics and trend of droughts and floods in China under the background of global warming(全球变暖背景下中国旱涝气候灾害的演变特征及趋势)[J].Chinese Journal of Nature(自然杂志),2010,32(4):187-195.
[16]WANG RY(王荣英),LI CQ(李春强),WU Y(吴雁),et al.Impact of climate changes on freezing injury to fruit trees and defensive measures(气候变化对果树冻害的影响及其防御对策)[J]. Journal of Anhui Agricultural Sciences(安徽农业科学),2012,40(9):5310-5312.
[17]SONG PL(宋培玲),ZHU XJ(祝新建). Extreme climatic events and their impact in Huojia County in 2009(获嘉县2009年极端气候事件及其影响)[J]. Modern AgriculturalScience and Technology(现代农业科技),2011,24(4):300-301.
[18]HU RJ(胡汝骥),FAN ZL(樊自立),WANG YJ(王亚俊),et al.Assessment about the impact of climate change on environment in Xinjiang since recent 50 years(近50a新疆气候变化对环境影响评估)[J].Arid Land Geography(干旱区地理),2001,24(2):97-103.
[19]LIANG XM(郎咸梅),SUI Y(隋月).Prediction of changes in average climate and extreme climatic events in China under the background of global warming(全球变暖2℃情景下中国平均气候和极端气候事件变化预估)[J].Chinese Science Bulletin(科学通报),2013,58(8):734-742.
[20]CAO L(曹玲),LI YY(李岩瑛),LIU MC(刘明春),et al.Change characteristics ofextreme weather and climatic events over the Hexi Corridor during the period of 1958-2006(1958-2006年河西走廊极端天气气候事件变化特征)[J].Arid Zone Research(干旱区研究),2009,26(5):649-655.
[21]Nuerlan H(努尔兰·哈再孜),Mahat M(马哈提·穆拉提别克),MAHASAT H(玛哈萨提·哈孜哈力).A flood in the Ertix River Basin in Xinjiang(新疆额尔齐斯河流域 “2005·6·1”大洪水分析)[J].Arid Zone Research(干旱区研究),2013,30(6):981-985.
[22]CHANG ZF(常兆丰),QIU GY(邱国玉),ZHAO M (赵明).Responses of plant phenology to climate warming in Minqin desert area(民勤荒漠区植物物候对气候变暖的响应)[J].Acta Ecologica Sinica(生态学报),2009,29(10):5195-5206.
[23]CHANG ZF(常兆丰),ZHAO M(赵明). Study on ecology in Minqin desert(民勤荒漠生态研究)[M].Lanzhou:Gansu Science And Technology Press(兰州:甘肃科学技术出版社),2006:50-63.
Responsible editor:Yingying YANG
Responsible proofreader:Xiaoyan WU
甘肃民勤荒漠气候的稳定性研究
常兆丰*,王大为,韩福贵,段晓峰 (甘肃省治沙研究所,甘肃兰州 730070)
为研究在全球变暖过程中沙漠气候的稳定性,以中国西北部的民勤荒漠区1961~2013年的气象观测资料,运用一次线性趋势线和滑动标准差等方法,分析民勤荒漠气候在响应全球变暖过程中的不稳定性。结果表明:(1)1月和4月的平均气温的不稳定性增大,2月的等温日期提前10.36天。(2)12月和1月的极端最高气温的不稳定性增大,7月的极端最低气温的不稳定性增大,5月的极端最低气温的变异系数高达287.3%。研究结论认为,随着全球变暖民勤荒漠气候的不稳定性增强。气候的稳定性更值得人们关注。
全球变暖;荒漠气候;不稳定性;民勤
国家重点基础研究发展计划项目(973计划项目)(2014CB460611)。
常兆丰(1957-),男,甘肃会宁人,研究员,硕士,从事荒漠生态研究,E-mail:czf123@sina.com。*通讯作者。
2015-09-22
Supported by the Major State Basic Research Development Program (973 Program)(2014CB460611).
*Corresponding author.E-mail:czf123@sina.com
Received:September 22,2015 Accepted:December 1,2015
修回日期 2015-12-01
猜你喜欢
杂志排行
Agricultural Science & Technology的其它文章
- Study on Engineering Characteristics and Application of Sticky Rice
- Periodical Development Trend of Vertical Greening
- Advances in Microbial Remediation on the Application of Heavy Metal Pollution in Agricultural Water Resources
- Analysis on Status quo and Future Development of Fruit and Vegetable Protreatment
- Effect of Three Treatment Measures on Harmless Seedling Raising of Pinus sylvestris var. mongolica Litv.
- Discussions and Recommendations for Supervision of Vegetable Quality and Safety in Miyun County