Extraction of cable forces due to dead load in cable-stayed bridges under random vehicle loads
2015-07-25LiuXiaolingHuangQiaoRenYuanFanYehuaChenPing
Liu XiaolingHuang QiaoRen YuanFan YehuaChen Ping
(1School of of Transportation,Southeast University,Nanjing 210096,China)
(2Nanjing No.3 Yangtze River Bridge Co.,Ltd,Nanjing 211808,China)
Extraction of cable forces due to dead load in cable-stayed bridges under random vehicle loads
Liu Xiaoling1Huang Qiao1Ren Yuan1Fan Yehua2Chen Ping2
(1School of of Transportation,Southeast University,Nanjing 210096,China)
(2Nanjing No.3 Yangtze River Bridge Co.,Ltd,Nanjing 211808,China)
To extract the cable forcesdue to dead load in cablestayed bridges from themonitoring data,the effects of various factors are eliminated step by step by different statistical methods.The information of cable tension sensors recorded by the healthmonitoring system of Nanjing No.3 Yangtze River Bridge is taken as an example.Temperature effects are eliminated by linear fitting analysis;a 5-level wavelet denoisingmethod is applied to eliminate the noise signal by the wavelet basis function of DB8.The rest cable force data is tested by the method of extreme-value type-Ⅲdistribution,and the fitted location parameter is selected as the cable force due to dead load.The results show that the cable force has a linear relationship w ith temperature.Sometimes,the temperature effect is significant.Noise effect accounts for a small percentage,and the vehicle loads effect has twice the temperature effect on the traffic volume in 2007.The calculation results of other stay cables verify the reliability and validity of the proposed method.
cable force;health monitoring;temperature effect;distribution fitting
Long-span cable-stayed bridges usually play an important and crucial role in traffic.Nevertheless,environmental erosion and vehicle loads lead to impaction and then cause deterioration of structural behavior.Once the bridge structure collapses,itw ill cause enormous loss of life and econom ic losses.At present,many cablestayed bridges are equipped w ith a health monitoring system(HMS)[1].As a new inspection method,the HMS has been further highlighted by the bridge managers due to its important performance in diagnosis andmaintenance since the 1930s[2].
The HMS is often equipped w ith hundreds,even thousands of sensors to monitor various indices information. Continuous operation of these sensorswill inevitably generate numerous data[3].Meanwhile,monitoring data consists of effect of noise,temperatures and vehicles,etc.It is necessary to know how to separate them_ and obtain a uniform standard for effective assessment[46].However,data processing technology has not developed so far.Accumulation of massive data may restrict the development of the HMS.
In this paper,themonitoring data of cable force recorded in the HMS of the Nanjing No.3 Yangtze River Bridge during its closure was taken as an example.First,the correlation between temperature and cable force was analyzed.Data of stay cableswas unified to the temperature during the closure of the bridge.A fterwards,the wavelet de-noising method was used to elim inate the noise signal.In this way,the vehicle load-induced cable force was obtained.Finally,the extreme-value type-Ⅲdistribution was analyzed to obtain the cable force due to dead load.
1 Sensor Information
The Nanjing No.3 Yangtze River Bridge is a double pylon cable-stayed bridge w ith a steel box girder and towers.Itsmain span is 648 m.It was opened to traffic in 2005.The HMS was put into use in the next year[7].By installing various types of sensors,many items such as temperature,cable force,deflection of the main girder,vibration and stress can bemonitored.
First,the information of temperature and stay cable sensors was focused on.Six temperature sensors in total were installed in the HMS of the bridge.Some of them failed,and only the sensor located in 0#girder at the south pylon was available.Its measurement precision is ±0.3℃.The bridge consists of 168 cables,each of which is equipped w ith a pressure ring sensor.Itsmeasurement precision is 1%.The sampling frequency of the temperature and the stay cable sensors is 10 Hz.Therefore,42 upstream cables located at both sides of the south pylon were taken as examples.The cable sensor numbers were set as follows:The numbers of stay cables on the bank side were set from A1 to A21 according to the cable length,and the numbers of stay cables on the river side were set from J1 to J21.The layout of the two kinds of sensors is shown in Fig.1.According to the analysis re-sults of the finite elementmodel under temperature load,the cable force of 15#cable at the south pylon near the bank was deeply influenced by temperature.Therefore,A15 cable was selected for further analysis.

Fig.1 The layoutof the temperature and the stay cable sensors
2 Elim ination of Temperature Effect
Three days’data obtained from March 24 to 26,2007 was analyzed.It is worth mentioning that the closure of the bridge from 5 to 9 o’clock on March 25 due to fog weather provided the reference line for the subsequent analysis.The temperature during the three days and the cable force of the A15 cablemonitoring data are shown in Fig.2.
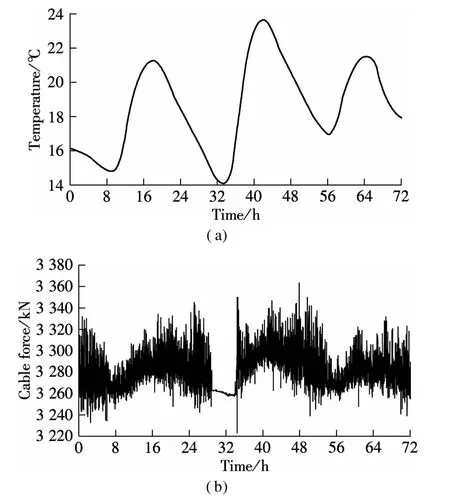
Fig.2 Three days’data of temperature and the cable force.(a)Temperature data;(b)Cable force of A15 cable
Due to the lack in temperature data of section distribution,similar data from the steel box girder is taken from Ref.[8].It is assumed that the girder temperature and air temperature have the same trends except at different depths.Therefore,the girder temperature can be used as the same reference.The correlation results between the cable force and the temperature are still reliable.
From 5 to 9 o’clock on March 25,itwas assumed that the cable force is only influenced by temperature.The linear fitting result is shown in Fig.3.
As shown in Fig.3,the temperature and the cable force of A15 cable have a significantly linear relationship.The adjusted coefficient of determ ination is 0.94.The linear fitting equation is Y=3 219.6+2.76X,where Y is the monitoring value of cable force;X is the temperaturemonitoring value.
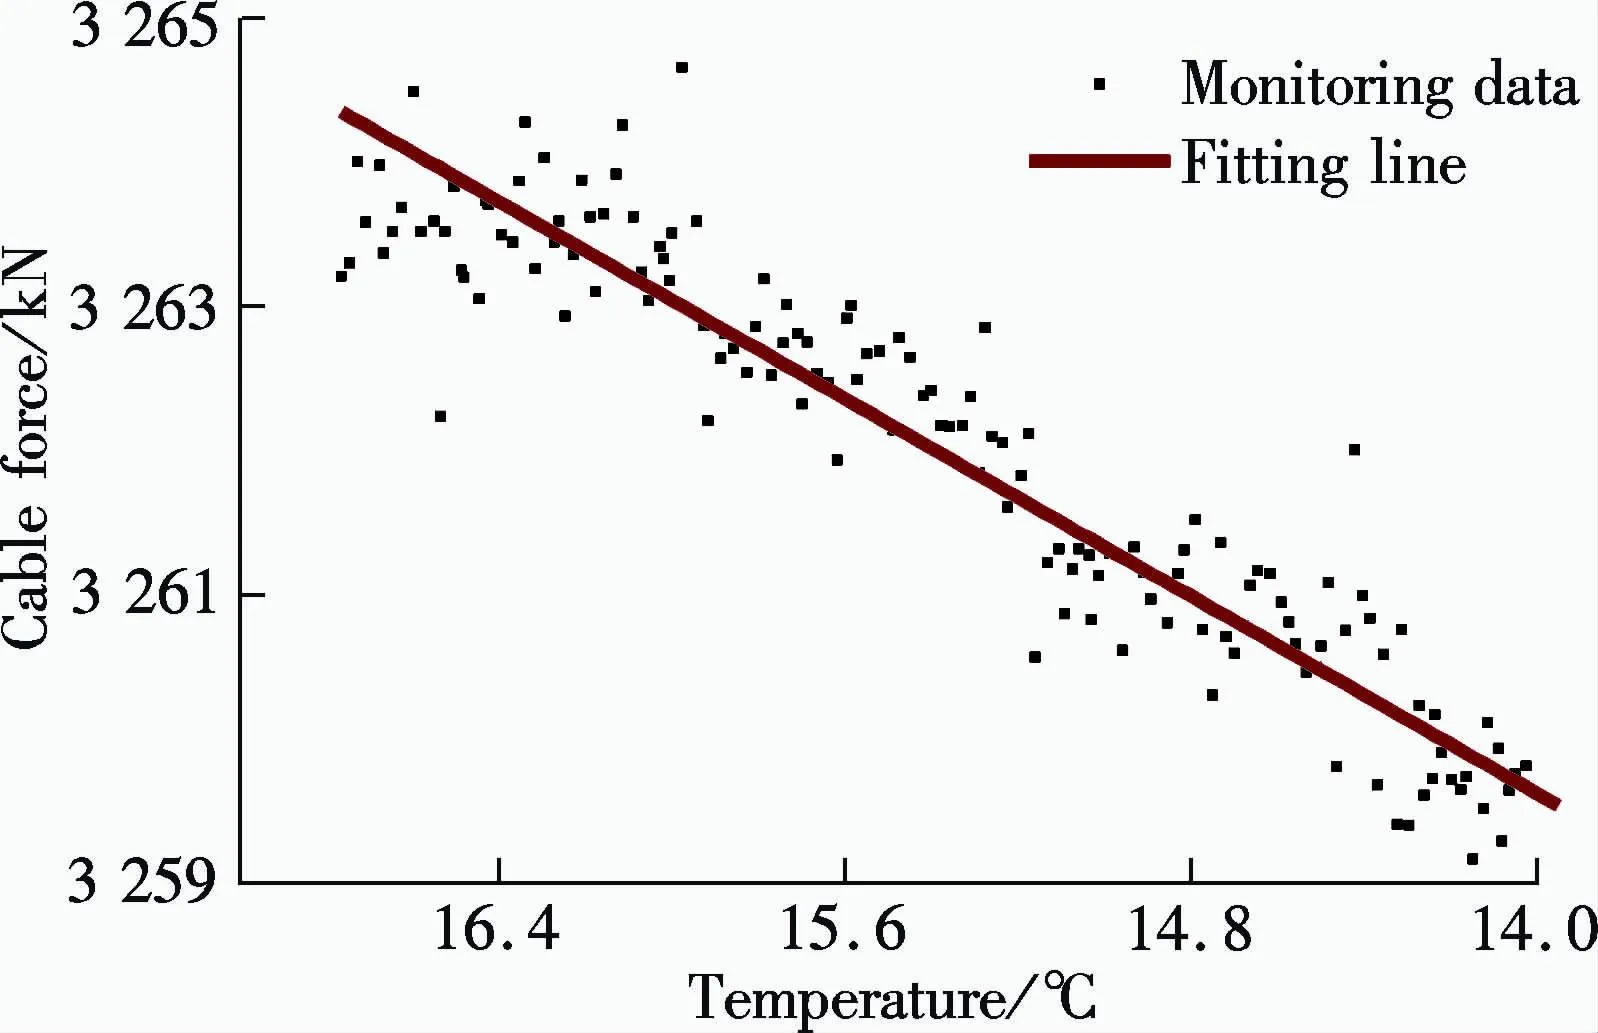
Fig.3 Linear fitting between the cable force and temperature of A15 cable
Meanwhile,based on the numerical analysis results,the linear fitting equation was still valid when the temperature exceeded 20℃.In the linear fitting equation,the cable force of A15 cablewas unified to the temperature of the complete bridge,namely 20℃.The cable force due to dead load during the closure of the bridge of A15 cable was obtained,that is,3 219.6+2.76×20=3 274.8 kN,which is approximately equal to the cable force due to the dead load of the complete bridge(3 295 kN).It is thus clear that the sensor of A15 cable worked well and the cable force extracted from the closure of bridge was reliable.
A fter the temperature effect was obtained via the data collected during the closure of bridge,two days’data of A15 cable from March 23 to 24,2007 under the random vehicle loads was selected for further analysis.
3 Elim ination of Noise
The data of A15 cable is composed of three parts:impact from vehicle loads,temperature effect and noise.Temperature effect can be obtained by the above linear fitting.Hence,the temperature-induced change values were 2.76×(X-20).Noise can be elim inated by the wavelet de-noising method.By the waveletmethod,the multi-level decomposition of the original data can be realized;and one or more layers of high frequency components can also be filtered out.The detailed approach has proved to be effective.The de-noising effect of DB8 plays themost significant role[9].Hence,it is selected as thewaveletbasis function.The rest impact came from vehicle loads.Fig.4 shows the monitoring data of A15 cable.
According to the linear fitting equation,the calculated temperature-induced change rate of A15 cable was 2.76 kN/℃.The variation of the two days’temperature was 6.5℃.Hence,the temperature-induced change value of cable force was 17.9 kN.The noise-induced change value of cable force was 4 kN.Therefore,the noise effect accounted for a small percentage.The maximum vehicle loads induced change value of cable force was 107.4 kN under the traffic volume during those two days.
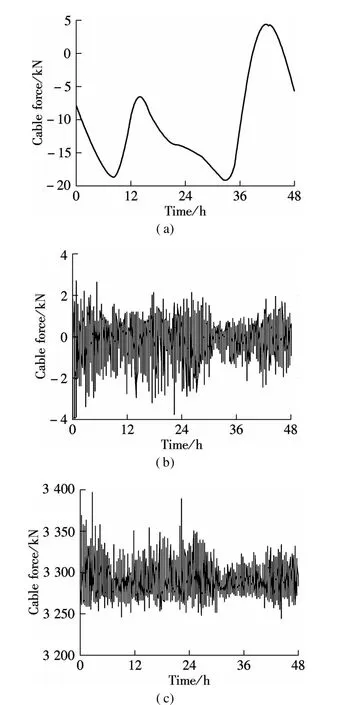
Fig.4 The monitoring data for A15 cable.(a)Temperature-induced change values;(b)Noise signal;(c)Vehicle and dead loads-induced change values
4 Extraction of Cable Forces due to Dead Load
First,the data of the stay cable with a uniform temperature of 20℃during the completion of the bridge was obtained.Secondly,the data of the stay cable w ithout a noise signal was obtained.Finally,the rest cable force involving vehicle loads and the dead loads was obtained.Therefore,it was essential to separate them.A method was proposed for the extraction of cable forces due to dead load under random vehicle loads.
4.1 Distribution fitting
A distribution fitting method was proposed to find the cable force due to dead load.Under the random vehicle loads,the data fluctuated around the cable force due to dead load.It can be inferred that themaximum probability density value obtained from the fitted distribution function was the cable force due to dead load.
Through the distribution fitting analysis of the cable forces,it can be concluded that the cable force monitoring data obeys an extreme-value type-Ⅲdistribution[10].
Its cumulative distribution function is

where r,b,a indicate the shape parameter,the location parameter and the scale parameter,respectively;and I(u)is the indicated function,

The data of A15 cable without impacts of temperature and noise was analyzed to fit the extreme-value type-Ⅲdistribution.The fitted probability density function is shown in Fig.5.From Fig.5,it can be seen that the vehicle and dead loads-induced cable forces of A15 cable obey an extreme-value type-Ⅲdistribution.The low and the high cable forces are relatively small.The cable force valuesmainly concentrate around the cable force due to dead load.
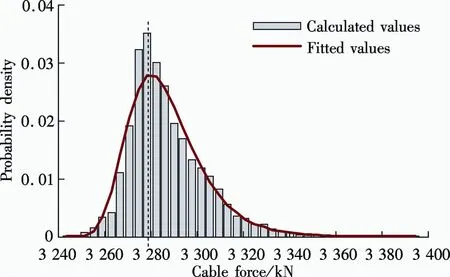
Fig.5 Distribution fitting of themonitoring data for A15 cable
According to the fitting result,the corresponding values of the fitted distribution can be calculated.r,b and a were-0.05,3278.5 and 12.98,respectively.The value of the location parameter reflected the cable force w ith themaximum probability density,which is located at the dotted line as shown in Fig.5.The location parameter(b=3 278.5 kN)is regarded as the cable force under dead load.It is approximately equal to the cable force due to the dead load,which was obtained during the closure of the bridge(3 274.8 kN).Therefore,it can be used as the unified evaluation index.It also provided amore accurate data base for condition assessments of the bridge.
Through the analysis of the generalized extreme-value cumulative distribution function,the maximum vehicle loads-induced change value of the A15 cable with the guarantee rate of 95%was 35.8 kN under traffic volume from March 23 to 24,2007.According to the statistical results,the ratio of vehicle load to temperature for A15 cable was about 2∶1.This conclusion indicates that the temperature effect is half of the vehicle load under the traffic conditions in 2007.Therefore,the temperature hasa significant effect.
4.2 Verification
To validate the method,the cable forces of 42 upstream cables located at both sides of the south pylon were calculated by the method above.The calculation steps are as follows:
1)Linear fitting between the cable force and the temperature was realized via the data obtained during the closure of the bridge.The temperature-induced cable force change rate was stored for uniform temperature effect.The theoretical cable force due to dead load was obtained after the elim ination of the temperature effect and then was verified by the cable force due to the dead load of the completed bridge.
2)The wavelet de-noising method was applied to eliminate the noise signal for the monitoring data under random vehicle loads through the application of the wavelet basis function of DB8.
3)The rest cable force data was tested by the extremevalue type-Ⅲdistribution.The location parameter of the fitted curve was stored to represent the cable force due to dead load.
Tab.1 shows the calculated and theoretical values and relevant errors of the typical stay cables.The calculated values indicate that the cable force is due to dead load,which was obtained from the distribution fitting of the monitoring data under random vehicle loads.The theoretical value indicates that the cable force is due to dead load obtained from the closure of bridge.Some deficient sensors are not represented in the table.As shown in Tab.1,the calculated values are approximately equal to the cable force due to dead load,which was obtained from the closure of the bridge.The calculation results verify the accuracy and high efficiency of the proposed method.Furthermore,the approach explains the physicalmeaning of the cable force due to dead load under random vehicle loads.
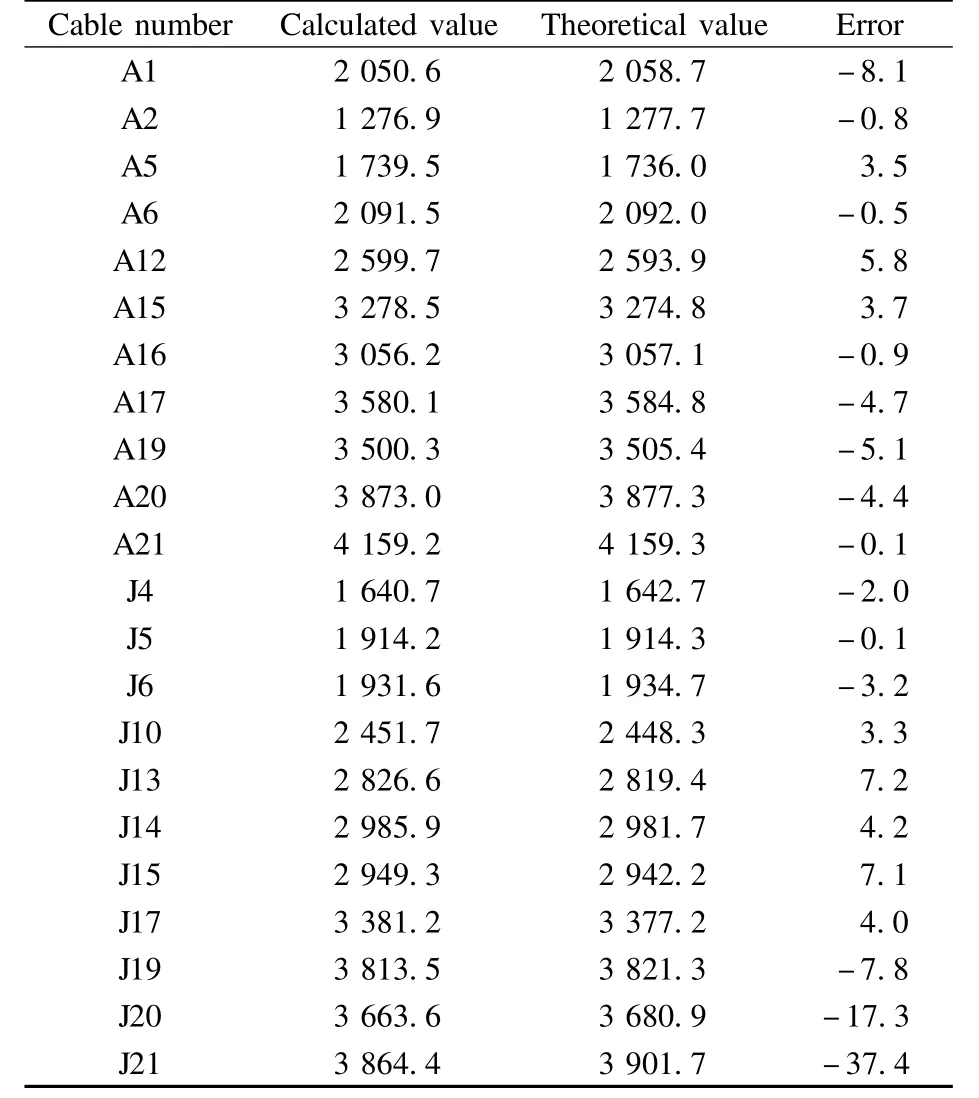
Tab.1 Typical calculated and theoretical values and their errors of the cable force kN_
5 Conclusions
1)A significant linear correlation exists between cable force and temperature.Sometimes,temperature shows significant effect.
2)Through the linear fitting and the wavelet de-noising,the com position of the monitoring data can be obtained.The noise effectaccounts for a small percentage.The tem perature effect is half of the vehicle load effect under the traffic volume from M arch 23 to 24,2007.
3)The vehicle load-induced cable force obeys an extreme-value type-Ⅲdistribution.The value of the location parameter is approximately equal to the cable force due to dead load,and it can be used as a unified evaluation index.
[1]Wenzel H.Healthmonitoring of bridges[M].John W iley&Sons,2008.
[2]Carder D S.Observed vibrations of bridges[J].Bulletin of the Seismological Society of America,1937,27(4):267- 303.
[3]Tan D M,Qu W L,Zhang JB,etal.Damage identification of cable of long span cable-stayed bridge[J].Journal ofWuhan University of Technology,2012,34(7):107-110.(in Chinese)
[4]Zonta D,Bruschetta F,Zandonini R,et al.Analysis of monitoring data from cable-stayed bridge using sensor fusion techniques[C]//Proceedings of SPIE.San Diego,CA,USA,2013:869229-1- 869229-8.
[5]Huang Q,Ren Y,Lin Y Z.Application of uncertain type of AHP to condition assessment of cable-stayed bridges[J].Journal of Southeast University:English Edition 2007,23(4):599- 603.
[6]Ko JM,Wang JY,Ni Y Q,etal.Observation on environmental variability ofmodal properties of a cable-stayed bridge from one-year monitoring data[C]//Proceedings of the 4th International Workshop on Structural Health Monitoring.Stanford,CA,USA,2003:467- 474.
[7]Meng Q C,Qi X,Li Q.Research of optimal placement of sensors for healthmonitoring system of the 3rd Nanjing Changjiang River Bridge[J].Bridge Construction,2007(5):111- 119.(in Chinese)
[8]Cao Y,Yim J,Zhao Y,etal.Temperature effects on cable stayed bridge using health monitoring system:a case study[J].Structural Health Monitoring,2011,10(5):523 -537.
[9]Guo J,Gu ZW,Sun B N,etal.Method of bridge health monitoring based on wavelet analysis[J].EngineeringMechanics,2006,19(12):129- 135.
[10]Liu H.W ind environment investigation research on the site of a cross-sea cable-stayed bridge[J].Key Engineering Materials,2011,:1489- 1495.
随机车流作用下的斜拉桥恒载索力的提取
刘小玲1黄 侨1任 远1樊叶华2陈 平2
(1东南大学交通学院,南京210096)
(2南京长江第三大桥有限责任公司,南京211808)
为了提取斜拉桥监测数据中的恒载索力,使用不同统计方法逐级剔除各类因素的影响.以南京长江三桥健康监测系统采集的索力传感器信息为依托,采用线性拟合剔除温度的影响;采用小波基函数为DB8的5级小波降噪方法剔除噪声信号;采用极值Ⅲ型分布拟合检验,取拟合的位置参数作为恒载索力.结果表明:索力和温度呈线性关系,有时温度效应较显著;噪声影响量较小;2007年交通状况下,车辆荷载影响量是温度影响量的2倍.多根拉索的计算结果验证了所提方法的可靠性和正确性.
索力;健康监测;温度效应;分布拟合
U446.2
10.3969/j.issn.1003-7985.2015.03.019
2015-01-13.
Biographies:Liu Xiaoling(1988—),female,graduate;Huang Qiao(corresponding author),male,doctor,professor,qhuanghit@126.com.
s:The National Natural Science Foundation of China(No.51208096),the Major Scientific and Technological Special Project of Jiangsu Provincial Communications Department(No.2014Y02).
:Liu Xiaoling,Huang Qiao,Ren Yuan,et al.Extraction of cable forces due to dead load in cable-stayed bridges under random vehicle loads[J].Journal of Southeast University(English Edition),2015,31(3):407- 411.
10.3969/j.issn.1003-7985.2015.03.019
猜你喜欢
杂志排行
Journal of Southeast University(English Edition)的其它文章
- CoMP-transm ission-based energy-efficient scheme selection algorithm for LTE-A system s
- Detection optim ization for resonance region radar w ith densemulti-carrier waveform
- Dimensional emotion recognition in whispered speech signal based on cognitive performance evaluation
- Cascaded projection of Gaussian m ixturemodel for emotion recognition in speech and ECG signals
- Action recognition using a hierarchy of feature groups
- Ergodic capacity analysis for device-to-device communication underlaying cellular networks
