Bayesian meta-analysis of regional biomass factors for Quercus mongolica forests in South Korea
2015-06-09••••
••••
ORIGINAL PAPER
Bayesian meta-analysis of regional biomass factors for Quercus mongolica forests in South Korea
Tzeng Yih Lam1,2•Xiaodong Li1•Rae Hyun Kim1•Kyeong Hak Lee1•Yeong Mo Son1
©Northeast Forestry University and Springer-Verlag Berlin Heidelberg 2015
Indirect approaches to estimation of biomass factors are often applied to measure carbon f l ux in the forestry sector.An assumption underlying a country-level carbon stock estimate is the representativeness of these factors.Although intensive studies have been conducted to quantify biomass factors,each study typically covers a limited geographic area.The goal of this study was to employ a meta-analysis approach to develop regional biomass factors forQuercus mongolicaforests in South Korea. The biomass factors of interest were biomass conversion and expansion factor(BCEF),biomass expansion factor (BEF)and root-to-shoot ratio(RSR).Our objectives were to select probability density functions(PDFs)that best fi tted the three biomass factors and to quantify their means and uncertainties.A total of 12 scientif i c publications were selected as data sources based on a set of criteria.From these publications we chose 52 study sites spread out across South Korea.The statistical model for the metaanalysis was a multilevel model with publication(data source)as the nesting factor specif i ed under the Bayesian framework.Gamma,Log-normal and Weibull PDFs were evaluated.The Log-normal PDF yielded the best quantitative and qualitative f i t for the three biomass factors. However,a poor f i t of the PDF to the long right tail of observed BEF and RSR distributions was apparent.The median posterior estimates for means and 95%credible intervals for BCEF,BEF and RSR across all 12 publications were 1.016(0.800–1.299),1.414(1.304–1.560)and 0.260(0.200–0.335),respectively.The Log-normal PDF proved useful for estimating carbon stock ofQ.mongolicaforests on a regional scale and for uncertainty analysis based on Monte Carlo simulation.
Uncertainty analysis⋅Monte Carlo simulation⋅Bayesian hierarchical model⋅Nesting structure⋅Biomass estimation
Introduction
Estimation of carbon f l ux has become important for countries seeking to comply with their agreements under the United Nations Framework Convention on Climate Change(UNFCCC)and to implement their commitments under the Kyoto Protocol(Van Camp et al.2004).Unlike in other sectors,direct measurement of carbon f l ux in the land use,land use change and forestry(LULUCF)sector is diff i cult,and indirect methods often must be used(Somogyi et al.2007).One common indirect method is to f i rst estimate forest biomass and then convert it to carbon stock based on the carbon fraction.Calculation of forest biomassinvolves converting forest inventory estimates of the volume of growing stock by using conversion techniques such as biomass factors and biomass equations(Jalkanen et al. 2005).Biomass factors convert,expand or reduce stand volume estimates to biomass estimates,and biomass equations predict biomass as a function of stand structural variables(Somogyi et al.2007).The factor approach is the Tier 1 method in the Intergovernmental Panel on Climate Change(IPCC)guidelines(IPCC 2006b),which is adopted by many countries in their reporting.Hence,reliable estimates of growing stock and biomass factors are crucial for accurately estimating changes in forest biomass and carbon stock.
An implicit assumption underlying a country-level carbon stock estimate is the representativeness of the growing stock estimate and biomass factors.Growing stock is generally derived from a national forest inventory(NFI), whose design is usually probability-based and covers a large geographic area(Schroeder et al.1997).Thus,the estimate is statistically valid and representative on the country-level.However,most country NFIs are primarily intended for monitoring economically interesting wood volumes for the purpose of making sound management plans(Van Camp et al.2004).Furthermore,NFIs generally do not measure non-commercial tree components such as branches,foliage and roots(Schroeder et al.1997).Thus, biomass factors are relied upon to adequately quantify above-and below-ground biomass.
Developing representative biomass factors is a challenging task.Intensive studies have been conducted to quantify biomass and develop factors,but each study normally covers a limited geographical range(Schroeder et al. 1997).Due to logistic and cost constraints,most countries undertake only a few studies at few sites(Van Camp et al. 2004).In some instances,forests with greater than average biomass for a region tend to be selected for study,which results in an overestimation of national biomass(Brown and Lugo 1982;Fang and Wang 2001).Furthermore,biomass factors can vary greatly depending on location and forest structure(Brown 2002;Na´var 2010).Therefore, applying biomass factors from any single study to predict country-level biomass is hindered by lack of representativeness.In contrast,combining information from all available studies could,by increasing the scope of inference,enhance the reliability of the biomass factors.The method of meta-analysis offers an opportunity for such an analysis.
Meta-analysis is a statistical synthesis of results from a series of studies(Borenstein et al.2009).Its application is widespread in medical and social sciences but less so in natural science.The process is similar to conducting any research,i.e.,research formulation,data collection,evaluation,analysis and interpretation(Hartung et al.2008).An important aspect is unequivocal def i nition of the population to which generalization will be made(Hedges 1994).This will drive the search for relevant sources of information, many of which will be scientif i c publications.However, publication bias due to a lack of reporting on research with insignif i cant conclusions has to be taken into account (Hartung et al.2008),and analysis will only be meaningful if information sources have been collected systematically (Borenstein et al.2009).A wide range of statistical models is available to combine published results,and the choice of model depends on the nature of the underlying problem (Hartung et al.2008).In short,successful application of meta-analysis requires adequate understanding of these stages.
Several studies illustrated the effort to access a large number of sources to construct a dataset for meta-analysis of biomass factors and equations.Teobaldelli et al.(2009) developed generalized biomass equations as a function of age,growing stock and site index for various species groups from two extensive datasets containing a total of 6392 plots.The datasets were from Cannell(1982)covering temperate forest stands from 46 countries and from Usoltsev(2001)covering 37 countries in northern Eurasia. Wirth et al.(2004)compiled a dataset of 688 trees sampled in 102 forest stands by 19 authors to develop biomass equations for Norway spruce in central Europe.In an extensive effort to develop national-scale biomass equations for 100 tree species in United States,Jenkins et al. (2003)assembled 318 equations of total biomass and 389 equations of component biomass from 104 publications. Their generalized biomass equations were implemented in the FORCARB model to develop the U.S.carbon budget (Jenkins et al.2003).In U.K.,Levy et al.(2004)developed landscape-level biomass factors and prediction functions for 13 coniferous tree species from 2000 sampled trees covering a range of ages,soil types and site cultivation methods.
The goal of this study was to use the meta-analysis approach to develop regional stand-level biomass factors forQuercus mongolica(Fisch.)forests in South Korea. This oak species is found in natural deciduous and mixed forests throughout South Korea(Son et al.2007).It plays an important role in increasing biodiversity and wood production,and has cultural signif i cance across the country (Li et al.2010).Hence,estimating carbon stocks inQ.mongolicaforests is relevant to developing the country carbon budget.The three biomass factors of interest are biomass conversion and expansion factor(BCEF),biomass expansion factor(BEF)and root-to-shoot ratio(RSR).The factors are def i ned according to IPCC(2006b).BCEF is def i ned as the ratio of above-ground biomass to stand volume(ton/m3),BEF is the ratio of above-ground biomass to stem biomass,and RSR is the ratio of root biomass toabove-ground biomass.The latter two factors are dimensionless.The biomass factors are positive continuous variables,and their distributions are generally skewed towards low values(Levy et al.2004).Therefore,a normal probability density function(PDF)may not be proper and the biomass factors are usually assumed to be log-normally distributed.Specif i cation of an appropriate PDF for a biomass factor is important if one wishes to carry out uncertainty analysis using the Monte Carlo simulation approach recommended by the IPCC(IPCC 2006a).Hence,the two specif i c objectives of this study were(1)exploring PDFs and selecting the one that provided the best f i t for each biomass factor,and(2)quantifying their means and uncertainties.
Materials and methods
Data
A literature search was carried out to collect publications on stand-level biomass estimates ofQ.mongolicaforests. A set of criteria was laid out to select appropriate publications to be included in the meta-analysis:(1)forest type, (2)plot conf i guration,(3)sample tree selection procedure, and(4)measurement method.A total of 12 publications consistent in these selection criteria were included in our meta-analysis(Table 1).The number of study sites per publication ranged from 1 to 16 and totalled 52(Table 1). The study sites were located either in pureQ.mongolicaforests or in mixed forests with high density of the oak species.They were distributed across the country(Fig.1) and covered a range of elevations(260–1300 m)and stand ages(6–70 years).All publications established 20 m×20 m(0.04 ha)plots with the exception of Park and Moon(1994)and Park et al.(1996),who established smaller plots of 10 m×10 m(0.01 ha).
The sample tree selection and measurement procedures were generally identical among the 12 publications.All trees with diameter at breast height(DBH)≥6 cm in a plot were measured for DBH and height,and 3–6 trees were destructively sampled for biomass based on the observed DBH distribution.This ensured the sampled trees represented stand structure in the plot.Stem,branch and foliage biomasses were measured,and above-ground biomass was the sum of the three biomass components.Root biomass was measured for a subset of the sampled trees.Biomass equations relating stem,above-ground and root biomasses to DBH and height were developed and were used to predict biomasses for the remaining trees in the plot.Standlevel stem,above-ground and root biomass were estimated as the sum of all tree biomasses respectively and were scaled to biomass densities(ton/ha).Not every publication reported stand volume(m3/ha),which was needed to estimate one of the biomass factors.For those without the information,stand volume was estimated by multiplying stand density and mean tree volume,where the latter was estimated from mean tree dbh and height reported in the publications using a published volume table(Korea Forest Service 2009).The stand-level above-ground and stem biomass for each study site of each publication are presented in Table S1(Supplementary Material).The three stand-level biomass factors—BCEF,BEF and RSR—were then estimated from the stand biomasses and volume.A total of 12,11 and 9 publications were available for estimating BCEF,BEF and RSR,respectively because not all 12 publications reported stem and root biomasses.
Statistical models
The statistical model for the meta-analysis of BCEF,BEF and RSR was formulated as a multilevel model under the Bayesian hierarchical model(BHM)framework.A multilevel model accommodates nesting structure in data.In this study,publication was chosen as the nesting factor,and respective study sites were nested under a publication (Table 1).This accounted for the variation between study sites within a publication.The multilevel model under BHM framework also incorporated between-publication variation.Difference in data collection methods was minimized by application of the criteria for selection of publications.However,other subtle factors specif i c to each publication might inf l uence the biomass factor estimates, e.g.,equipment used,f i eld crew experience and f i eld work conditions.In short,the multilevel BHM model helps us to derive an average estimate of a biomass factor on a regional level while accounting for variation between publications and between study sites within a publication (Gelman and Hill 2007).The BHM framework has several advantages.For example,complex random effects can be easily constructed for a variety of PDFs,and BHM can accommodate small sample sizes of some publications and use all available data to gather inferences for them (Congdon 2006;Gelman and Hill 2007).
BCEF,BEF and RSR are positive continuous variables, and their frequency distributions indicate positive skew (Fig.2).Fitting a Normal PDF to their frequency distributions was unsatisfactory because the f i tted PDF failed to capture the asymmetry and portions of the f i tted PDF took on negative values(Fig.2).Thus,a PDF that meets the distributional characteristics of the three biomass factors is more appropriate.In this study,we chose the Gamma,Lognormal and Weibull PDFs because of their ability to accommodate skewed and strictly positive variables.These PDFs were then specif i ed as multilevel BHM models to derive regional level BCEF,BEF and RSR.

Table 1 List of publications used for meta-analysis of BCEF,BEF and RSR and average characteristics of the study sites in the publications
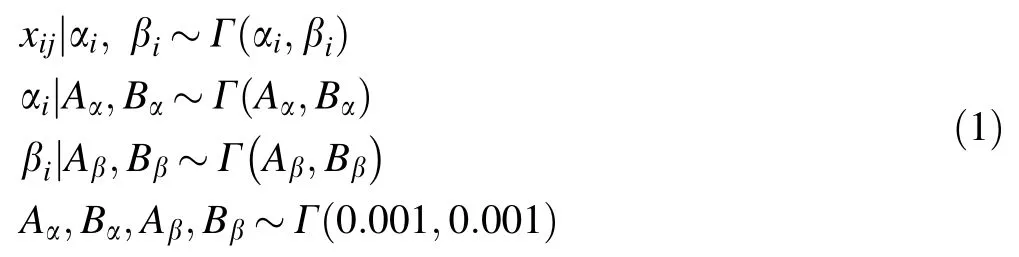
where,Γ()was a Gamma function.Equation(1)implied that a Gamma PDF was fi tted to each publication with biomass factor valuesfrom that publication;hence,the nesting structure.Under the BHM framework,were assumed to follow independent Gamma distributions. A non-informative Gamma prior distribution was independently assigned to each of the hyperparametersIn short,the posterior distribution of the parameter setwas,

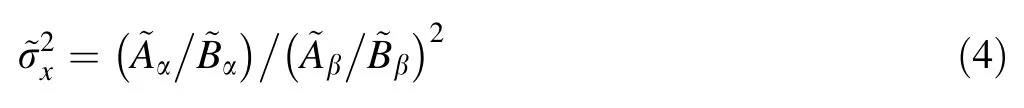
where,xfor allβ)was a likelihood function,andP(.|.)andP(.)were prior distributions for parameters and hyperparameters,respectively.The posterior mean biomass factor across all publications was estimated as(Ntzoufras 2009),

with the posterior variance of the biomass factor as,
Secondly for Log-normal PDF,letbe the mean parameter on a logarithmic-scale andbe the precision parameter for theith publication.Thus,the PDF ofwas specif i ed as(Ntzoufras 2009).The multilevel BHM based on the Lognormal PDF was specif i ed following Ntzoufras(2009)as,

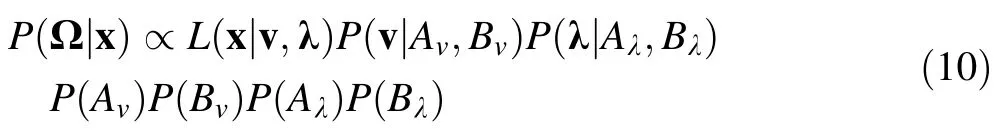
where,LN()was Log-normal PDF,N()was Normal PDF,U()was Uniform PDF.Equation(5)implied that only the mean parameter μ was subjected to the nesting structure. We attempted to add the nesting structure on the precision parameter τ,but the model was unstable and failed to converge satisfactorily for the three biomass factors. Hence,we assumed that τ was not inf l uenced by betweenpublication variation.The parameter μiwas assumed to be normally distributed.Non-informative prior distributions were independently assigned to θ,τ and φ with θ assuming a Normal distribution,the inverse and square-root of precision parameter τ and hyperparameter φ were assumed to have Uniform distributions following the convention from Gelman and Hill(2007).In short,the posterior distribution of the parameter set Ω=(μ,τ,θ,φ)was,
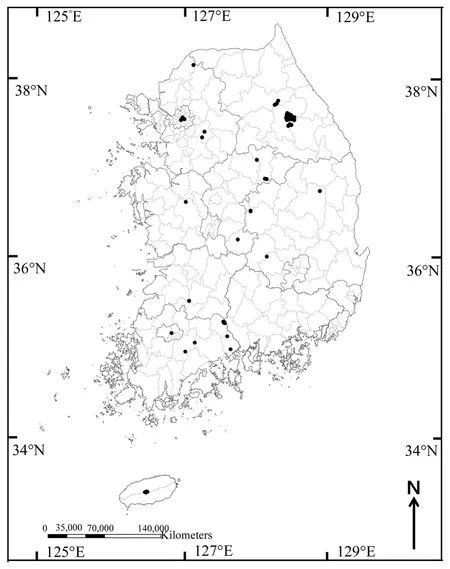
Fig.1 Locations of 52 study sites(black dots)from the 12 publications used for meta-analysis in the Republic of Korea


with the posterior variance of the biomass factor as,


where,WB()was Weibull PDF.Equation(9)assumed that both parameters of the Weibull PDF were Gamma distributed.A non-informative Gamma prior distribution was independently assigned to each of the hyperparametersThe resulting posterior distribution of the parameter setwas,

with the posterior variance of the biomass factor as,


Fig.2 Frequency distribution of published a BCEF,b BEF, and c RSR.The f i tted PDFs are Normal(gray solid line), Gamma(black solid line),Lognormal(black dotted line)and Weibull(black dashed line). The peaks of the f i tted Weibull and Gamma PDFs for BEF and RSR,respectively,are beyond the scale of the vertical axis and are not shown
Model f i tting
Modeling was done using the Monte Carlo Markov Chain (MCMC)simulation in WinBUGS(Lunn et al.2000).A common algorithm to run MCMC simulation is the Gibbs sampler introduced by Metropolis et al.(Metropolis et al. 1953).The general process of the algorithm is:(1)start with initial values for all parameters,(2)choose the number of iterations,(3)at each iteration,update one parameter at a time by taking a random simulation draw given the data and the current estimates of all other parameters,and (4)once all iterations are completed,evaluate the chain for convergence(Gelman and Hill 2007).For this study,two disparate sets of initial values were used.The MCMC simulation was run with 300,000 iterations and a lag of 5 to reduce possible autocorrelation between the MCMC runs. At the end of the run,values from the initial 10,000 iterations were dropped,and MCMC samples for some parameters were thinned to further reduce autocorrelation.
The model convergence was judged from:(1)trace and history plots of the MCMC samples,(2)the Brooks–Gelman–Rubin(BGR)statistic(Brooks and Gelman 1998), and(3)the Monte Carlo(MC)error of an estimated parameter.Convergence of a f i tted model was conf i rmed if: (1)the BGR statistic was<1.05,(2)the MC error was<2%of the posterior standard deviation of the estimated parameter,and(3)the trace and history plots showed MCMC samples to be within a parallel zone without strong seasonality(Ntzoufras 2009).
A total of 9 analyses were carried out using the combination of three PDFs(Gamma,Log-normal and Weibull) and three biomass factors(BCEF,BEF and RSR). Modeling of BEF raised a location issue because the lower bound of BEF was 1 while that of the three PDFs was 0.To resolve this issue and avoid specifying complex truncated PDFs,the BEF values were subtracted by 1 prior to analysis.Shifting the lower bound of BEF to 0 did not affect the shape of its frequency distribution.The model f i tting showed that model convergence was achieved for 8 of the 9 combinations,except the Weibull PDF and RSR combination.Hence,RSR was only f i tted with the Gamma and Log-normal PDFs.The WinBUGS codes along with the data used for analyses are made available in the Supplementary Material(S1–S3;Supplementary Material).
The median,2.5 and 97.5%sample quantiles of the posterior mean and variance of a biomass factor were reported for the eight combinations.Comparison of f i t between PDFs for a biomass factor was based on:(1) deviance information criterion(DIC,Spiegelhalter et al. 2002),(2)Kolmogorov–Smirnov test,and(3)Q–Q plot. The DIC was analogous to Akaike information criterion (AIC)with smaller values indicating better f i t.The Kolmogorov–Smirnov test compared the f i t between the distributions of the observed biomass factor values and that of a f i tted PDF from posterior median parameters associated with the PDF.The null hypothesis of the test was no difference between the two,and signif i cance level was set at 0.05.Finally,the Q–Q plot was constructed by plotting the quantiles of the observed biomass factor values on the horizontal axis against the quantiles from a f i tted PDF on the vertical axis.For a good f i t,the plotted quantiles would fall on line of slope 1:1.
Results
Biomass conversion and expansion factor(BCEF)
The median posterior mean BCEF across all publications estimated by Gamma,Log-normal and Weibull PDFs were 1.003,1.016 and 0.937,respectively(Table 2).Although the values appeared to be different,the 95%credible intervals(range in 2.5 and 97.5%sample quantiles) showed that the difference was insignif i cant(Table 2).The goodness-of-f i t statistics suggested that Gamma PDF had the best f i t followed by Log-normal and Weibull PDFs.The DIC for the f i tted Gamma PDF was lowest(45.17)while that of the Weibull PDF was highest(48.84,Table 2).The Kolmogorov–Smirnov test suggested that all PDFs f i tted the observed BCEF distribution adequately with Gamma PDF having the best f i t(pvalue=0.933,Table 2).This was supported by the f i tted PDF curves overlaying the observed BCEF distribution(Fig.2a).
The diagnostic plots suggested that the f i ts of the Gamma and Log-normal PDFs were comparable while that of the Weibull PDF was poorer(Fig.3a,b,c).The Q–Q plot of the Gamma PDF indicated that the f i tted PDF could not adequately capture the longer right tail of the observed BCEF distribution,i.e.,quantiles were below the 1:1 line for BCEF larger than 1.5(Fig.3a).On the other hand,the fi tted Log-normal PDF performed better at the right tail but slightly underestimated when BCEF was between 1.0 and 1.5(Fig.3b).The Weibull PDF overestimated BCEF when its value was less than 0.8 and greater than 1.5(Fig.3c), which was also supported by the f i tted Weibull curve over the BCEF frequency distribution(Fig.2a).
Posterior estimate of BCEF varied greatly from publication to publication for all PDFs(Fig.3a,b,c).The estimate could be twice as large depending on the publication,with values ranging from 0.6 to 1.5.Most estimates were either equal to or larger than the posterior mean estimate across all publications.The width of the 95% credible intervals also depended on the publications. Median,2.5 and 97.5%sample quantiles ofhyperparameters for each of the three f i tted PDFs are presented in Table S2(Supplementary Material).
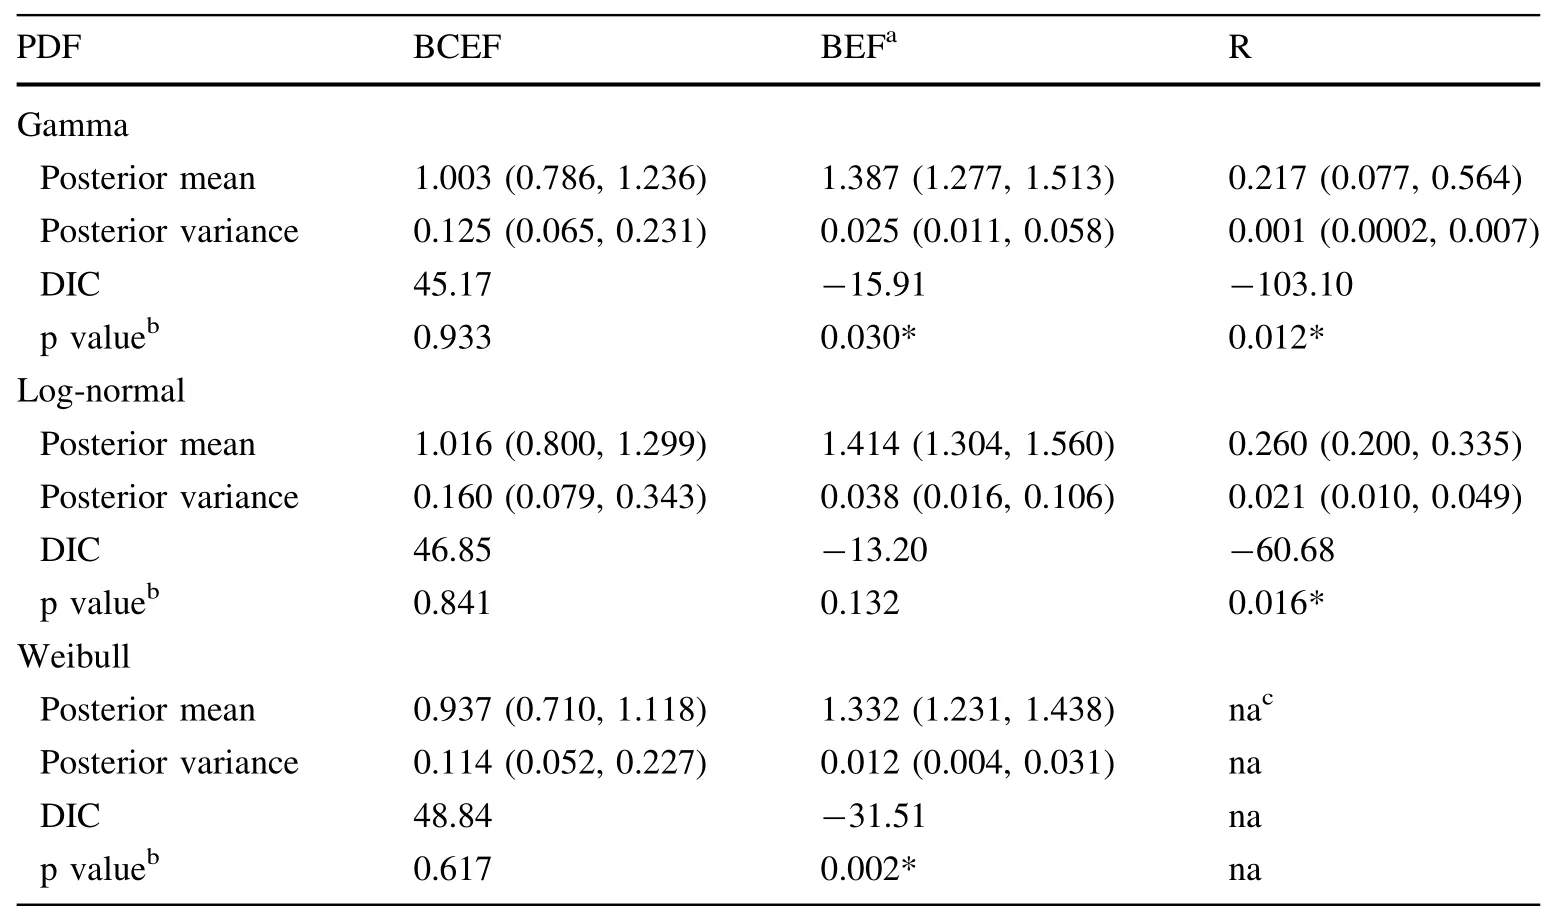
Table 2 Median posterior mean and variance of the three biomass factors across all publications with corresponding 2.5 and 97.5%sample quantiles in parenthesis for each PDF

Fig.3 Q–Q plots for the combinations of the three biomass factors and three PDFs.The three biomass factors are BCEF(a,b,c),BEF(d,e, f)and RSR(g,h),and the three PDFs are Gamma(a,d,g),Log-normal(b,e,h)and Weibull(c,f).The gray line depicts the 1:1 line
Biomass expansion factor(BEF)
The median posterior mean BEF across all publications estimated by Gamma,Log-normal and Weibull PDFs were 1.387,1.414 and 1.332,respectively(Table 2).The 95% credible intervals showed that the differences in the median posterior means were insignif i cant(Table 2).The goodness-of-f i t statistics suggested that the Log-normal PDF had the best f i t to the observed BEF distribution (DIC=-13.20 and p value=0.132,Table 2)while the fi t of the Weibull PDF was considerably poorer(DIC=-31.51 and p value=0.002,Table 2).The Gamma PDF had an intermediate f i t but the Kolmogorov–Smirnov test showed signif i cant difference between the fi tted PDF and the observed BEF distribution(p value=0.030,Table 2).
The diagnostic plots showed a consistent result that the three PDFs f i tted poorly to the right tail of the observed BEF distribution(Fig.3d,e,f).For the Gamma and Lognormal PDFs,the Q–Q plots indicated overestimation for BEF greater than 1.5 with the quantiles from the f i tted PDF lower than expected(Fig.3d,e).Lastly,the Q–Q plot indicated a poor f i t of the Weibull PDF such that the quantiles were smaller than expected for most BEF values (Fig.3f).Furthermore,the peak of the f i tted curve over the BE frequency distribution was beyond the scale(Fig.2b).
Posterior estimates of BEF showed little variation among publications for all PDFs except for two publications(Fig.4e,f,g).Furthermore,most estimates approached the posterior mean estimate across all publications. The width of 95%credible intervals was generally quite similar among the posterior estimates of BEF by publication.Median,2.5 and 97.5%sample quantiles of hyperparameters for each of three f i tted PDFs are presented in Table S3(Supplementary Material).
Root-to-shoot ratio(RSR)
The median posterior means for RSR across all publications were 0.217 and 0.260 for Gamma and Log-normal PDFs,respectively(Table 2).The 95%credible interval of the Gamma PDF was extremely wide,even covering the 95%credible interval of the Log-normal PDF(Table 2). This suggested that the estimate of the Gamma PDF was highly uncertain.
The goodness-of-f i t statistics suggested that neither PDF fi t the observed RSR distribution well,but the Log-normal PDF had a better f i t(Table 2).DIC from the Gamma PDF was almost twice that of the Log-normal PDF(-103.10 and-60.68,respectively,Table 2).The Kolmogorov–Smirnov test showed the f i ts of both PDFs were similar(p values=0.012 and 0.016,respectively,Table 2).
The results from Q–Q plots were in agreement with the test statistics(Fig.3g,h).Neither PDF generally yielded a good f i t with observed RSR values greater than 0.2,but the lack of f i t differed slightly between them.The Gamma PDF underestimated the quantiles of RSR values greater than 0.2(Fig.3g).In contrast,the Log-normal PDF overestimated the quantiles for values between 0.2 and 0.5 but behaved similarly to the Gamma PDF for values greater 0.5 (Fig.3h).
Posterior estimates of RSR by publications differed between the Gamma and Log-normal PDFs(Fig.4g,h). For the Gamma PDF,the median posterior estimates for three publications were signif i cantly or nearly signif i cantly larger than those of the other publications(Fig.4g).Furthermore,the 95%credible interval was highly variable among publications.On the contrary,the median posterior estimates and 95%credible intervals were similar among the publications for the Log-normal PDF(Fig.4h).Median,2.5 and 97.5%sample quantiles of hyperparameters for each of two f i tted PDFs are presented in Table S4 (Supplementary Material).
Discussion
The choice of the most suitable PDF for a biomass factor depends on quantitative and qualitative evaluations.For BCEF,the f i t of the Gamma and Log-normal PDFs was comparable,but we favored the Log-normal PDF because it had a better f i t to the right tail of the observed BCEF distribution.The likelihood of the observed large BCEF values(i.e.,greater than 1.5)being outliers was lowered due to the predef i ned set of criteria for selection of publications.These values likely represented specif i cQ.mongolicaforest stands as part of a larger population in the region,e.g.,a young and dense forest stand with high amount of non-commercial tree components relative to stem volume.Thus,a PDF that could capture these values would be preferable.However,it should be noted that the Log-normal PDF performed less than ideally for BCEF values between 1.0 and 1.5,which was the price for capturing the long right tail of the observed distribution.This perhaps caused the goodness-of-f i t statistics to be lower for the Log-normal PDF than for the Gamma PDF.
The Log-normal PDF was also recommended for BEF. The goodness-of-f i t statistics and the qualitative Q–Q plots supported the choice of the Log-normal PDF.Nonetheless, the lack of f i t was apparent for BEF values greater than 1.5 due to higher frequency of these values than expected under the Log-normal PDF.The lack of f i t,which was consistent among the three PDFs,suggests that the observed BEF distribution may be a mixture of multiple PDFs.If so,two sub-populations of BEF might be present with one sub-population peaking around BEF of 1.2 and another sub-population peaking at 1.8.The two sub-populations might represent differentQ.mongolicastand structures on the landscape with the former group having smaller non-commercial tree component biomass than the latter group relative to stem biomass.A f i nite mixture model might be more appropriate for modeling a distribution with sub-populations.A f i nite mixture model mixes a number of PDFs to generate a model that is f l exible in accommodating a variety of random phenomena (McLachlan and Peel 2000).For BEF,it could be a mixture of two Normal PDFs to represent the two sub-populationsofQ.mongolicaforests.Specif i cation of a f i nite mixture model is considerably more complex,and to the best of our knowledge,it has not been attempted for modeling biomass factors.
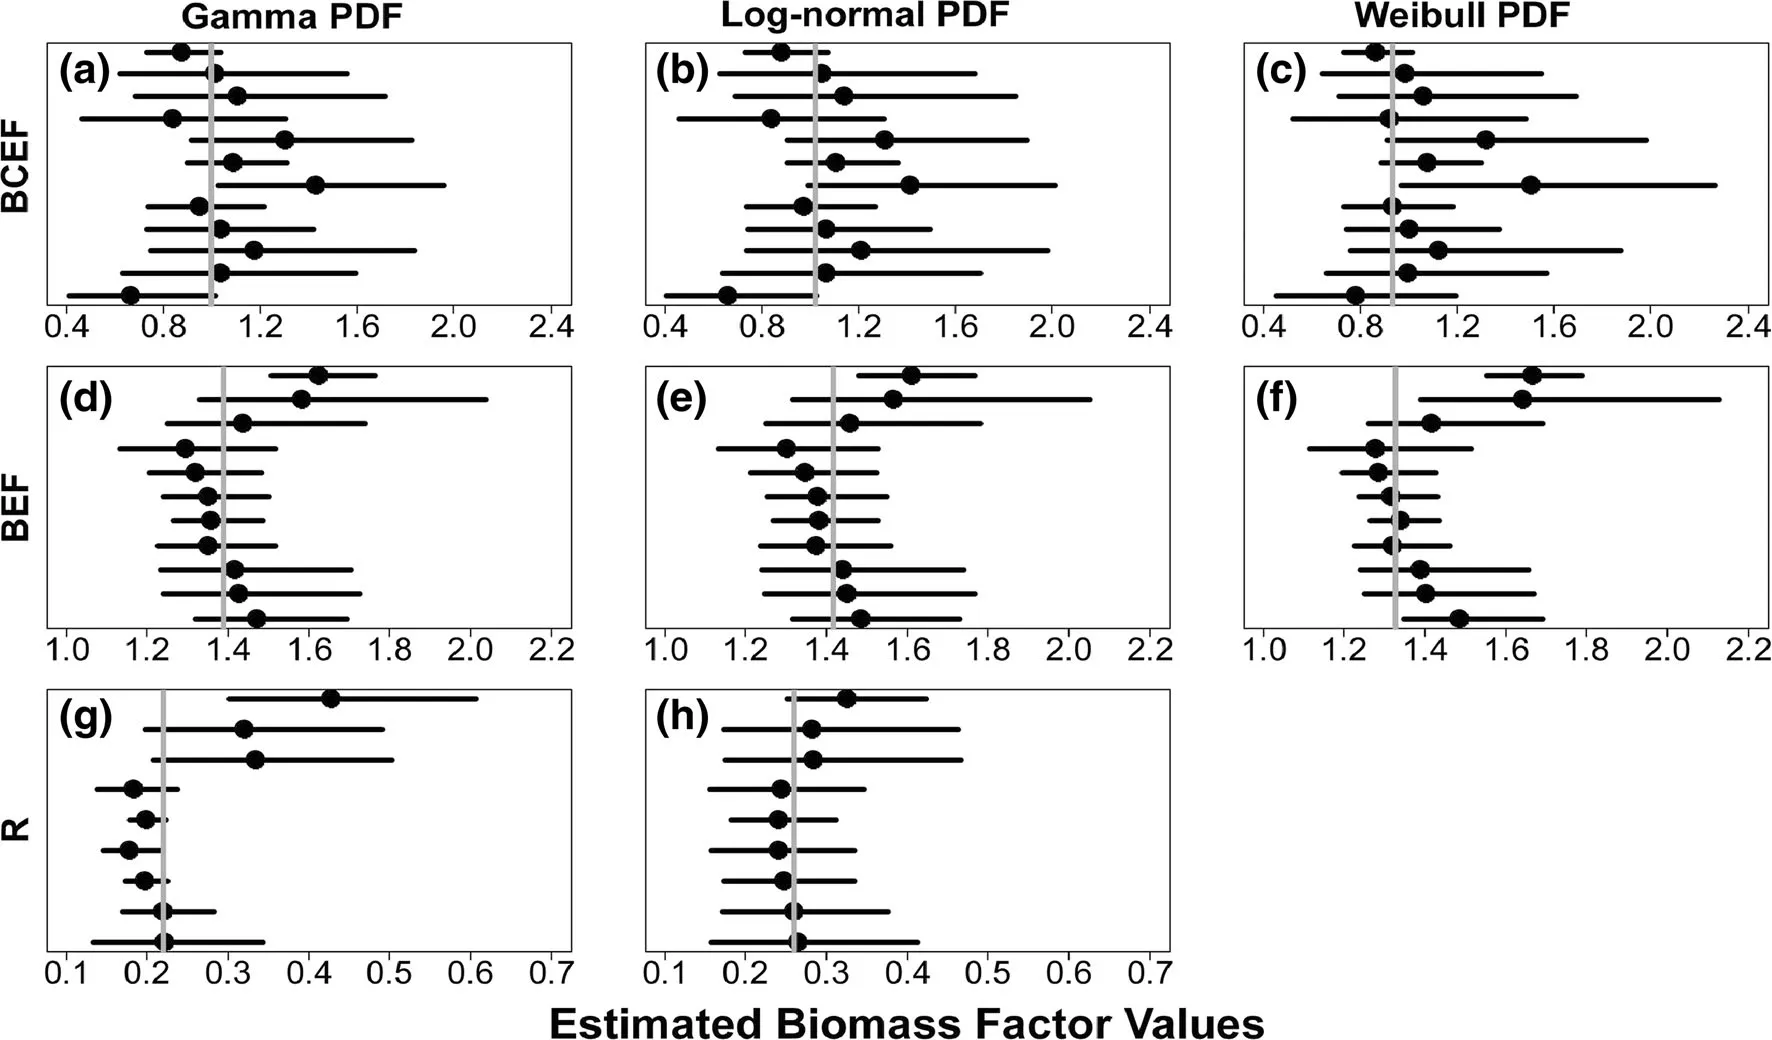
Fig.4 Posterior estimates of the three biomass factors for each publication under the three PDFs.The biomass factors are BCEF(a, b,c),BEF(d,e,f)and RSR(g,h),and the three PDFs are Gamma(a, d,g),Log-normal(b,e,h)and Weibull(c,f).A black dot corresponds to a publication depicting median posterior estimate of a biomass factor.The horizontal line depicting the 95%credible interval(range in 2.5 and 97.5%sample quantiles)
For RSR,we recommend the Log-normal PDF because it performed better in comparison to the Gamma PDF despite the poor f i t indicated by the goodness-of-f i t statistics and diagnostic plots.The lack of f i t was due to the heavy-tailed property of the observed RSR distribution, i.e.,extreme positive skew with large RSR values. Uncertainty associated with estimating root biomass is high partly due to the diff i culty of excavating and accurately measuring root systems.Undoubtedly,this uncertainty contributes to the large variation in the observed RSR distribution.RSR greater than 1.0 implied that root biomass is larger than above-ground biomass;thus,it could be that these values are outliers.However with little research onQ.mongolicaroot systems,this claim is inconclusive. Heavy-tailed PDF specif i cations such as the Pareto PDF are alternative models for the observed RSR distribution(Falk et al.2010),but their application in modeling biomass factors is limited.
This study accounted for variation between and within publications by specifying publication as a nesting factor in a multilevel model.This strategy effectively accounted for causes of uncertainty specif i c to a publication such as conditions at study sites and methods of f i eld measurement, and its effect is similar to blocking in experimental design. As a result,the precision of estimates of a biomass factor by publications and across all publications would be higher.The posterior mean estimates of biomass factors across all publications from the meta-analysis have a wider scope of inference and could be applied for estimating carbon f l ux ofQ.mongolicaforests on a regional level. Furthermore,the recommended PDFs and associated posterior parameter estimates of the biomass factors could be used in the Monte Carlo simulation approach to uncertainty analysis as recommended by IPCC(2006a).
Priors are important components in Bayesian analysis. They are updated with newly collected information to derive posterior inferences that ref l ect both current and past knowledge.To take advantage of this feature,informative priors are often desirable.In this study,non-informative priors were applied as the analyses was unprecedented forQ.mongolicaforests in South Korea.One could attempt to derive potential informative priors under certain assumptions.For example,informative priors can be derived from otherQuercusspecies under the assumption that tree species with the same genus share similar life histories,tree form,allometry,and survival strategies.Furthermore,any future study attempts to ref i ne estimation of regional biomass factors forQ.mongolicaforests using the Bayesian approach could utilize the results from this study to construct informative prior distributions.In a similar manner,Li et al.(2012)set the estimated posterior distributions as new priors to predict local parameters for a new dataset when modeling the tree height-age relationship for balsam fi r in eastern Maine,USA.
Each PDF captures different aspects of the distribution of a biomass factor.For example,the model f i t of the Gamma and Log-normal PDFs was comparable for BCEF, but the Log-normal PDF better captured the right tail of the distribution.Rather than having to choose the best f i t model based on a set of criteria,one could use the Bayesian model average(BMA)method that offers a way to combine different distinct models into a single model(Zhang et al.2014).Zhang et al.(2014)combined stand-level,treelevel and distribution models via BMA to predict stand basal area for even-aged Chinese f i r plantations in southern China.Picard et al.(2012)combined multiple allometric equations into a single predictive model through BMA to predict tree above-ground biomass in tropical moist forests. The potential application of BMA to develop regional biomass factors is promising,and it requires further study.
Kwon and Lee(2006a)showed thatbiomass production ofQ.mongolicaforests depended on elevation butnoton aspect. Therefore,biomass factors could be related to environmental factors and stand structures through regression models.This approach would furtherexpand thescopeofinferencebecause biomassfactorscould then bepredicted from any foreststands with measured predictors.A generalized linear mixed model (GLMM)would be suitable for this approach.GLMM requires specif i cation of an appropriate PDF and random effectsfora biomassfactor.The recommended choice ofPDF from thisstudy and using publication asa nesting factorcould be a starting pointforbuilding the GLMM.In short,thismetaanalysis study has expanded the applicability of the f i ndings reported in earlierstudies,and the developed statisticalmodel for the meta-analysis could be applied similarly to other tree species in the country.
AcknowledgementsWe would like to express our sincere thanks to Jeong-seon Kim for assistance in translating the Korean literature.We also thank Korea Forest Research Institute for the funding to conduct this research,and the many researchers who have conducted the studies used for the meta-analysis.Lastly,we would like to express sincere thanks to the anonymous reviewers for comments and suggestions that have greatly improve the publication.
Borenstein M,Hedges LV,Higgins JPT,Rothstein HR(2009) Introduction to meta-analysis.Wiley,Chichester
Brooks S,Gelman A(1998)General methods for monitoring convergence of iterative simulations.J Comput Graph Stat 7:434–456
Brown S(2002)Measuring carbon in forests:current status and future challenges.Environ Pollut 116:363–372
Brown S,Lugo AE(1982)The storage and production of organic matter in tropical forests and their role in global carbon cycle. Biotropica 14:161–187
Cannell MGR(1982)World forest biomass and primary production data.Academic Press,London
Congdon P(2006)Bayesian statistical modelling.Wiley,Chichester
Falk M,Hu¨sler J,Reiss R-D(2010)Laws of small numbers:extremes and rare events.Springer,Basel
Fang J-Y,Wang ZM(2001)Forest biomass estimation at regional and global levels,with special reference to China’s forest biomass. Ecol Res 16:587–592
Gelman A,Hill J(2007)Data analysis using regression and multilevel/hierarchical models.Cambridge University Press, Cambridge
Hartung J,Knapp G,Sinha BK(2008)Statistical meta-analysis with applications.Wiley,Hoboken
Hedges LV(1994)Fixed effects models.In:Cooper H,Hedges LV (eds)The handbook of research synthesis.Russell Sage Foundation,New York,pp 285–301
IPCC(2006a)IPCC guidelines for national greenhouse gas inventories:volume 1 general guidance and reporting.In:Eggleston S, Buendi L,Miwa K,Ngara T,Tanab K(eds),Intergovernmental Panel on Climate Change(IPCC)IPCC/IGES Hayama
IPCC(2006b)IPCC guidelines for national greenhouse gas inventories:volume 4 agriculture,forestry and other land use.In: Eggleston S,Buendia L,Miwa K,Ngara T,Tanabe K(eds), Intergovernmental Panel on Climate Change(IPCC)IPCC/IGES Hayama
Jalkanen A,Ma¨kipa¨a¨R,Sta˚hl G,Lehtonen A,Petersson H(2005) Estimation of the biomass stock of trees in Sweden:comparison of biomass equations and age-dependent biomass expansion factors.Ann For Sci 65:845–851
Jenkins JC,Chojnacky DC,Heath LS,Birdsey RA(2003)Nationalscale biomass estimators for United States tree species.For Sci 49:12–35
KFRI(2010)Study on the basis of forest carbon accounting in Korea. Korea Forest Service,Seoul
Korea Forest Service(2009)Stem volume table.Korea Forest Service,Seoul
Kwon K-C,Lee DK(2006a)Biomass and annual net production ofQuercus mongolicastands in Mt.Joongwang with respect to altitude and aspect.J Korean For Soc 95:398–404
Kwon K-C,Lee DK(2006b)Biomass and energy content ofQuercus mongolicastands in Gwangyang and Jeju areas.J Korean Wood Sci Soc 34:54–65
Kwon K-C,Lee DK(2006c)Above-and below-ground biomass and energy content ofQuercus mongolica.J Korean For Energ Soc 25:31–38
Lee DK,Kwon K-C(2006)Biomass and annual net production ofQuercus mongolicastands in Pyungchang and Jecheon areas. J Korean For Soc 95:309–315
Lee KJ,Park IH(1987)Primary production and nutrients distribution in 22-year-oldPinus koraiensisandQuercus mongolicastands in Kwangju district.J Korean For Energy Soc 7:11–21
Levy PE,Hale SE,Nicoll BC(2004)Biomass expansion factors and root:shoot ratios for coniferous tree species in Great Britain. Forestry 77:421–430
Li X,Yi MJ,Son Y,Jin G,Lee KH,Son YM,Kim RH(2010) Allometry,biomass and productivity ofQuercusforests in Korea:a literature-based review.J Korean For Soc 99:726–735
Li R,Stewart B,Weiskittel A(2012)A Bayesian approach for modelling non-linear longitudinal/hierarchical data with random effects in forestry.Forestry 85:17–25
Lunn DJ,Thomas A,Best N,Spiegelhalter D(2000)WinBUGS—a Bayesian modelling framework:concepts,structure,and extensibility.Stat Comput 10:325–337
McLachlan G,Peel D(2000)Finite mixture models.Wiley-Interscience,New York
Metropolis N,Rosenbluth AW,Rosenbluth MN,Teller AH,Teller E (1953)Equation of state calculations by fast computing machines.J Chem Phys 21:1087–1092
Na´var J(2010)Measurement and assessment methods of forest aboveground biomass:a literature review and the challenges ahead.In:Momba M,Bux F(eds)biomass.Croatia,Sciyo, pp 27–64
Ntzoufras I(2009)Bayesian modeling using WinBUGS.Wiley, Hoboken
Park G-S(2003)Biomass and net primary production ofQuercus mongolicastands in Kwangyang,Pyungchang,and Youngdong areas.J Korean For Soc 92:567–574
Park IH,Moon GS(1994)Biomass,net production and biomass estimation equations in some naturalQuercusforests.J Korean For Soc 83:246–253
Park IH,Lee DK,Lee KJ,Moon GS(1996)Growth,biomass and net production ofQuercusspecies(I).J Korean For Soc 85:76–83
Park I-H,Kim D-Y,Son Y-H,Yi M-J,Jin H-O,Choi Y-H(2005a) Biomass and net production of a naturalQuercus mongolicaforest in Namsan,Seoul.Korean J Environ Ecol 19:299–304
Park IH,Son Y,Kim DY,Jin HO,Yi MJ,Kim RH,Hwang JO (2005b)Biomass and production of a naturally regenerated oak forest in southern Korea.Ecol Res 20:227–231
Picard N,Henry M,Mortier F,Trotta C,Saint-Andre´L(2012)Using Bayesian model averaging to predict tree aboveground biomass in tropical moist forests.For Sci 58:15–23
Schroeder P,Brown S,Mo J,Birdsey R,Cieszewski C(1997) Biomass estimation for temperate broadleaf forests of the United States using inventory data.For Sci 43:424–434
Somogyi A,Cienciala E,Ma¨kipa¨a¨R,Muukkonen P,Lehtonen A, Weiss P(2007)Indirect methods of large-scale forest biomass estimation.Eur J For Res 126:197–207
Son Y,Kim DY,Park IH,Yi MJ,Jin HO(2007)Production and nutrient cycling of oak forests in Korea:a case study ofQuercus mongolicaandQ.variabilisstands.Kangwon National University Press,Chuncheon
Song CY,Lee SW(1996)Biomass and net primary productivity in natural forests ofQuercus mongolicaandQuercus variabilis. J Korean For Soc 85:443–452
Spiegelhalter DJ,Best NG,Carlin BP,van der Linde A(2002) Bayesian measures of model complexity and f i t.J R Stat Soc Ser B 64:583–640
Teobaldelli M,Somogyi Z,Migliavacca M,Usoltsev VA(2009) Generalized functions of biomass expansion factors for conifers and broadleaved by stand age,growing stock and site index.For Ecol Manag 257:1004–1013
Usoltsev VA(2001)Forest biomass of northern Eurasia:database and geography.Russian Academy of Sciences,Ural Branch Yekarinenburg
Van Camp N,Walle IV,Mertens J et al(2004)Inventory-based carbon stock of Flemish forests:a comparison of European biomass expansion factors.Ann For Sci 61:677–682
Wirth C,Schumacher J,Schulze E-D(2004)Generic biomass functions for Norway spruce in Central Europe—a meta-analysis approach toward prediction and uncertainty estimation.Tree Physiol 24:121–139
Zhang X,Duan A,Dong L,Cao QV,Zhang J(2014)The application of Bayesian model averaging in compatibility of stand basal area for even-aged plantations in southern china.For Sci 60:645–651
22 November 2013/Accepted:30 September 2014/Published online:21 June 2015
Project fund:This study was supported by Korea Forest Research Institute.
The online version is available at http://www.springerlink.com
Corresponding editor:Chai Ruihai
Electronic supplementary materialThe online version of this article(
10.1007/s11676-015-0089-x)contains supplementary material,which is available to authorized users.
✉Tzeng Yih Lam
tylam@ntu.edu.tw
1Division of Forest Management,Department of Forest and Climate Change,Korea Forest Research Institute,57 Hoegiro,Dongdaemun-gu,Seoul 130-712,South Korea
2Present Address:School of Forestry and Resource Conservation,National Taiwan University,No.1,Section 4, Roosevelt Road,Taipei 10617, Taiwan,People’s Republic of China
杂志排行

Journal of Forestry Research的其它文章
- Drone remote sensing for forestry research and practices
- Life cycle environmental impact assessment of biochar-based bioenergy production and utilization in Northwestern Ontario, Canada
- Growth rates of Eucalyptus and other Australian native tree species derived from seven decades of growth monitoring
- Effect of f i rst thinning and pruning on the individual growth of Pinus patula tree species
- The inf l uence of selective cutting of mixed Korean pine(Pinus koraiensis Sieb.et Zucc.)and broad-leaf forest on rare species distribution patterns and spatial correlation in Northeast China
- Modeling forest f i res in Mazandaran Province,Iran