Effects of transgenic Bt cotton on rhizospheric soil microbial communities
2015-06-09刘根林
刘根林
(江苏省林业科学研究院,江苏 南京 211153)
Effects of transgenic Bt cotton on rhizospheric soil microbial communities
After cultivation of 2 transgenicBtcotton lines(99BC-4,99BC-8)and their non-Btrecipient Simian3(SM3)in rhizoboxes,the rhizospheric soils during blooming period were sampled.Biolog characterization revealed that during the whole laboratory incubation for 168 h,AWCDsof the rhizospheric soil microbial communities exhibited differential sigmoidals of C substrate utilization with incubation time,and the soils showed lowerAWCDsin GP2 plate than in GN2 plate and EcoPlate,meaning that the G+bacteria in the soils possessed a weaker C source metabolic ability.Functional diversity analysis indicated that the rhizospheric soils of 99BC-8 and SM3 had a larger richness and diversity of,and centered more dominant species in the microbial communities,reflecting a high metabolic potential and functional diversity.Principal Component Analysis(PCA)identified that the first 2 PCs accounted respectively for 35.59%,19.37%in GN2 plate,and 30.57%,18.89%in GP2 plate of total variation.It can be deduced that Bt endotoxin likely stimulated the growth of some specific microbes by using the preferential C sources,which likely dominated the soil microbial responses,though inconsistent in 2 transgenicBtlines.
TransgenicBtcotton;Biolog;Soil;Microbial community;PCA
1 Introduction
TransgenicBtcottons,into which theCrygene encoding insecticidal Cry1Ac Bt toxic protein was introduced,have been grown worldwide for their resistance to cotton bollworm(e.g.Helicoverpa armig-era)[1-2].However,along with the increasing potential for widespread commercial use and the potential benefits of transgenic crops,more and more concerns have been triggered about their potentially ecological and environmental risks[3-7].Although risk assessments have been extensively conducted,whether or notthe risk imposed on soil environment has occurred still remains controversial[3-6].Here the effects of transgenicBtcotton on rhizospheric soil microbial communities are reported after cultivation in China.
2 Materials and Methods
2.1 Rhizobox design and soil sampling and processing
Trial site,cotton variety,rhizobox used for cultivation and soil sampling&processing were referred as[8].Each sample was immediately put in a sterile plastic bag and transported to the laboratory in a cooled box,then sieved(2 mm)and homogenized in a rotary cylinder,and finally,stored at 4℃before used for Biolog characterization.
2.2 Biolog characterization
Biolog method was used by direct incubation of soil suspensions in GP2,GN2 MicroPlates and Eco-Plate(Biolog Inc.,Hayward,Calif.),containing respectively 95,95 and 31 different C sources in individual wells to determine changes in the utilization rate of individual substrates.Each fresh sample(10 g)was suspended in 100 mL saline solution(0.9%NaCl),reciprocally shaken at room temperature for 30 min at 120 rpm.After centrifugation at 1 000 g for 10 min,the pellet was suspended in 100 mL above-mentioned saline solution.Each suspension(5 mL)was used to make a 10-fold dilution series up to 10-3,from which 150 μL of supernatant was inoculated into each well of GP2,GN2 plates and EcoPlate.One well without C source in each plate was used as control well.The plates were incubated in the dark at 25℃in a sealed polyethylene bag and read at 590 nm at start and then every 12 h for 7 d using ELISA plate reader.
2.3 Statistical analysis
All the experiments were performed at least 3 repetitive independent treatments.An analysis of variance was carried out by using the SPSS13 software. The values are expressed as means±SD.The significant differences among the means were calculated by using LSD-test.Statistical significance threshold was set to less than 0.05 forpvalue.
The Average Well Color Development(AWCD) method proposed by Garland and Mills[9]was used for analysis of the Biolog data.AWCDat a particular time was calculated using the following equation.

whereCiis OD for thei-th well with C source andRis that for the control well without C source.nmeans the number of C sources contained in each plate,i.e.,95,95 and 31 respectively.The number of positive wells in each plate is described asS(richness).The functional diversity indices of microbial communities were referred from[10-12].The indices concerned were calculated from the data at 72 h of incubation when even the slowly-growing microbes could utilize the C sources in the wells and since for the more slowly utilized C sources,longer incubation times would be required to examine the full extent of C source us.Shannon diversity index was calculated using the following equation.

And Shannon evenness index was calculated as
SE=H’/lnSwhile McIntosh evenness index calculated as

Principal Components Analysis(PCA)of normalized data to elucidate the pattern of variation of soil microbial community profile was also performed using the SPSS 13 software.The plot of the PC scores for samples was used to display differences in metabolic diversity patterns.Relationships among samples were obtained by plotting scores of their first 2 PCs in 2 dimen-sions,that is,samples with similarAWCDdata sets were located close to one another while dissimilar data sets far apart.
3 Results
3.1 AWCD variation of soil microbial communities
AWCDsin GP2,GN2 plates and EcoPlate reflect sole-C-source metabolic competence and the activities of Gram-negative(G-),Gram-positive(G+)bacteria in and overall activity of soil microbial community. As shown in Fig.1,during the whole incubation for 168 h,AWCDsfor 99BC-4,99BC-8 and SM3 had a steady rise in all 3 plates with incubation time,but exhibited differential sigmoidals of C substrate use,and the soils showed lowerAWCDsin GP2 plate than in GN2 plate and EcoPlate,revealing that the G+bacteria in the soils possessed a weaker C source metabolic ability.The twoBtcotton lines performed inconsistently for theAWCDssince in all 3 plates,AWCDsfor 99BC-4 were always significantly lower than those for 99BC-8 and SM3,suggesting that the metabolic activity of either G+or G-bacteria in 99BC-4 rhizospheric soil were significantly decreased compared with those in its non-Btrecipient,and furthermore,significant differences also emerged betweenAWCDsfor 99BC-8 and SM3 in the partial process of incubation,i.e.,at the point of 24thh from start in GN2 plate;from 24thh to 84thh in GP2 plate;and from 36thh to 72ndh in Eco-Plate.By comparing Fig.1-a with Fig.1-b,within the incubation from 48thh to 84thh,no significant differences in GN2 plate betweenAWCDsfor 99BC-8 and SM3 but significantly higherAWCDsfor SM3 than for 99BC-8 in GP2 plate,indicating that there appeared lower ratio of G+to G-bacteria for 99BC-8 than for SM3.It is well in accordance with the observation forBtand non-Btmaize[13].Based on these results,it is speculated that the species and composition of the root exudates(Bt endotoxin included[8])can play some selective role,to a certain degree,for both G+/G-bacteria and other microbes,and their periodic growth as well in the rhizospheric soil microbial community,which is among the most important biological characteristics for the rhizosphere.In addition,a higher Bt endotoxin content for 99BC-8(though the significance of difference not related)[8],maybe leads to more microbes occurring,it seems then not difficult to understand higherAWCDsfor 99BC-8 compared with those for 99BC-4.

Fig.1 AWCD kinetics for 99BC-4,99BC-8 and SM3 on Biolog-GN2(a),-GP2(b)and-Eco(c)Plates.*indicatessignificantdifferences(p<0.05)between AWCDs for 99BC-8/SM3 and 99BC-4.**indicates significant differences between any two of three(p<0.05).
3.2 Functional diversity index variation of soil microbial communities
Functional diversity index between any two of three variations for 99BC-4,99BC-8 and SM3 are presented in Table 1.It is clearly indicated that in GP2,GN2 plates and EcoPlate,S,H’andUfor99BC-4 had always remarkably lower values than those for 99BC-8 and SM3,which inferred that the catabolic diversity for 99BC-4 was reduced compared with that for SM3 whilst for 99BC-8,it was not the same case. 1/DandMEwere able,to a certain degree,to distinguish the difference among the utilization of C sources by different rhizospheric microbial communities.1/Ddiffered in GP2 plate in the same way asH’,and had significant difference between 99BC-8 and 99BC-4 in GN2 plate,but no significant difference in EcoPlate. ForME,no significant difference was found in GP2 plate,significant differences observed the same way as for 1/Din GN2 plate,and significant differences the same way as forUin EcoPlate.In both GP2 and GN2 plates,SEfor 3 microbial communities reflected the opposite differences toH’,but either no significant difference in EcoPlate.In GP2,GN2 plates and Eco-Plate,Gfor 99BC-4 was significantly reduced compared with those for 99BC-8 and SM3,and besides,in GP2 plate,Gfor 99BC-8 also significantly reduced in comparison with that for SM3.
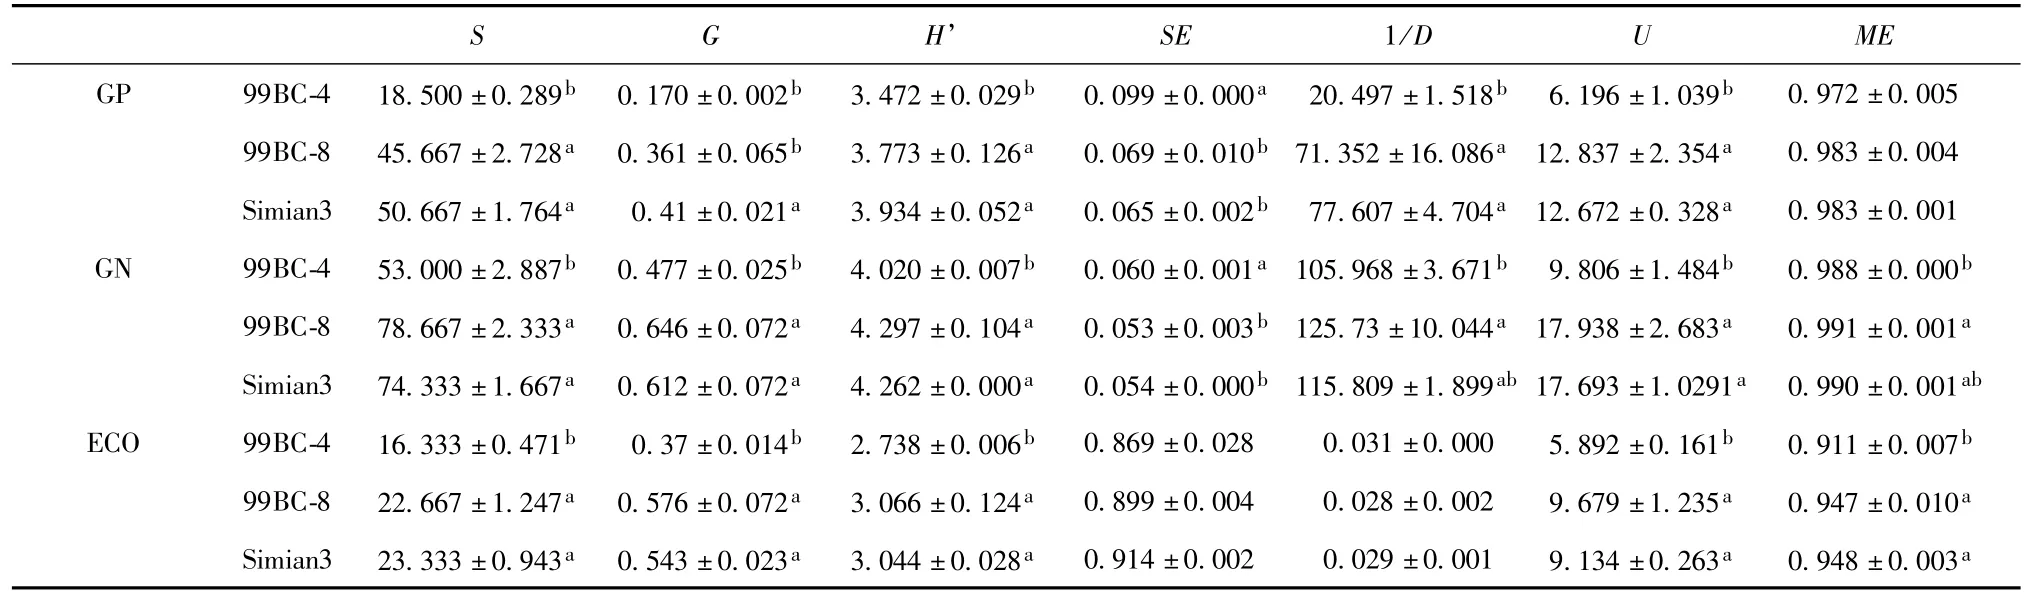
Table 1 Diversity and evenness indices for 99BC-4,99BC-8 and SM3
3.3 Principal components analysis of metabolic function of soil microbial communities
PCA of each data set for 99BC-4,99BC-8 and SM3 resulted in a PC score plot in which soil groups were separately located(Fig.2,3).In each of the following 2 PC score plots(that in EcoPlate not shown),it was observed that on one hand,the soils were significantly divided into 2 groups along the positive direction of PC1 axis.PC1 scores differed significantly between 99BC-8,SM3 soil groups and 99BC-4 soil,and 99BC-4 soil had always a higher score for PC1 and showed a greater response to C sources in GP2,GN2 MicroPlates that correlated positively to PC1,compared with lower PC1 scores for the other soils.On the other hand,the soils were also significantly divided into 2 groups along the positive direction of PC2 axis.99BC-8 soil located at the positive side,was greatly distinguished from 99BC-4,SM3 soil groups at the negative side,and showed a greater response to C sources in both MicroPlates that correlated positively to PC2, compared to lower PC2 scores for the other soils.The first 2PCsaccountedrespectivelyfor35.59%,19.37%in GN2 plate,and 30.57%,18.89%in GP2 plate of total variation.Variation explained by 2 pairs of the first and second PC axes reached 54.96%,49.46%respectively,indicating a better discrimination power of the microbial communities and metabolically functional diversity from different lines.
In other words,the PCA patterns shown in theAWCDdata sets were strongly related to the use of individual C sources in GN2,GP2 plates.In GN2 plate,separation of the soil samples into 2 groups along PC1 was significantly affected by carbohydrates,carboxylic acids and amino acids.Substrates affecting the PC2 were carbohydrates and carboxylic acids.Some C sources,such as β-Methyl-D-glucoside(-0.971),Maltose(-0.915),Sucrose(0.939),D-Gluconic acid(0.969),L-Alanyl-glycine(-0.970),L-Threonine(0.932),Phenyethyl-amine(-0.953),Bromosuccinic acid(0.944)and α-D-Glucose-1-phosphate(-0.937)had greater influence than the other substrates on the axis PC1.Thus,these C sources were primarily responsible for the separation along the PC1 axis.Similarly,Gentloblose(-0.813),Xylitol(0.861),β-Hydroxybutyric acid(0.957),L-Proline(-0.778),L-Alanine(-0.775)and α-Cyclodextrin(0.846)had the greatest influence on the PC2 axis and,thus,were important variables in the separation along the PC2 axis.In addition,in GP2 plate,separation along PC1 was significantly affected by carbohydrates and carboxylic acids.Substrates affecting the PC2 were carbohydrates.The G+bacteria for 99BC-4 were more likely to use such C sources as L-Alanyl-glycine(0.938),Xylitol(0.851),α-Methyl-D-glucoside(0.828),β-Hydroxybutyric acid(0.824)and Mannan(0.763)while the G+bacteria for 99BC-8,SM3 more likely to utilize some C sources such as p-Hydroxy-phenylacetic acid(-0.980),D-Galactose(-0.932),D-Mannose(-0.912)and D-Glucose-6-phosphate(-0.764).Similarly,the G+bacteria for 99BC-8 were more likely to metabolize such C sources as Turanose(0.885)and L-Pyroglutamic acid(0.883)whilst the G+bacteria for 99BC-4,SM3 more to catalyze the following C sources as Palatinose(-0.898)and α-Ketoglutaric acid(-0.784).It could be then,drawn that the C sources like β-Hydroxybutyric acid and Xylitol were more likely utilized by both the G+bacteria for 99BC-4 and the G-bacteria for 99BC-8.

Fig.2 Principal components analysis of carbon utilization for 99BC-4,99BC-8 and SM3 in GN2 plate
4 Discussion

Fig.3 Principal components analysis of carbon utilization for 99BC-4,99BC-8 and SM3 in GP2 plate
Btcottons can produce crystal toxic protein for protecting themselves against the insectsHelicoverpa ar-migera,even suppressing these bollworm in multiple crops in area withBtcotton[2],which seems to justify the large-scale release of these transgenic cotton varieties.Nevertheless,the ecological and environmental risks of them,such as the impacts on non-target organisms,are widely concerned with[7].
Since Bt protein can be released into soil from different crop sectors[14-16],and wastes from the animals living onBtcotton vegetative parts[17],the potential risks ofBtcotton on the soil microbial communities should be paid more attention.
There exist some interactions between crop root exudates and rhizospheric soil microbial communities. Some rhizospheric microbes can affect root exudates through changing the content level of the allelopathic compounds,and vice versa,the allelopathic compounds can also affect non-target soil rhizospheric microbial communities.Although microbial biomass indicated microbial community size,Biolog was a method of analyzing the potential metabolic diversity of soil microbial community.Biolog has been widely used in assessing microbial metabolic diversity in agricultural soils.Over the years,increased understanding of the Biolog assay has demonstrated the reproducibility of Biolog profiles and supported the theory that shifts in Biolog metabolic diversity patterns are related to shifts in community composition.
TheAWCDreflects the sole-C-source utilization ability of the soil microbial community and soil microbial activity[9].H’is a measure of actual richness and evenness of the microbial community,Uis characterized of the diversity of C source utilization competence of mi-crobial community,Sis a reflection of the total number of C substrates utilized generally and defined as the number of different groups of microbes found occurring,whilstSEreflects the comparability of substrate utilization between all utilized substrates,and the expected distribution of microbial groups within the community[18-19].1/Dis an indicator of dominant types of microbes whereasGemphasizes the differences of the microbial community between in utilizing single C substrate.According to our results,it can be deduced that the rhizospheric soil samples of 99BC-8 and SM3 showed a larger richness and diversity of,and centered more dominant species in the microbial communities,with a lower comparability of metabolized substrates,thus reflecting a high metabolic potential and functional diversity in soil microbial communities,though there emerged differences between them,involving a greater quantity of microbes without activity within 99BC-8 rhizospheric soil sample.But more likely it is the releasing of Bt endotoxin into rhizospheric soil from transgenicBtcotton that selectively or in varying degrees,affected both G+/G-bacteria and other microbes,and their growth at different stages in the rhizospheric soil.In other words,the presence of Bt endotoxin likely stimulated the growth of some specific microbes by using their preferential C sources,which seemed to dominate the microbial responses in the soil although inconsistent responses in the two transgenicBtlines.For instance,β-Hydroxybutyric acid and Xylitol were more likely utilized by the G+bacteria for 99BC-4 and the G-bacteria for 99BC-8.As for the microbial communities and metabolically functional diversity,the soil samples were discriminated from one another rationally.
Correlations between soil microbial functional diversity and organic C have been reported[20].The importance of organic C in influencing the variation of soil microbial functional diversity was also concerned[21]. Another report held that there was a significantly positive correlation between the total soil microbial number,AWCD,Cmic,andH’[22].However,rather than supporting these assumptions,from this study,the positive correlation is not involved withCmic.Of course,further investigations(for example,using different soil types and microbial diversity analysis techniques)of the relationship would be necessary to substantiate this conclusion.
Moreover,the data obtained showed that there was,to some extent,a positive correlation between Fe content[8],S,AWCD,andH’,Ualthough redundancy analysis(RDA)was not used to visualize the relationships between microbial parameters and soil chemical properties.
Biolog technique has widely been used in part for its simplicity,availability of automated measuring apparatus,and yield of a great deal of information about an important functional attribute of microbial communities.Frankly speaking,however,the fundamental basis of using such an approach for ecological studies has been questioned on account of its dependence on inefficient extraction,the physiological status of inoculated cells,the subsequent growth of cells,the relevance and concentrations of the C substrates used[23],and still,the complicated data analysis[24],the degree to which the results reflect function rather than structure[25].Nevertheless,such methods have been shown in some cases to be as sensitive as or more sensitive than measuring microbial biomass and respiration[26],and they have been used to detect the effects of important environmental changes on sensitive ecosystems[27],even if the effects have likely come from the changes in the physio-biochemical properties of transgenicBtcottons for genetic amendments,rather than from the direct action of the expression product,Bt protein[28].
5 Conclusions
The widely planting of transgenic crops has made a research hit of the risks potentially imposed to soil microbes and agro-ecosystem.Combined with the earlier study[8],it is concluded that in the rhizospheric soils which had been planted by transgenicBtcotton lines(99BC-4,99BC-8),Cry1Ac Bt toxic protein changed soil nutrient conditions such as increasing N,Ca,Zn,Co and Cu but decreasing K and Mg contents.Bt endotoxin triggered more non-target soil microbes appearing in the rhizosphere,significantly raising Cmic,to degrade more rapidly such a cotton-re-leased allelopathic compound,but inhibited severely the growth of the microbes at work in 99BC-8 rhizospheric soil.Bt endotoxin affected selectively microbial composition,alteredtheutilizationpatternsofC sources,promoted the microbial functional diversity,and consequently,evolved into a better discrimination among the transgenicBtlines and their non-Btrecipient from one another.
To sum up,transgenicBtcottons pose effects on soil ecosystem,especially on rhizospheric soil nutrition and microbial communities.And the possibility of aftermath effects from transgenic crops cannot be excluded and environmental impact assessments must be examined on a case-by-case basis.We are,hereby,more inclined to hold that the research on the safety of transgenic crops is also a long-term and arduous task,which relies on systematic accumulative work for dozens of years.
[1] Mendelson M,Kough J,Vaituzis Z,et al.Are Bt crops safe[J]?Nature Biotechnology,2003,21(9):1003-1009.
[2] Wu K M,Lu Y H,Feng H Q,et al.Suppression of cotton bollworm in multiple crops in China in areas with Bt toxin-containing cotton[J].Science,2008,321(5896):1676-1678.
[3] Marvier M,McCreedy C,Regetz J,et al.A meta-analysis of effects of Bt cotton and maize on nontarget invertebrates[J].Science,2007,316(5830):1475-1477.
[4] Icoz I,Saxena D,Andrew D A,et al.Microbial populations and enzyme activities in soil in situ under transgenic corn expressing Cry proteins from Bacillus thuringiensis[J].Journal of Environmental Quality,2008,37(2):647-662.
[5] Lilley A K,Mark J B,Cartwright C,et al.Life in earth:the impact of GM plants on soil ecology[J]?Trends in Biotechnology,2006,24(1):9-14.
[6] Cartwright C D,Lilley A K.Mechanisms for investigating changes in soil ecology due to GMO releases[R].Defra report EPG 1/5/214:Department for Environment,Food and Rural Affairs,2004.
[7] Wolfenbarger L L,Phifer R P.The ecological risks and benefits of genetically engineered plants[J].Science,2000,290(5499):2088-2093.
[8] Liu G L.Different effects of transgenic Bt cotton on rhizospheric soil nutrition and soil enzyme activities[J].Jiangsu Forestry Science&Technology,2015,42(1):16-22.
[9] Garland J L,Mills A L.Classification and characterization of heterotrophic bacterial communities on the basis of patterns of community-level sole-carbon-source utilization[J].Applied Environmental Microbiology,1991,57:2351-2359.
[10]Zak J C,Willing M R,Moorhead D L,et al.Functional diversity of microbial communities:A quantitative approach[J].Soil Biology&Biochemistry,1994,26(9):1101-1108.
[11]Hackett C A,Griffiths B S.Statistical analysis of the time-course of Biolog substrate utilization[J].Journal of Microbiological Method,1997,30(1):63-69.
[12]Lupwayi N Z,Arsha M A,Rice W A,et al.Bacterial diversity in water-stable aggregates of soils under conventional and zero tillage management[J].Applied Soil Ecology,2001,16(3):251-161.
[13]Xue K,Luo H F,Qi H Y,et al.Changes in soil microbial community structure associated with two types of genetically engineered plants analyzing by PLFA[J].Journal of Environmental Sciences -China,2005,17(1):130-134.
[14]Saxena D,Flores S,Stotzky G.Transgenic plants:insecticidal toxin in root exudates from Bt corn[J].Nature,1999,402(6761):480.
[15]Losey J E,Rayor L S,Carter M E.Transgenic pollen harms monarch larvae[J].Nature,1999,399(6733):214.
[16]Zwahlen C,Hilbeck A,Gugerli P,et al.Degradation of the Cry1Ab protein within transgenic Bacillus thuringiensis corn tissue in the field[J].Molecular Ecology,2003a,12(3):765-775.
[17]Wandeler H,Bahylova J,Nentwig W.Consumption of two Bt and six non-Bt corn varieties by the woodlouse Porcellio scaber[J]. Basic Applied Ecology,2002,3(4):357-365.
[18]Fuller M E,Scow K M,Lau S,et al.Trichloroethylene(TCE)and toluene effects on the structure and function of the soil community[J].Soil Biology&Biochemistry,1997,29(1):75-89.
[19]Derry A M,Staddon W J,Kevan P G,et al.Functional diversity and community structure of micro-organisms in three arctic soils as determined by sole-carbon-source-utilization[J].Biodiversity and Conservation,1999,8(2):205-221.
[20]Degens B P,Schipper L A,Sparling G P,et al.Decreases in organic C reserves in soils can reduce the catabolic diversity of soil microbial communities[J].Soil Biology&Biochemistry,2000,32(2):189-196.
[21]Huang Z Q,Xu Z H,Chen C R.Effect of mulching on labile soil organic matter pools,microbial community functional diversity and nitrogen transformations in two hardwood plantations of subtropical Australia[J].Applied Soil Ecology,40(2),2008:229-239.
[22]Lin R Y,Rong H,Zhou J J,et al.Impact of allelopathic rice seedlings on rhizospheric microbial populations and their functional diversity[J].Acta Ecologica Sinica,2007,27(9):3644-3654.
[23]Konopka A,Oliver L,Turco R F.The use of carbon substrate utilization patterns in environmental and ecological microbiology[J]. Microbial Ecology,1998,35(2):103-115.
[24]Garland J L.Analytical approaches to the characterization of samples of microbial communities using patterns of potential C source utilization[J].Soil Biology&Biochemistry,1996,28(2):213-221.
[25]Garland J L.Analysis and interpretation of community-level physiological profiles in microbial ecology[J].FEMS Microbiological Ecology,1997,24(4):289-300.
[26]Johnson D,Leake J R,Lee J A,et al.Changes in soil microbial biomass and microbial activities in response to 7 years simulated pollutant nitrogen deposition on a heathland and two grasslands[J].Environmental Pollution,1998,103(2/3):239-250.
[27]Johnson D,Campbell C D,Lee J A,et al.Arctic microorganisms respond more to elevated UV-B radiation than CO2[J].Nature,2002,416(6876):82-83.
[28]Donegan K K,Palm C J,Fieland V J,et al.Changes in levels,species and DNA fingerprints of soil microorganisms associated with cotton expressing the Bacillus thuringiensis var.kurstaki endotoxin[J].Applied Soil Ecology,1995,2(2):111-124.
LIU Gen-lin
(Jiangsu Academy of Forestry,Nanjing 211153,China)
转基因Bt棉对根际土壤微生物群落的影响
根际箱中种植2个转基因Bt棉品系99BC-4,99BC-8及其非Bt受体泗棉3(SM3)后,于花期采集其根际土壤。BIOLOG检测显示,整个168 h的实验室培养期间,根际土壤微生物群落的每孔颜色平均变化率(AWCD)随着时间的推移呈现出差异性的S型曲线;AWCD值显示,GP2板低于GN2板和ECO板,意味着供试土壤内革兰氏阳性菌对碳源的利用能力较低。功能多样性分析表明,99BC-8和SM3根际土壤微生物群落的丰富度高、多样性强,集中了较多的主导微生物种,因而表现出高代谢能力和功能多样性。PCA得出,GN2板前2个主成分分别占总变量的35.59%和19.37%,GP2板前2个主成分分别占30.57%和18.89%。推理认为,Bt毒蛋白可能刺激了某些微生物利用优势碳源以促其生长,主导着土壤微生物的反应,虽然在2个转基因Bt棉品系根际土壤中其表现不一致。
转基因Bt棉;Biolog微生物鉴定系统;土壤;微生物群落;主成分分析
S154.36
A
1001-7380(2015)04-0028-07
2015-04-12;
2015-06-21
刘根林(1963-),男,江苏姜堰人,高级工程师,博士,主要从事农林土壤微生物群落的分子生物学研究。
刘根林
(江苏省林业科学研究院,江苏 南京 211153)
10.3969/j.issn.1001-7380.2015.04.007