利用Nd∶YAG激光诱导击穿光谱法检测橡胶共混物中锌的均匀性分布
2015-05-12汉诺威激光中心汉诺威30419德国
(汉诺威激光中心,汉诺威 30419,德国)
(汉诺威激光中心,汉诺威 30419,德国)
激光诱导击穿光谱是一种基于激光的定性、定量分析化学元素的方法,可用于分析混合室中的橡胶共混物。本文采用波长为1 064nm、脉冲能量为100mJ的Nd∶YAG激光诱导击穿光谱法检测橡胶共混物中锌的分散情况。实验表明,正确混料决定了橡胶产品的质量,较短的混合时间将会导致混料的不均匀分散;焦距等参数设置对光谱线强度影响较大。激发标定样品可产生标定曲线。通过行扫描可分析锌在橡胶共混物中的分散情况。通过估算沿着行扫描方向的强度分布,可检测由于混合时间较短和旋转速度不同而引起的锌均匀性变化。
激光诱导击穿光谱;橡胶;Nd∶YAG激光器;锌
1 Introduction
Scarce resources and increasing requirements to compete with each other internationally make it necessary to integrate new systems in modern production processes and to be more efficient.An essential area is quality management.Quality management systems have to be usable in offline and online application.One major intention is to reduce the amount of scrap from manufacturing materials.
Quality management is also an essential issue in the rubber industry.Rubber has many applications including tires,pipes,conveyor belts and many more parts.Experience shows that an irregular dispersion of the blending components can lead to a suboptimal rubber article.One such component is zinc oxide.Zinc oxide leads to better heat conductivity and reinforcement in tires[1].The rubber industry also uses zinc oxide as a ultraviolet(UV)stabilizer[1].
The number of rotor revolutions of the mixer has a huge influence on the dispersion of the blending components[2].By improving the mixing technique it is possible to improve the dispersion of the blending components.While the process is improving the irregular dispersion of the blending components it is still a significantly topic.Furthermore the evaluation of the homogeneous dispersion of the blending components is very challenging.Because current quality management methods,such as Mooney viscosity and stretching tests,do not provide direct information about the dispersion of the blending components,it is important to provide a practical method which allows the evaluation of the dispersion of the blending components.
In Ref.[3]a laser induced emission spectral analysis is shown,which is applicable as an instrument for quality assurance of rubber blends.Based on multiple measurements at different locations on the sample,it is possible to evaluate the dispersion in the sample.An excimer laser with 248nm and maximum 1 000 mJ pulse energy was used.The measurements were realized with shielding gas.The analyzed wavelength is in the range of 170-480nm.The major disadvantage of this method is the huge size of the laser and the required vacuum for the spectroscope which makes it an inflexible tool.In fact it is not applicable for industrial application.
2 LIBS
Laser-induced breakdown spectroscopy(LIBS)is a laser based method for the qualitative and quantitative analysis of chemical elements.LIBS can be applied to solid,liquid and gas samples,which makes it a very flexible tool.The major advantage of LIBS is without sample preparation.LIBS is a very fast analysis method so it is able for offline and online application.The laser beam is focused on the sample surface to generate a plasma.The plasma emits radiation which is analyzed by a spectroscope.Based on the focus size and the laser energy,only a small amount of the sample surface is destroyed.More details are shown in Ref.[4-5].
Because of the advantages,LIBS becomes an important tool for industrial applications.In addition to its function as a normal analysis tool,LIBS can also be used for recycling or characterization applications.One of application fields is the recycling of plastic where high process speed and the possibility ofonline and non-destructive analysis are required[6].Another application field is the identification of steel[7-9].In this field LIBS can be used to ensure material composition.
3 Experimental Setup
The rubber samples which have been used for the experiments were provided by the DIK(Deutsches Institut für Kautschuktechnologie e.V.).
The experimental setup is shown in Fig.1.The sample chamber,the LIBS-head and the spectroscope console are from Applied Photonics Ltd.As a laser source,a Nd∶YAG laser with a wavelength of 1 064nm,maximum 100 mJ pulse energy,8 ns pulse duration and a repetition rate of 1-20 Hz was used.The experiments were operated with the maximum pulse energy of 100 mJ and a repetition rate of 10 Hz.

Fig.1 Sample chamber with LIBS-head,laser-head and spectroscope console
The sample chamber ensures the laser security and also includes a computer based translation stage which allows scanning of the sample surface.The spectroscope console contains 5 spectroscopes.Each spectroscope provides a specific wavelength range.Tab.1 gives an overview about the spectroscope specifications.

Tab.1 Spectroscope specification
The spectroscopes provide a wavelength range of 314-977nm.The setup was chosen because of its advantages concerning industrial requirements.The small and robust construction of the setup allows a high mobility.The use of a compact laser system makes the setup cost efficient.
The schematic setup of the LIBS-head is shown in Fig.2.The laser beam is focused on the sample surface togenerateaplasma. Focallength is 80mm.Theoretical minimum spot size is approx.25μm.By moving the beam expander it is possible to position the focal beam on the sample.The emitted radiation is guided to the spectroscopes(see Tab.1)by lenses and optical fibers.The aperture nozzle ensures that the sample surface and the plasma are effectively purged with argon.The argon has two functions.Firstly the argon stream protects the lenses against pollution which accrues by the plasma generation.Secondly the argon influences the properties and the dynamics of the plasma which leads to higher signal intensity[10].The aperture nozzle also acts as a reference level for the sample positioning.

Fig.2 Schematic setup of the LIBS-head and the focal position of the laser beam and the spectroscopes
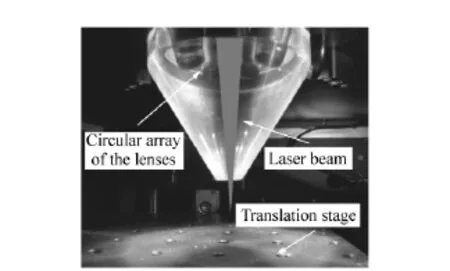
Fig.3 View into the sample chamber and the optical elements
Fig.3 shows the view into the sample chamber.The red and blue tubes are the holders for the lenses.The laser beam expands in the middle of these tubes.
4 Experimental Results
The goal of investigation was to check the possibility to detect the zinc dispersion in rubber blends with LIBS with a Nd∶YAG laser.Information about relevant zinc spectral lines are listed in spectra databases[11]and[12].The NIST-Database indicates Zn(Ⅰ)lines with a high intensity at 213.9nm,280.1nm,328.2nm,330.3nm,334.5nm,468.0 nm, 472.2 nm, 481.1 nm and 636.2nm[11].
In the first step it was necessary to find out the best setup parameters for the experiments.As shown in Fig.2,it is possible to change the distance between the sample surface and the aperture nozzle by lifting or lowering the sample.This leads to a shift of the plasma in the focal position of the spectroscopes.If the distance between the sample surface and the aperture nozzle is too small or too big,the generated plasma is out of the field of vision of the spectroscopes.Furthermore it is possible to change the focal position of the laser beam on the sample surface by moving the beam expander which leads to different surface intensities.In fact,the intensity of the zinc spectral lines depends on these two parameters.Fig.4 shows the mean zinc intensity of aluminium alloy calibration sample at 481.1nm as a function of these two parameters.The aluminium alloy calibration sample contains 7.36%zinc and was used to ensure a homogeneous zinc dispersion.The measurement raster was measured with a step size of 0.5mm.For the calculation of the mean zinc intensity,10 spectra were taken at each measurement point.The intensity between two measurement points was interpolated linear.The different colours indicate the zinc intensity.Red and blue indicate the highest and the lowest zinc intensity,respectively.For the further experiments the parameter from the red marked area were taken.The focal position of the laser beam was fixed with-3mm in the sample and the distance between the aperture nozzle and the sample surface was fixed with 5mm.
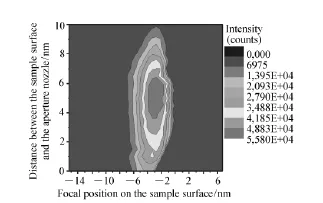
Fig.4 Zinc intensity of an aluminium alloy calibration sample at 481.1nm depending on the focal position of the laser beam and the distance between the aperture nozzle and the sample surface
In the next step a reference spectra were taken from a sample which only contains natural rubber and a sample which contains natural rubber and 10 phr(per hundred rubber)zinc oxide to locate the relevant zinc lines for this sample composition.The reference spectra are shown in Fig.5.
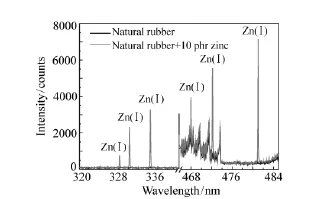
Fig.5 Reference spectra of natural rubber and natural rubber+10 phr zinc
The spectrum of the rubber zinc sample(red marked curve)shows the characteristic zinc lines at 328.2nm,330.3nm,334.5nm,468.0nm,472.2nm and 481.1nm.These lines agree with the information form the NIST-Database[11].These lines do not occur in the reference spectrum of the rubber sample(black marked curve).The highest intensity provides the spectral line at 481.1nm which makes it practical for the further investigations.
To get an information about the zinc concentration in rubber samples,it is necessary to create a calibration curve.The result from this experiment is shown in Fig.6.The points in the chart show the mean zinc intensity at 481.1nm for rubber samples which contain 0.5,1.0,1.5,5.0,10.0 and 20.0 phr zinc.The mean zinc intensity of each sample was determined based on 10 measuring points per sample.At each measuring point 20 spectra were taken.To avoid the influence of a polluted surface,5 cleaning shots were carried out at each measuring point to clean the sample surface.The error bar shows the standard deviation.The line shows the lineargradientbetween the zinc intensity at 481.1nm and the zinc concentration in the rubber sample.

Fig.6 Zinc concentration as a function of the signal intensity at 481.1nm
A difficult challenge in the manufacturing of rubber products is the homogeneous dispersion of the blending components.Fig.7 shows an energy dispersive X-ray scanning of two rubber blends.These samples contain 4 phr zinc.Fig.7(a)shows the zinc dispersion of sample A which was mixed with 40 revolutions per minute and Fig.7(b)shows the zinc dispersion of sample B which was mixed with 70 revolutions per minute.Each mixing process has the same mixing time.Sample A shows agglomerations of zinc(white spots which are encircled)which indicates an inhomogeneous zinc dispersion.Comparisons to Sample B there are no observable zinc agglomeration which indicates a homogeneous zinc dispersion.Higher revolutions per minute at the same mixing time lead to a homogeneous zinc dispersion in the rubber blend.

Fig.7 Energy dispersive x-ray scanning of the zinc dispersion in the rubber sample(figure adaption:lightness=+20%and contrast=+20%)
To get an information about the zinc dispersion based on LIBS,it is necessary to operate regional measurements.Therefore,5 line scans on different positions of the sample surface were carried out.Each line scan comprised 20 measuring points with an interval of 0.5mm.10 spectra were accumulated at each measuring point.For the evaluation of the zinc dispersion the knowledge about the variation coefficient is important.This value represents the variance of the zinc intensity along the line scan.Zinc agglomerations which cross a line scan lead to a regional increase of the zinc intensity.The variation coefficient attends as a dimension for the zinc dispersion.If the variation coefficient is high,the zinc dispersion is inhomogeneous.If the variation coefficient is low,the zinc dispersion is homogeneous.
Tab.2 shows the variation coefficient of the line scans for the sample A and the sample B.Sample A showsa variation coefficientof 26.3% up to 37.0%.Sample B shows a much lower variation coefficient of 6.7%up to 12.6%.The lower variation coefficient indicates a homogenous zinc dispersion.This result agrees with the result from the energy dispersive X-ray scanning in Fig.7.

Tab.2 Variation coefficient of the zinc intensity at 481.1nm of different line scans for a mixing process with 40(sample A)and 70(sample B)revolutions per minute
5 Conclusion and Outlook
It is possible to detect zinc in rubber blends by using LIBS with a Nd∶YAG laser.The intensity of the zinc spectral lines depends on the correct focal position of the laser beam and the spectroscopes.The determined calibration line shows a linear relation between the intensity of the zinc spectral line at 481.1nm and the zinc concentration in the rubber sample.The analysis of the variation coefficient provides the evaluation of the zinc dispersion in a rubber sample.The chosen setup is mobile,robust and cost efficient,which makes it very interesting for industrial applications.The results provide opportunity for further research into LIBS online measurements for rubber production process.
[1]SAHOO S,MAITI M,GANGULY A,et al..Effect of zinc oxide nanoparticles as cure activator on the properties of natural rubber and nitrile rubber[J].J.Applied Polymer Science,2007,105:2407-2415.
[2]FREAKLEY P K.Distributive mixing characteristics of batch internal mixers[J].Rubber Chemistry and Technology,1992,65:706-714.
[3]KEUTER H,ACKFELD D,LIMPER A.RELMA-ein instrument zur qualit tssicherung im mischsaal(Teil 1)[J].KGK Kautschuk Gummi Kunststoffe,2000,53:566-573.
[4]YUEH F Y,SINGH J P,ZHANG H.Laser-induced breakdown spectroscopy,elemental analysis[J].Encyclopedia of Analytical Chemistry,2000,2066-2087.
[5]KHATER M A.Laser-induced breakdown spectroscopy for light elements detection in steel:state of the art[J].Spectrochimica Acta Part B,2013,81:1-10.
[6]ANZANO J,BONILLA B,MONTULL-IBOR B,et al..Plastic identification and comparision by multivariate techniques with laser-induced breackdown spectroscopy[J].J.Applied Polymer Science,2011,121:2710-2716.
[7]STURM V,VRENEGOR J,NOLL R,et al..Bulk analysis of steel samples with surface scale layers by enhanced laser ablation and LIBS analysis of C,P,S,Al,Cr,Cu,Mn and Mo[J].J.Analytical Atomic Spectrometry,2004,19:451-456.
[8]HEMMERLIN M,MEILLAND R,FALK H,et al..Application of vacuum ultraviolet laser-induced breakdown spectrometry for steel analysis comparison with spark-optical emission spectrometry figures of merit[J〛.Spectrochimica Acta Part B,2001,56:661-669.
[9]PALANCO S,LASERNA J J.Full automation of a laser-induced breakdown spectrometer for quality assessment in the steel industry with sample handling,surface preparation and quantitative analysis capabilities[J].J.Analytical Atomic Spectrometry,2000,15:1321-1327.
[10]NOLL R.Laser-Induced Breakdown Spektroskopy[M].Berlin:Springer Verlag,2012.
[11]NIST Atomic Spectra Database Lines Form[EB/OL].[2013-04-15].http://physics.nist.gov/PhysRefData/ASD/lines_form.html.
[12]Applied Photonics-Analytical Capabilities of LIBS[EB/OL].[2013-05-10].http://www.appliedphotonics.co.uk/Libs/capabilities_libs.htm.
Author's biography:

Benjamin Emde,M.Sc.:He studied Electrical Engineering at the University of Applied Sciences Osnabrueck.Since 2011,he works at the Laser Zentrum Hannover e.V.,as a member of the group Machines and Controls.E-mail:b.emde@lzh.de

Stefan Kaierle,Dr.-Ing.:He studied electrical engineering and went on to do his PhD in mechanical engineering at RWTH Aachen University.In 1998 he entered Fraunhofer ILT as a department head for system technology.In this role,his main research was focused on laser system technology,laser materials processing,laser process control and optics,as well as related fields like eco-efficiency,automation and laser engineering.In 2012,he moved to Laser Center Hannover(LZH)and assumed responsibility for the department of Materials and Processes.He has been the President of the European Laser Institute(ELI)for 10 years(2003-2013)and is now member of the Board of Directors of the Laser Institute of America(LIA).He has been chairman and board member of many international conferences.His academic achievements have been honored by the Laser Institute of America(Fellow),the European Laser Institute(Fellow)and the CIOMP,Chinese Acadamy of Sciences(Honorary Professor).E-mail:s.kaierle @lzh.de

Jörg Hermsdorf,Dr.-Ing.:He received his degree at the college of higher education in 1996.He then worked in the building industry as a project and welding engineer.In 2001,he started working at the Laser Zentrum Hannover e.V.as a research scientist.In 2009 he took over the position as the group leader of the Machines and Controls group.In 2013 he earned a PhD in mechanical engineering at the Leibniz University of Hannover.He has significant experience in arc and laser welding of steel,aluminium and other materials from different projects.E-mail:j.hermsdorf@lzh.de

Ludger Overmeyer,Prof.Dr.-Ing:He studied electrical engineering at the University of Hannover.In 1996 diploma in electrical engineering,PhD in mechanical engineering(production technology)at the LeibnizUniversitätHannover. He heads the Institute of Transport and Automation Technology(ITA)at the Leibniz Universität Hannover and is member of the management board of the Institute of Integrated Production Hannover(IPH).He was appointed to the Board of Directors of the LZH in 2010 and is a Scientific-Technical Director of the Laser Zentrum Hannover e.V.since April 2013.E-mail:l.overmeyer@lzh.de
利用Nd∶YAG激光诱导击穿光谱法检测橡胶共混物中锌的均匀性分布
EMDE Benjamin,HERMSDORF Jörg,KAIERLE Stefan*,OVERMEYER Ludger
Identification of the zinc dispersion in rubber blends by libs with a Nd∶YAG laser
EMDE Benjamin,HERMSDORF Jörg,KAIERLE Stefan*,OVERMEYER Ludger
(Laser Zentrum Hannover e.V.,Hannover 30419,Germany)
*Corresponding author,E-mail:s.kaierle@lzh.de
Laser-induced breakdown spectroscopy(LIBS)is a laser based method for the qualitative and quantitative analysis of chemical elements.It could be used for the analysis of rubber blends in the mixing room.In this paper,zinc dispersion in rubber blends is detected with LIBS by using a Nd∶YAG laser with a wavelength of 1 064nm and a pulse energy of 100 mJ.Experiments show that the quality of rubber products depends on the correct blending of the mixing components.For example short mixing times can lead to an inhomogeneous dispersion of these components.The intensity of the spectral lines is strongly affected by the setup parameters like the focal position.The use of calibration samples allows creating a calibration curve.Based on line scans,the zinc dispersion in these rubber blends can be analyzed.Variations in the homogeneity of the zinc caused by short mixing times or different rotation speed of the mixer can be detected by the evaluation of the intensity profile along these line scans.
LIBS;rubber;Nd∶YAG-Laser;zinc
QUAK“Quality evaluation system for caoutchouc mixtures”
2095-1531(2015)04-0596-07
TN247 文献标识码:A doi:10.3788/CO.20150804.0596
2015-04-06;
2015-05-11