Fatigue Strength Evaluation of Transverse Fillet Welded Joints Based on Notch Stress Strength Theory
2015-05-03SHENWeiYANRenjunNigelBARLTROPYANGPingLIUEnqianQINKai
SHEN Wei,YAN Ren-jun,Nigel BARLTROP,YANG Ping,LIU En-qian,QIN Kai
(1.Key Laboratory of High Performance Ship Technology of Ministry of Education,Departments of Naval Architecture, Ocean&Structural Engineering,School of Transportation,Wuhan University of Technology,Wuhan 430063,China; 2.Department of Naval Architecture and Marine Engineering,University of Strathclyde,Glasgow G4 0LZ,United Kingdom)
Fatigue Strength Evaluation of Transverse Fillet Welded Joints Based on Notch Stress Strength Theory
SHEN Wei1,YAN Ren-jun1,Nigel BARLTROP2,YANG Ping1,LIU En-qian2,QIN Kai1
(1.Key Laboratory of High Performance Ship Technology of Ministry of Education,Departments of Naval Architecture, Ocean&Structural Engineering,School of Transportation,Wuhan University of Technology,Wuhan 430063,China; 2.Department of Naval Architecture and Marine Engineering,University of Strathclyde,Glasgow G4 0LZ,United Kingdom)
It is necessary to better understand the fatigue strength evaluation of welded joints with consideration of the discontinuous geometry factors that produce locally high stresses.This paper proposed a new method of determining geometric stress at the corner by using the singularity strength‘as’.The fatigue strength of cruciform joints with different geometries are summarized in a single scatter band by the N-SIF method.The results show that the proposed method has the additional advantage in simplified fatigue strength estimation for welded joints.
cruciform joints;singularity strength(as);notch-stress intensity factor(N-SIF); fatigue strength
0 Introduction
Classification method,also termed nominal stress method or S-N curve approach,is the basic method for fatigue strength evaluation of welded joints embodied in most of current fatigue design specifications[1-3].This method is based on the design nominal stress,without taking into account explicitly the stress discontinuity due to the presence of the joint.Classification method is simple to use,but it is difficult to apply this method directly if the object detail is complicated and incomparable to any classified joints,or the loadings are complex to make it difficult or impossible to determine the nominal stress[4].
It has already been shown in Refs.[5-7]that N-SIFs can be used to predict the structure strength and fatigue strengths of mechanical components weakened by V-shaped re-entrant corners,where the singularity in the stress distribution makes any failure criterion based on elastic peak stress no longer applicable.Based on notch strength theory,this paper proposed a simple method using the singularity strength‘as’to estimate the stress field distribution at the corner.Finally,a synthesis of experimental fatigue strength data based on the formula iscompared.
1 Singular stress fields analysis
1.1 Williams method
Williams[8]stated that,even in a sharp open notch,the stress field is singular close to the tip.In a polar frame of referencethe stress field around the corner is the summation of Mode I(opening type)and Mode II(sliding type)stress.

where r is the distance to the corner;Eq.(2)determines the eigenvalues λi.For details of λi,please see Eq.(3).

where‘q’is related to the opening angle 2α by means of the expression 2α=π 2-( )q (see Fig.1).Parameters are defined in Fig.1.Accordingly,symbols around the 135°corner can be defined as shown in Fig.2.

Fig.1 Symbols around the 135°corner

Fig.2 Symbols of sharp V-shaped notch stress field
Then,stress components for Mode I(tension)are given by[7]:

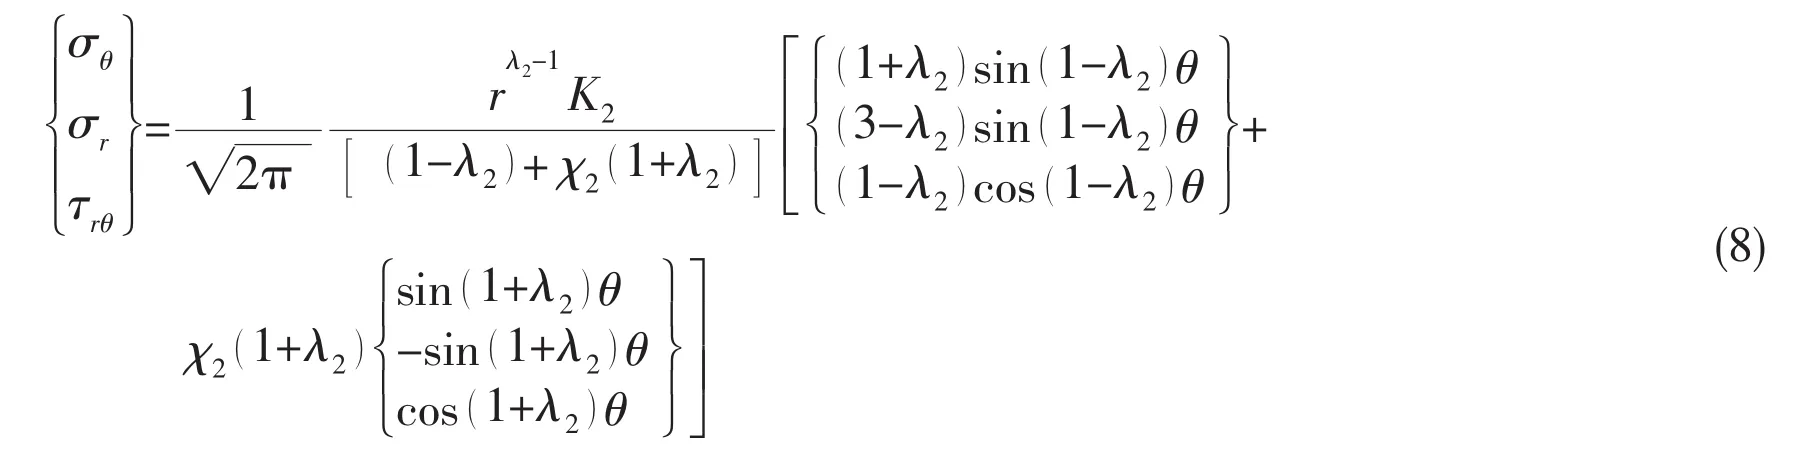
For Mode II(shear)by[7]:

In order to give a physical meaning to the constant values present in Williams’formula, Gross and Meldenson[9]proposed to extend the definition of the SIF,commonly used to describe crack stress fields,to open notches.Based on the stress field components,the definitions forN-SIFs are:

When 2α=0,K1equals to the SIF KIof the linear elastic fracture mechanics.Applying definitions(5)to(3)and(4),the real and imaginary parts of the complex constant aiare:

It is therefore possible to present Williams’formula for stress components as a function of the N-SIFs for Mode I,tension:

for ModeⅡ,shear:
where r is the distance to the corner;kiis a function of h,t,L;σ0is the nominal tensile or bending stress.Kiis the N-SIF value defined by Lazzarin and Tovo[7].
1.2 Modified singularity strength method
According to the studies of Lazzarin and Tovo[7],the axial stress distribution of Mode I at a corner can be written as:

And for ModeⅡ:

where x is the distance to the corner;

fi(h,t,L)=ki;pi=1-λi,for different corner angles,from Williams[8],are shown in Tab.1.Parameters are defined in Fig.1.

Tab.1 Values of constants and exponents as a function of notch opening angle[7]

To simplify the calculation of g h,t,( )L ,a new parameter‘as’is introduced and named as singularity strength to describe the stress field at the corner,see Eq.(11):

Expressions for as1and as2have already been reported for transverse non-load carrying fillet welded joints subjected to tensile stresses and bending stresses[10].Tensile:

Bending:

1.3 N-SIF value Ki
As soon as as1and as2are known,the relevant stress distribution can easily be computed by means of Eq.(12).As shown in Tab.1 and Fig.2,when 2α=135°,θ=22.5°.λ1=0.674,λ2=1. 302,χ1=4.153,χ2=-0.569.It is therefore possible to present expressions of the N-SIF values:

2 Fatigue strength analysis
2.1 Basic S-N curves
For the purposes of fatigue design,welded joints are divided into several classes,each with a corresponding design S-N curve.The basic design curves consist of linear relationship between log SB( )and log()N.They are based upon a statistical analysis of appropriate experimental data and may be taken to represent two standard deviations below the mean line.Thus the basic S-N curves are of the form:

where N is the predicted number of cycles to failure under stress range SB;k1is a constant relating to mean S-N curve;d is the number of standard deviations below the mean;σ is the standard deviation ofm is the inverse slope of the S-N curve.
The relevant values of these terms are shown in Tab.2.This also shows the value of k2, where:

S-N curves in Guide for Hull Structure Fatigue Strength of CCS[3]are also using the modified 8 curves published by the Department of Energy of UK.All these curves are mean-line S-N curves.We can obtain the similar S-N curves by adjusting the value of k.It is worth noting that the inverse slope of m is the constant 3,which are 4 or 3.5 for curves B and C in British Standard[2](see Tab.2).Therefore,the inverse slope and k are different for Classes B and C between two standards.
2.2 Specimens under tensile loading
The 16 series under tensile loading exhibited large variations of plate thickness(from 13 mm to 100 mm),attachment size and bead height(see Tab.3).The S-N diagram is shown in Fig.4(a).Due to large variations in the geometrical parameters,the scatter of the experimental data is very pronounced.In the same figure,the fatigue strength data are also given in terms of ΔK1,computed on the basis of Eq.(16),neglecting for the sake of simplicity the Mode II influence.

Tab.2 Details of basic S-N curves in BS 7608 and Department of Energy,UK[2]

Tab.3 Summary of fatigue strength for axially loaded welded specimens (R≈0,N=5×10⁶)
The same series were separately analyzed using the least squares method to determine mean curves and their intercepts for 5×10⁶cycles(see Tab.3).The scatter in fatigue strengthof different geometries reduces from±40%(the variation referring to the mean of the overall distribution)to±10%, assuming ΔK1is a meaningful parameter in fatigue strength predictions.
As shown in Fig.4(a),experimental data focus on F2 curve,just between Classes D and W.If the thickness correction is taken into account,all the data will match with class curve F2.The results are consistent with the general principles of selecting S-N curves in CCS and British standards.For fillet weld of cruciform,the recommended class curve is F while it is F2 for full penetration weld(see Fig.3).
Fig.4(b)summarizes steel welded joint data under tensile loading,all referring to a nominal load ratio R≈0,in a single scatter band(mean values±two standard deviations),of which the top and bottom lines refer to a probability of survival equal to 2.3%and 97.7%,respectively.At Nref=5×10⁶cycles to failure,the mean value of ΔK1value 23.4 MPam0.326while the scatter index TK(TK=K1,Ps=2.3%/K1,Ps=97.7%)is 1.28. The mean value of Δσ value 69.6 MPa while the scatter index TKis 2.69.It is evident that the scatter greatly decreases,in particular in the high cycle fatigue.

Fig.3 Classification of details

Fig.4 Fatigue strength in terms of nominal stress and N-SIF ranges under tensile load (Note:Arrows represent unbroken specimens)
2.3 Specimens under bending loading
As far as the welded joints under bending loading are concerned,seven series were reported in a well-documented contribution due to Gurney[11].Fatigue strengths listed in fatigue design specifications for classified welded details are mainly based on the fatigue test results of welded joints subjected to tensile or combined tensile-bending loads.In comparison,fatigueexperiments are rarely conducted on welded joints with pure bending loads and therefore fatigue strengths are not often seen in fatigue design specifications for welded joints subjected to pure bending loads.Referring to the fatigue strength under tension may result in inaccurate fatigue life estimation for a welded detail in bending[12].
As shown in Fig.5(a),all the experimental data deviate above the curve F2,which just proves the point of view above.The fatigue strength in terms of the nominal flexural stress range is much higher than that shown in the design fatigue specifications for the transverse fillet welded joints in tension.The effect of thickness is evidently shown in Tab.4,with the general trend being demonstrated that the fatigue strength decreases with the increase in the thickness of the main plate.

Tab.4 Summary of fatigue strength for bending loaded welded specimens (R≈0,N=5×10⁶)[13]

Fig.5 Fatigue strength in terms of nominal stress and N-SIF ranges under bending load
Fig.5(b)summarizes steel welded joint data under bending loading,all referring to a nominal load ratio R≈0,in a single scatter band(mean values±two standard deviations).At Nref=5×10⁶cycles to failure,the mean value of ΔK1value 20.8 MPam0.326while the scatter indexTK(TK=K1,Ps=2.3%/K1,Ps=97.7%)is 1.33.The mean value of Δσ value 95.5 MPa while the scatter index TKis 1.80.The scatter in fatigue strength of different geometries reduces from ±30%to ±10%.
3 Conclusions
To demonstrate the applicability of the N-SIF approach in welded joint fatigue estimates, a careful check has been performed by using the fatigue results of Gurney for transverse nonload-carrying fillet welds.Due to large variations of the main plate thickness,bead and attachment sizes,the original S-N data appeared largely scattered.The scatter band was greatly reduced(in particular for N≥106cycles)when the same data were displayed using the N-SIF approach given in this paper.
It can be concluded that the fatigue strength in terms of the nominal flexural stress range is much higher than that shown in the design fatigue specifications for the transverse fillet welded joints in tension and therefore overly conservative in predicting the fatigue strength of the joints under bending loading.Referring to the fatigue strength under tension may result in inaccurate fatigue life estimation for a welded detail in bending.
Acknowledgements
This work is supported by‘the Fundamental Research Funds for the Central Universities’(2013-JL-007).The authors would like to thank professor Xu Li,Lou Benqiang and Gao Song for their preliminary exploratory research.
[1]Hobbacher A.Recommendations on fatigue of welded components[S].ⅡW Document XV-845-96,1996.
[2]Welding Standards Policy Committee.Fatigue design and assessment of steel structures[S].British Standard 7608,1993.
[3]China Classification Society.Guide for hull structure fatigue strength[K].2007.
[4]Wingerde A M,Packer J A,Wardenier J.Criteria for the fatigue assessment of hollow structural section connections[J]. Journal of Construction and Steel Research,1995,35:71-115.
[5]Lazzarin P,Tovo R.A unified approach to the evaluation of linear elastic stress fields in the neighborhood of cracks and notches[J].International Journal of Fracture,1996,78:3-19.
[6]Atzori B,Lazzarin P,Tovo R.Stress field parameters to predict the fatigue strength of notched components[J].Journal of Strain Analysis for Engineering Design,1999,34(6):437-453.
[7]Lazzarin P,Tovo R.A notch stress intensity factor approach to the stress analysis of welds[J].Fatigue and Fracture of Engineering Materials and Structures,1998,21:1089-1103.
[8]Williams M L.Stress singularities resulting from various boundary conditions in angular corners of plates in extension[J]. Journal of Applied Mechanics,1952,19:526-528.
[9]Gross R,Mendelson A.Plane elastostatic analysis of V-notched plated[J].Fracture Mechanics,1972,8:267-327.
[10]Shen W,Yan R J,et al.Stress field analysis of 135-degree sharp corners based notch stress strength theory[J].Journal of Ship Mechanics,2014,19(3):273-283.
[11]Gurney T R.The fatigue strength of transverse fillet welded joints[M].Abington,Cambridge:Abington Publishing,1991.
[12]Zhao G X,Tao C,Xiao L Z.Fatigue strength evaluation of transverse fillet welded joints subjected to bending loads[J]. International Journal of Fatigue,2012,38:57-64.
[13]Gurney T R.Fatigue of thin walled joints under complex loading[M].Abington,Cambridge:Abington Publishing,1997.
Nigel BARLTROP,男,斯特莱斯克莱德大学船舶与海洋工程系教授;
刘恩骞(1989-),男,斯特莱斯克莱德大学船舶与海洋工程系博士研究生;
秦 恺(1989-),男,武汉理工大学交通学院博士研究生。
基于切口应力强度理论的横向角接焊接接头的疲劳强度评估
谌 伟1,严仁军1,Nigel BARLTROP2,杨 平1,刘恩骞2,秦 恺1
(1.武汉理工大学 交通学院船舶与海洋工程系,高速船舶工程教育部重点实验室,武汉 430063;2.斯特莱斯克莱德大学 船舶与海洋工程系,英国格拉斯哥 G4 0LZ))
在焊接接头处,由于几何的不连续造成了局部的应力集中,对其疲劳强度评估的研究是十分必要的。文章提出采用奇异强度(as)来计算接头处的几何应力,并基于N-SIF方法分析了不同几何尺寸下十字接头的疲劳强度。结果表明该修正公式可以十分简便地评估出焊接接头处的疲劳强度。
十字接头;奇异强度(as);切口应力强度因子(N-SIF);疲劳强度
U663.2
:A
谌 伟(1986-),男,武汉理工大学交通学院博士研究生;
U663.2
:A
10.3969/j.issn.1007-7294.2015.09.008
1007-7294(2015)09-1116-10
严仁军(1962-),男,武汉理工大学交通学院教授/博士生导师;
Received date:2015-05-19
Foundation item:Supported by National Natural Science Foundation of China(Grant No.51479153);the Fundamental Research Funds for the Central Universities(No.2013-JL-007)
Biography:SHEN Wei(1986-),male,Ph.D.student,E-mail:shenwei_abc@163.com;
YAN Ren-jun(1962-),male,professor/tutor.
猜你喜欢
杂志排行

船舶力学的其它文章
- Study of Damping Ratio Identification for a Truss Spar Based on Continuous Wavelet Transform
- Study on Vortex Induced Characteristics of Four Square Columns at Different Spacing Ratio
- Roll Motion Prediction of PSV with Anti-rolling Tank Based on RANS and Nonlinear Dynamic Method
- Numerical Simulation of Strong Shock Wave Impacting on Water-elastic Solid Interface by Essentially Modified Ghost Fluid Method
- A Double-layer Depth-averaged Boussinesq Model for Water Wave
- Low Noise Collocation on Fluid Pipeline System