Study and application of vibrating wire strain gauge in monitoring cable tension of FAST cable-net①
2015-04-17SunXiaoWangQiming
Sun Xiao (孙 晓), Wang Qiming
(National Astronomical Observatories, Chinese Academy of Sciences, Beijing 100012, P.R.China)
Study and application of vibrating wire strain gauge in monitoring cable tension of FAST cable-net①
Sun Xiao (孙 晓), Wang Qiming②
(National Astronomical Observatories, Chinese Academy of Sciences, Beijing 100012, P.R.China)
A cable net structure is selected to support its reflecting triangular aluminum panels of FAST (five-hundred-meter aperture spherical radio telescope). To ensure the security and stability of the supporting structure, cable force of typical cables must be monitored on line. Considering the stringent requirements in installation, accuracy, long-term stability and EMI(Electromagnetic interference), most of the commonly used cable force measurement methods or sensors are not suitable for the cable force monitoring of the supporting cable-net of FAST. A method is presents to accomplish the cable force monitoring, which uses a vibrating wire strain gauge to monitor the strain of linear strain area at the anchor head. Experiments have been carried out to verify the feasibility. The method has a series of advantages, such as high reliability, high accuracy, good dynamic performance and durability, easiness of maintenance, technical maturity in industry and EMI shielding. Theoretical analysis shows that there is a linear relationship between the cable body force and anchor head surface strain, and experimental results proves a good linear relationship with excellent repeatability between the cable body force and anchor head surface strain measured by the vibrating wire strain gauge, with a linear fit better than 0.98. Mean square error in practical measuring is 2.5t. The relative error is better than 4% within the scope of the cable force in FAST operation which meets practical demand in FAST engineering.
FAST, cable force monitoring, vibrating wire strain gauge, health monitoring
0 Introduction
FAST (five-hundred-meter aperture spherical radio telescope)[1,2]is a huge radio telescope located at a Karst depression named DaWoDang in the south of Guizhou province. A cable net structure with 6670 main cables and 2225 pull-down cables is used to support its reflecting panels[3]. Actuators are used to pull the cable net nodes by pull-down cables to form a series of dynamic paraboloids to trace interested astronomical bodies.
When in operation, the cable net of FAST is in stress variation and unequal stress state. The stress relaxation, fatigue failure and deformation will bring adverse effects to the massive structure of FAST. Cable force monitoring is of great significance for FAST cable-net structure.
There are several types of methods for cable force measurement, such as Magneto elastic[4], Anchor cable[5], Fiber bragg grating (FBG)[6], Frequency method[7], Resistance strain gauge[8]and Three point loading flexure[9]. Study shows that these methods have their weakness in practical engineering application. Their installation, accuracy, long-term stability and electromagnetic interference are not good to meet cable force monitoring requirements of the FAST project. The magneto elastic’s main drawback is produce high level pulse in operation, which will cause EMI. The anchor cable’s size and weight is too large to install. The frequency method must provide the extermal excitation. The resistance strain gauge is unprotected and use glue to install cannot guarantee its service life.
This work proposes a method to accomplish the cable force monitoring. It has a series of advantages, such as high reliability, high accuracy, good dynamic performance and durability, easiness of maintenance, technical maturity and easiness of EMI shielding.
1 Principle
1.1 Vibrating wire strain gauge
A vibrating wire strain gauge is mainly used to measure the strain value of structure surface. The model SM-2 miniature strain gauge, for example, makes use of materials elastic modulus known to measure tension and compression. The vibrating wire strain gauge measures strain in steel and cast iron members on buildings, bridges, dams and pipelines, as well as on reinforcing bars within mass concrete or piles[10]. It has advantages of high reliability, high accuracy, good dynamic characteristics and durability, easiness of maintenance and technical maturity, etc. When not in operation, it doesn’t produce any electromagnetic interference. Due to its structure characteristics and operation principle, it is likely to be well shielded for less EMI.
Model SM-2 miniature strain gauges is shown in Fig.1. It has a gauge and an electromagnet hosing. The gauge consists of a length of steel wire tensioned between two end blocks and protected by a connecting tube. The external forces applied on the end blocks change the tension in the wire and its resonant frequency, which is read by a built-in electromagnet. The electromagnet housing is separated from the gauge. It contains an electromagnet and a thermistor. This electromagnet housing can be permanently spot-welded in place over the gauge, or carried around with a reading unit. The structure is shown in Fig.2[11].
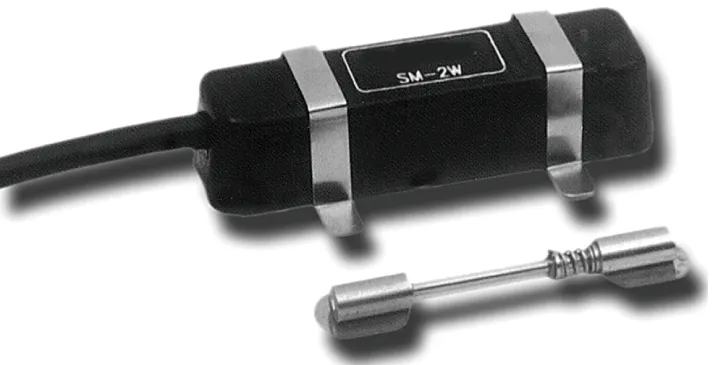
Fig.1 SM-2 vibrating wire strain gauge

Fig.2 SM-2 vibrating wire strain gauge structure
For the gauges, following formula[12]is presented:
Fw=εwAwEw
(1)
where Fwis the external forces applied to the steel wire in the gauge, εwis the strain value of the steel wire, Awis the cross-sectional area of the steel wire and Ewis the elasticity modulus of the steel wire.
The relation of the steel wires’ resonant frequency fw, with its length Lw, its density ρwand gravitational acceleration g can be expressed as
(2)
From the two formula above, the strain value of the steel wire can be derived as
(3)
When the gauge is reliably installed, the deformation of the steel wire is the same as the deformation of the monitored structure surface, which is shown below:
εwLw=εcLc
(4)
where εcis the strain value of the structure surface, and Lcis the distance between the two end blocks
Considering the temperature effect, this formula should be written as
(εw+Δtwα)Lw=(εc+Δtcβ)Lc
(5)
where △twis the temperature variation of the steel wire, α is the thermal expansion of the steel wire, △tcis the temperature variation of the monitored structure, and β is the thermal expansion of the monitored structure.
Then structure surface strain value εccan then be expressed as
(6)
When the monitored structure is cable anchor, α is reasonably assumed to be equal to β, and thermal expansion of the anchor head and the gauges is equal, which gives
(7)
The temperature effect on the monitoring results can be neglected to give
(8)
Constant K can be defined as
(9)
Then Eq.(8) can be simplified as
(10)
Eq.(10) indicates that the strain value of the monitored structure is proportional to the square of the steel wire vibration frequency of the gauge.
1.2 Cable structure of FAST cable-net
The high stress amplitude cable (OVM.ST)[13]is selected for FAST. It consists of multiple strand cables and anchorage connector at both ends. It has excellent dynamic and static performance and corrosion resistance. The cross section of the cables is shown in Fig.3.

1. Outer HDPE; 2. Zinc-coated wire; 3. Epoxy coated strands; 4. Inner HDPE; 5. Filler yarn; 6. High strength polyester belt
The anchor head structure is shown in Fig.4. The linear strain area of surface strain value is related to the cable force, which is to be calibrated. The cable force can be monitored by measuring the surface strain.

Fig.4 FAST project anchor head structure
The cable force can be reliably assumed to be equal to the anchor head force Fc. The anchor head force is related to its cross-sectional area Acand its elasticity modulus Ecby[14]
Fc=εcAcEc
(11)
here Acand Ecare constants, if K’ is as
K′=AcEc
(12)
Eq.(11) can be written as
Fc=K′εc
(13)
Eq.(13) shows that there is linear relationship between the anchor head force and its surface strain value. The vibrating wire strain gauge can be installed at the linear strain area when monitoring. From Eq.(10) and Eq.(13), the relationship between cable force and gauge strain value can be expressed as
(14)
Constants KK′ can be acquired by the experimental calibration.
1.3 Data acquisition
Data can be acquisited by the local monitoring unit DT MCU[15]produced by Datataker China Ltd[16]. The system is composed mainly of data acquisition module, power supply module, lighting protection module, communication interface and waterproof casing. Sensor signals of different types are connected to the data acquisition module after the lighting protection modules. Data acquisited can be transmitted by front-end ports and photoelectric conversion module to the specified control room for processing. The schematic of the device is shown in Fig.5. The device is shown in Fig.6.

Fig.5 Schematic of the DT MCU85G

Fig.6 DT MCU85G
DT MCU85G has 16 four-wire channels, which can be connected to 16 DTCEM-20 switch boxes to have the channel number extended to 320 at most, which is favorable for mass quantity sensors data aquisition. The DT MCU85G support signal sampling of voltage signal, current signal, frequency signal resistive signal, bridge signal, differential resistive signal, temperature signal, etc. Different manufacturer production of various types of sensors can be applied. The aquisited data can be transmitted to the upper computer by Ethernet interface, RS232 interface or USB interface. The shortest sampling period is about 10ms.
To aquisite the data of vibrating wire strain gauge, two wires of vibrating signals and two wires of temperature signals of the gauge are connected to any of the four-wire channels. The DT MCU85G can collect and output the data after related parameters are set. For future application, the diversity of sampling types is suitable for hybrid data collection of different types of sensors. The mature network communication technology can be used, which will significantly reduce the design and implementation of the data transmission network.
2 System
2.1 Cable load
The FAST cable test samples at the Miyun Observatory cable relaxation test bench are used for testing. In the process of the proposed experiment, cable force is applied in the range of 0 to 40t. The test bench is shown in Fig.7.

Fig.7 Cable stress relaxation test bench
2.2 Installation of the sensor
The gauge spot is welded at the anchor head’s clean and smooth surface, shown in Fig.8. The electromagnet hosing is then fixed with its own metal band. The specifications of the sensor is shown in Table 1.

Fig.8 Gauge installed at the surface

ModelSM-2WRange3000μεResolutionwithMB-6T0.01μεOperatingtemperature-20℃to+80℃Activegaugelength50.8mmThermistor3kΩElectricalcableIRC-41A,IRC-41AP
2.3 Data recording
The cable force is read from a 100t range tension sensor which is installed at one end of test bench. The data read is used both as a reference to load the cable and as a comparison data.
The frequency of vibrating wire strain gauge is read from DT MCU85G, which supplies the sensor’s power supply at the same time. The computer connected with MCU with network cable and using TCP/IP protocol to communicate. The sampling period is 2s (up to 10ms). And the data is recorded manually. Part of the data is shown in Table 2.

Table 2 Part of the data
3 Results
After the installation of the sensor, six sets of data in different time periods are recorded which contains 311 data points. The environment temperature range is 19.2℃ to 34.3℃. Use the dEX logger software which designed for DT MCU85G to simulation analysis data. The software interface is shown in Fig.9. Further analysis of data uses MATLAB. The different sets of data are shown in Fig.10.

Fig.9 Interface of the software

Fig.10 Different data sets
3.1 Data analysis
According to Eq.(14), there’s linear relationship between cable force F and the square of frequency of gauge f2. By data fitting[17]of the experimental results, the following is got:
F=3.2037×10⁻⁵f2-224.385
(15)
The linearity R2is up to 0.9885, which shows the feasibility and validity of this method. The data fitting formula and the data can be drawn in the same chart as shown in Fig.11. In practice, the coefficient of this formula can be acquired from the calibration of cable in the factory.

Fig.11 The data fitting formula
3.2 Error analysis
Each measured vibrating frequency point is substituted into the fitting formula to get the calculated cable force F. Each F is subtracted by the corresponding actual measurement cable force Fato get the absolute error value e as

(i=1,2,…,n) (16)
The absolute error value of all data calculated is shown in Fig.12. The minimum absolute error value is -4.1505t and the maximum absolute error value is 2.5427t.

Fig.12 The absolute error
Corresponding to the actual measurement cable force, the relative error can be expressed as
(17)
and is shown in Fig.13.

Fig.13 The relative error
From the relative error analysis, it can be found that when the cable force is larger, the relative is very small. To eliminate interference of low range, the root mean-squared relative error can be calculated as

(Fai≥Famin, i=1,2,…,n) (18)
For all of the test sample data, when the minimum actual measurement cable force Famintakes different values, different root mean-squared relative error can be got. It is shown in Fig.14. When the range is more than 25t, the root mean-squared relative error is less than 0.04. Because the cable force of FAST is usually around 40t. This accuracy can completely meet the engineering requirements of FAST.

Fig.14 The root mean-squared relative error for different ranges
4 Conclusion
(1) This work presents a method to accomplish cable force monitoring, which uses vibrating wire strain gauge to monitor the strain of linear strain area at the anchor head.
(2) The linearity of the strain on the surface of the anchor head and cable force is analyzed.
(3) Corresponding experiment is carried out. Experimental results shows that the linearity is better than 0.98, and the root mean-squared relative error with this measurement method is less than 4%.
As a mature industrial product, a vibrating wire strain gauge is used in steel and cast iron members on buildings, bridges, dams and pipelines. Its dynamic response time can be up to 10ms and its service life can be up to 10 years, which are withstood by test of many projects. Its weight and dimension are dozens of times less than the corresponding range of anchor cable. This makes it very easy to maintain and install. Its simple structure, small dimension and light weight makes it very convenient in application. It won’t produce high level pulse signal at work which makes it have better EMC performance.
For further application, the surface of anchor head does not necessarily allow direct welding of the gauge. Suitable installation base should be designed. Heat treatment of the anchor head should be applied to ensure the mechanical performance of the anchor head. The temperature compensation and calibration of the gauge is still to be further studied and tested before massive application.
[ 1] Nan R D. Five hundred meter aperture spherical radio telescope (FAST).Science in China: Series GPhysics Mechanics & Astronomy. 2006 ,49(2) : 129-148
[ 2] Nan R D, Li D, Jin C J, et al. The five-hundred-meter aperture spherical radio telescope (FAST) project. International Journal of Modern Physics D, 2011, 20(6): 989-1024
[ 3] Nan R D, Ren G X, Zhu W B, et al. Adaptivecablemesh reflector for the FAST. Acta AstronomicaSinica, 2003, 44: 13-18
[ 4] Zhou Y T, Tu H, Wang X L. Magneto elastic method of cable force monitoring system in the engineering application. Prestress Technology, 2011(5):35-40 (In Chinese)
[ 5] Liu H. The function of anchor dynamometer and its test methods. Sub grade Engineering, 2005(3):40-42 (In Chinese)
[ 6] Zhang X S, Du Y L, Sun B C, et al. Application of optical fiber grating pressure sensor on monitoring of cable’s tension. Journal of The China Railway Society, 2002,12(6):47-49
[ 7] Wu K X, Liu K P, Yang J X. Measuring system of cable tension based on frequency method. China Journal of Highway and Transport, 2006,3(2):62-66
[ 8] Li Q Z, Li G, Han Q Z. Experiment and application of resistance strain gauge. Research and Exploration in Laboratory, 2011, 4(4):134-137
[ 9] Yao W B, He T C, Wang F. A new method determining cable tension on cable-stayed bridge. Chinese Journal of Scientific Instrument, 2001,6(3):90-91
[10] Sun R J, Guan B H, He N. Foreign Geotechnical Monitoring Instruments. Nanking: Southeast University Press, 2006. 67-68 (In Chinese)
[11] Roctest. E50115-101125 Model SM-2 Miniature Strain Gauge. Canada: Roctest Limited, 2010
[12] Yang W, Gao Z F, Yang C Y. The application of vibrating string deformeter to quick detection of bridge. ShanXi Science &Technology of Communications, 2006,6(3):62-64
[13] Liuzhou OVM, OVM Engineering Co.Ltd. Information on http://www.ovmchina.com/, 2014
[14] Wang F, Yang S Y, Xiao D B, et al. Study on measuring method of cable force in cable structure construction monitoring. Spatial Structures, 2010,9(3):64-73
[15] Wu S H, Zhang Q, Luo M Z. A data acquisition system based on DTMCU. Water Resources &Hydropower of Northeast China, 2012,2(2):57-58(In Chinese)
[16] Data Taker. The number of Thai Technology Co. Ltd. Information on http://www.dtcl.net, 2014
[17] Ding K L, Shen Y Z, Ou J K. Methods of line-fitting based on total least-squares. Journal of Liaoning Technical University(Natural Science), 2010,2(1):44-47
Sun Xiao, born in 1987. He is a Ph.D student in National Astronomical Observatories, Chinese Academy of Sciences. His research interests include the design of sensors, sensor system and structure healthy monitoring.
10.3772/j.issn.1006-6748.2015.04.015
①Supported by the National Natural Science Foundation of China (No. 11173035, 11273036).
②To whom correspondence should be addressed. E-mail: qmwang@bao.ac.cn Received on Sep. 22, 2014, Zhu Ming, Wu Mingchang
杂志排行

High Technology Letters的其它文章
- Effect of laser heating on the microstructure and hardness of TRIP590 advanced high strength steel used for roll forming①
- Design of bilayer lengthened LDPC codes over expanded graph for relay channels①
- Secure planar convex hull protocol for large-scaled point sets in semi-honest model①
- Magnetometer calibration algorithm based on ellipsoid constraint①
- Motion mechanism analysis of two contacting rollers①
- Service optimization in programmable cloud network①