Parameter estimation for rigid body after micro-Doppler removal based on L-statistics in the radar analysis
2015-04-11YongWangandJianKang
Yong Wangand Jian Kang
School of Electronics and Information Engineering,Harbin Institute of Technology,Harbin 150001,China
Parameter estimation for rigid body after micro-Doppler removal based on L-statistics in the radar analysis
Yong Wang*and Jian Kang
School of Electronics and Information Engineering,Harbin Institute of Technology,Harbin 150001,China
In traditional inverse synthetic aperture radar(ISAR) imaging of moving targets with rotational parts,the micro-Doppler (m-D)effects caused by the rotational parts inuence the quality of the radar images.Recently,L.Stankovic proposed an m-D removal method based on L-statistics,which has been proved effective and simple.The algorithm can extract the m-D effects according to different behaviors of signals induced by rotational parts and rigid bodies in time-frequency(T-F)domain.However,by removing m-D effects,some useful short time Fourier transform(STFT)samples of rigid bodies are also extracted,which induces the side lobe problem of rigid bodies.A parameter estimation method for rigid bodies after m-D removal is proposed,which can accurately recover rigid bodies and avoid the side lobe problem by only using m-D removal.Simulations are given to validate the effectiveness of the proposed method.
parameter estimation,L-statistics,micro-Doppler(m-D),radar imaging.
1.Introduction
Images for moving targets generated by inverse synthetic aperture radar(ISAR)can be widely applied in military and civilianelds.By transmitting wideband signals and processing coherent azimuth echoes,a high range resolution and a high cross-range resolution are achieved,respectively.In traditional ISAR imaging of targets,a focused ISAR image can be obtained by the classical range-Doppler imaging algorithm.However,the micro-Doppler (m-D)effect appears in the ISAR imaging of the target with one or more fast moving parts.The effect which can decrease the quality of radar images attracts lots of attention.According to signals of azimuth echoes,recent studies indicate that rotational parts on targets can generate sinusoidally frequency modulated(FM)signals,while rigid bodies introduced constant frequency signals[1–2]. Therefore,in the ISAR images,rigid bodies are often covered by m-D effects and difcult to be detected.Several available extraction approaches of the m-D effects were proposed[3–8].The method based on the chirplet transform is used to separate the m-D effect from the radar image,which was proposed in[9].The wavelet transform method incorporated with the time frequency(TF)analysis was applied to extract m-D signatures from the received radar signals[10].Both wavelet-based and chirpletbased approaches were used in[11]to remove the m-D parts in theeld of synthetic aperture radar(SAR).Images of fast rotational parts can be obtained by the m-D effect and the method was proposed in[12].Using the method of the empirical mode decomposition(EMD)algorithm and the complex-valued EMD(CEMD),the m-D separation algorithm was proposed in[13]and[14].Comparing to CEMD,the proposed method of complex local mean decomposition(CLMD)was presented in[15].Recently,an effective and simple way to eliminate the m-D parts was proposed in[16],which is based on L-statistics. L-statistics can deal with the case that missing samples are present,and obtain robust distribution with remaining incomplete set of samples[17,18].With different behaviors between sinusoidally FM signals and constant frequency signals in the TF domain,the method sorts the short time Fourier transform(STFT)samples of signals according to their absolute values of each frequency bin.After the sorting procedure,the sinusoidally FM signals are almost at the bottom of the plane,while the distribution of constant frequency signals is unchanged.By removing the highest absolute STFT amplitude samples for each frequency,as in[16],the sinusoidally FM signals can be eliminated. By summing the rest of the STFT values along the timeaxis,the Fourier transform(FT)of the rigid body is ob-tained.This approach provides a very simple way to use and generates better results than other approaches.However,during the procedure of m-D removal,this method suffers from a problem that some STFT samples of rigid bodies are also removed,which can introduce side lobes close to rigid bodies.Therefore,a method based on the geneticalgorithm(GA)was proposedtorecovermissing data of rigid bodies in[19],owing to its wide application as stochastic optimization methods[20–22].Unfortunately, the GA always requires lots of parameter settings in the proceduresof encoding,crossover,mutationanddecoding, which increases the complexity of the method.Moreover, in order to obtain the best individual,necessary iterations should be maintained so that high computational cost appears.
ISAR images with the method of the traditional range Doppler should be processed separately along the range prole and the cross-range prole.Radar receives linear frequency modulated(LFM)signals reected by targets. After the dechirping process,range proles can be obtained by range compression(fourier transform)as explained before.Herein,we assume that range alignment and phase adjustment have been completed.The compression of the cross-range domain is the same with the range domain.
In this paper,we use the method of parameter estimation cooperatedwith m-D removalbased on L-statistics for the rigid body extraction and estimation.Owing to the L-statistics theory and the special propertiesof STFT,we can easilyremovethesignalsinducedbym-Deffectandreconstruct the FT of signals by summing STFT samples over time in each range bin.After the summary and removal of m-D effect,frequencies of rigid bodies can be accurately estimated so that this method can solve the side lobe problem by only using m-D removal based on L-statistics and avoid the highcomputationalcost of missing data recovery basedontheGA.Withall thefrequenciesofrigidbodiesin each range bin,the high quality ISAR image of the target can be obtained.
2.Returned radar signal model with m-D effects induced by rotational parts and rigid body separation based on the L-statistics
2.1Returned radar signal model with m-D effects induced by rotational parts
The point-scatterer model is always used in radar imaging,which can simulate the radar echoes of the moving target.Targets with rotational device may be expressed by two different parts with the point-scatterer model,the rigid bodies and the rotational parts.The rotational parts have an additional motion besides the whole motions of targets. In this paper,we assume that the motion compensation is implemented and the imaging model of the target on the imaging plane is unchanged during the coherent integration time(CIT).The ISAR imaging geometry is shown in Fig.1.XOY and X′OY′are the whole coordinate system for the target and the local coordinate system for the rotating parts,respectively.Rigid body A with the coordinate(xA,yA)rotates aroundthe imagingcenter O with the angular velocity ωOand the rotational radius is RA.Rotational part scatter B with the coordinate(xB,yB)in the local coordinatesystem X′OY′rotates aroundO′with the angular velocity ωO′and the rotational radius is RB.The distance between O and O′is ROO′and the distance from the radar to the imaging center of the target is RO.
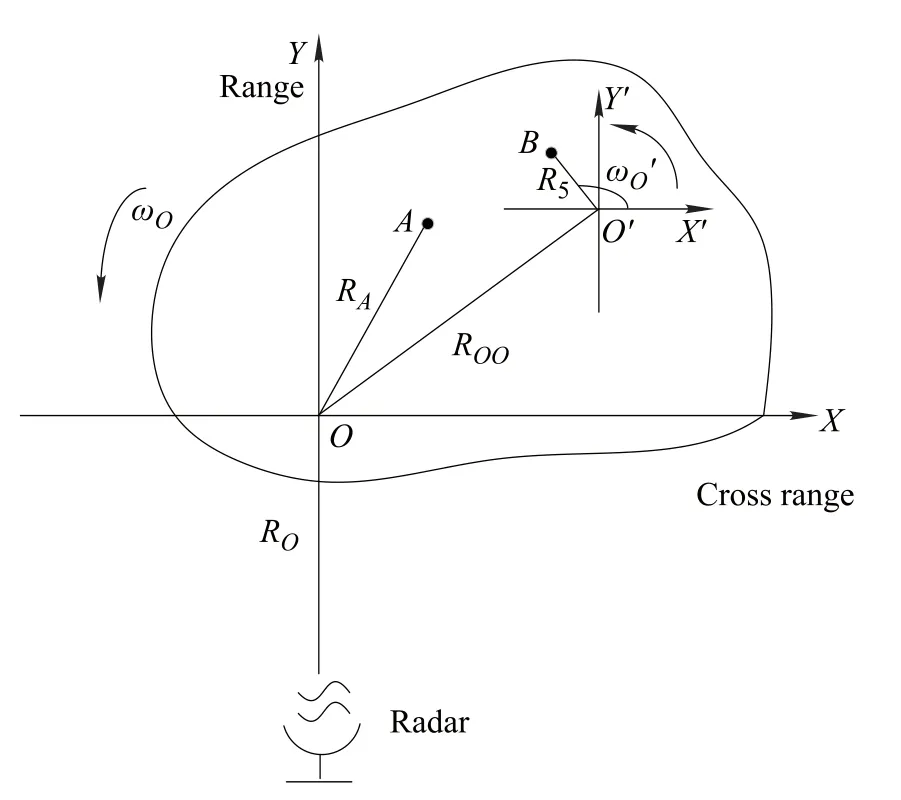
Fig.1 ISAR imaging geometry
Assume that the transmitted LFM radar signal can be expressed as
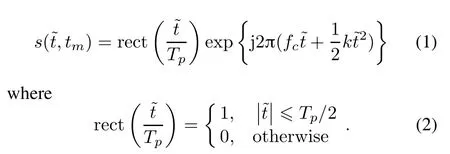
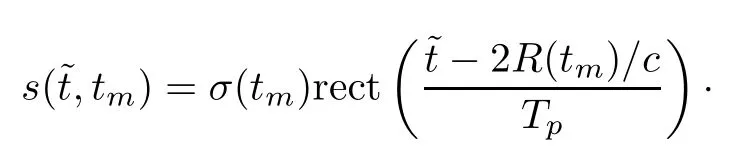
where σ(tm)is the reection coefcient at the slow time tm,and c is the velocity of the light.
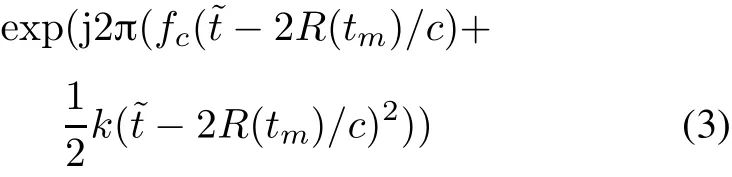
Taking the imaging center O as the the reference point, the reference signal can be written as

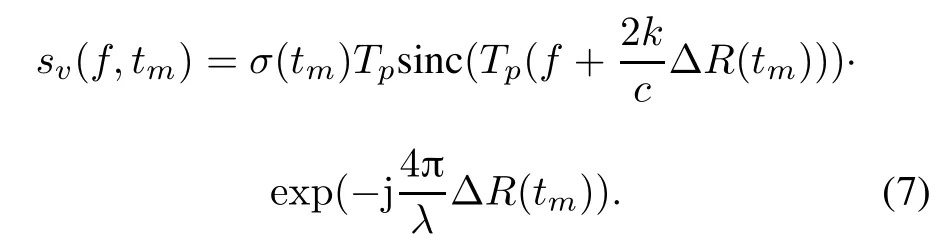
After dechirping the technique with the reference LFM signal,it yields
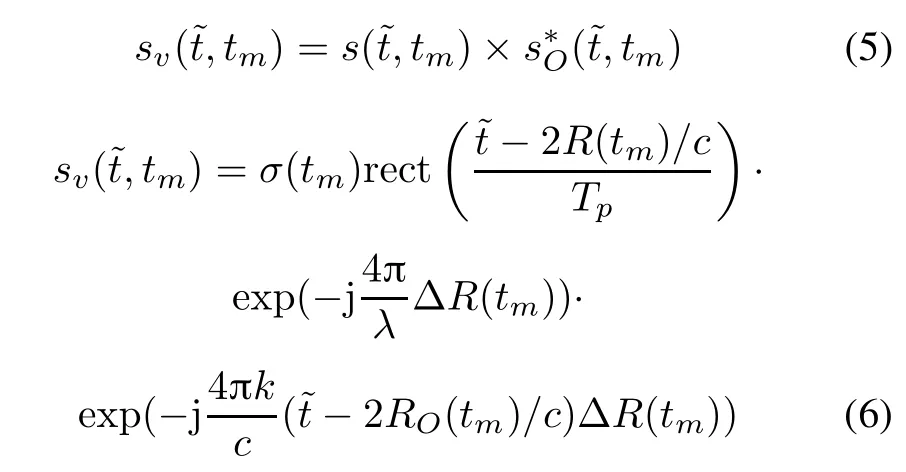
where λ is the wavelength of the carried signal and ΔR(tm)=R(tm)−RO(tm).Applying range compression FT in the fast time domain,we can obtain
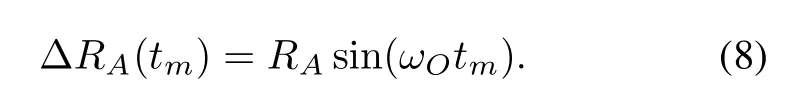
The distance between the rigid body A and the imaging center O satises:
Owing to ROO′≪ ROand RB≪ RO,the distance between the rotational scatter B and the imaging center O can be expressed as


Then,the received signal in a certain range bin can be written as the discrete form[16]:

where σBi,σRiare reection coefcients of the K rigid body points and P rotating points respectively,yBiand ARiare separately proportional to the position of the rigid body point O and the distance from the rotating point to the center of rotation O′,ωRiis the rotation rate of rotating point,m=0,...,M−1.
2.2Rigid body separation based on the L-statistics
According to the radar signal model listed above,the separation of rotational parts and rigid bodies can be achieved in[16].The method is based on different TF distributions of the constant frequency signals and the sinusoidally FM signals after appling STFT.The STFT of the signal s(i)is dened in discrete form as
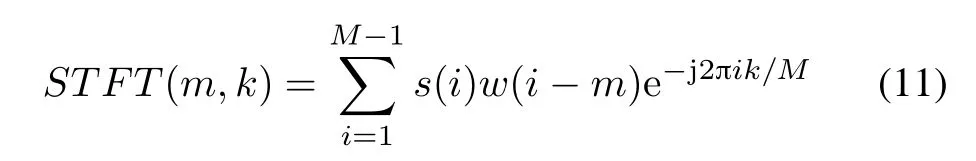
where w(i)is a window functionsuch as the Hanningwindow,which is used to truncate the considered signal with the width Mw.The FT of the signal s(i)can be obtained by summing all the STFT samples over time.This special property of STFT can be explained by the following expressions:
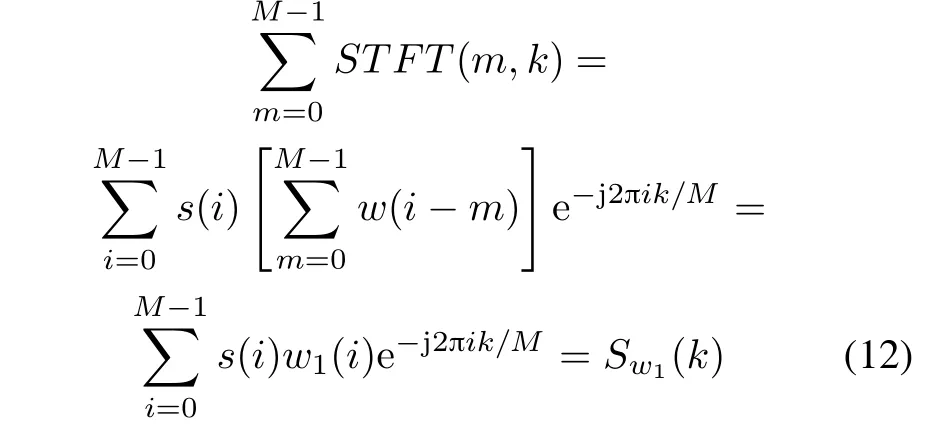
where w1(i)can be considered as a rectangular window, summing all the STFT samples of the signal s(i)can obtain FT of s(i).
With the property of STFT in the TF domain,the basic idea for separating the rigid body and the rotational bodies is sorting the absolute STFT values of the returned radar signal along the time axis.Because the rigid body remains the same frequency in the TF domain and the sinusoidally FM signal generated by m-D effects is highly non-stationary,the rotational parts can be removed by removing the highest absolute values at the bottom of the TF domain.Then we can obtain the FT of rigid bodies by summing the remaining STFT samples.
Consider a set of M elements of the STFT,for a certain frequency k:
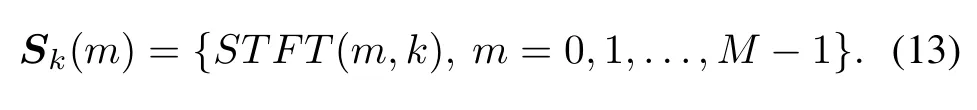
By the sorting procedure,we can get a new ordered set of elements ψk(m)∈ Sk(m),such as|ψk(0)|≤|ψk(1)|≤···≤|ψk(M −1)|.Summing all the STFT samples,we obtain
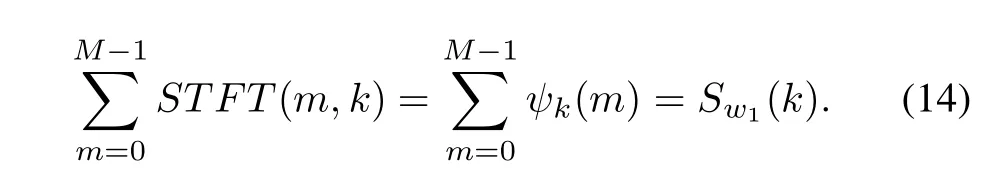
After removing the rotational parts of the sorted TF plane in each frequencyk,the L-statistics[17]form of this summation is presented as
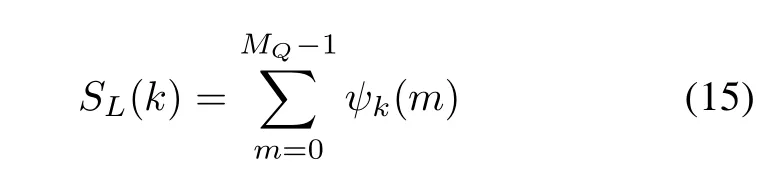
where MQ=int[M(1−Q/100)]and Q is the percent of removed values.
As proposed in both[16]and[17],basic procedures of the method of m-D parts removal based on the L-statistics are as follows:
Step 1Calculate STFT values of mixed signals.By STFT,the mixed signals are demonstrated in the TF domain.
Step 2At each frequency bin of the TF domain,sort the absolute values of STFT results.
Step 3Remove the sorting STFT results according to the constant threshold such as 50%of the highest value part of the TF domain or an adaptive threshold.
Step 4Obtain the rigid body by summing the remaining STFT results.
3.Parameter estimation for rigid bodies after m-D removal based on L-statistics
In order to explain the mechanism of parameter estimation for rigid bodies,rst we analyze the result of summing the STFT values over t.Consider s(t)=σ exp(jω0)as the returned signal of rigid bodies.The STFT of this signal yields


For any other Ω/=ω0,the integration
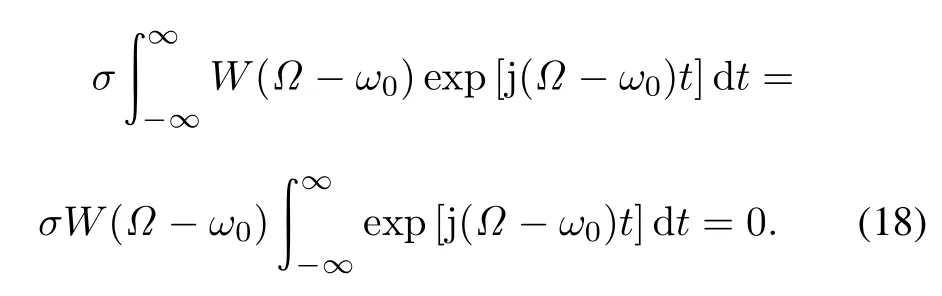
Therefore,all summaries of STFT samples for Ω/=ω0turn out to be zero.
However,just using the m-D removal based on L-statistics,some samples of the rigid body can be also removed.From(18),we can see that summaries of STFT samples with the missing values cannot be zero,then side lobes around the peaks of the rigid bodies may appear. In this paper,we propose parameter estimation cooperated with the method of rigid body separation based on L-statistics.After using m-D removal,the summary of remaining rigid body STFT samples peaks at k=k0with the value:

Because W(0)=const and we can know the value of W(0)andMQin advance,byobtainingthevalueof SL(k) at the peak k=k0,σ and ω0can also be estimated accuratelywith this methodso thatthe sidelobeproblemcanbe avoided.The proposed method mainly estimates two parameters σBiand yBiin(10).σBirepresents the scatter intensity of the ith rigid-body point and yBidetermines its position with respect to the imaging center O.
The proposed algorithm for ISAR imaging is implemented as follows and theowchart is presented in Fig.2.
Step 1For the echo signal in each range bin,calculate STFT values of mixedsignals.By STFT,the mixedsignals are demonstrated in the TF domain.
Step 2At each frequency bin of the TF domain,sort the absolute values of STFT results.
Step 3Remove the sorting STFT results according to the constant threshold such as 50%of the highest value part of the TF domain or an adaptive threshold in[16].
Step 4Obtain rigid bodies by summing the remaining STFT results.
Step 5Estimate all frequencies of i rigid bodies bynding peaks at ki0.Amplitudes can be estimated by the expression σi=SiL(k)/[W(0)MQ].As is discussed in[19],the length of the rigid body in the TF domain can be calculated as|l|≤1+2(M/MW−1).Here,MWis the length of the window and M/MW−1 can be considered as the number of the non-zero STFT samples on each side of the rigid body k=ki0.When k=k10,nd and remember the position of the rigid body and remove it by setting M/MW−1 samples on each side as zero.Repeat the same procedures when i=i+1.

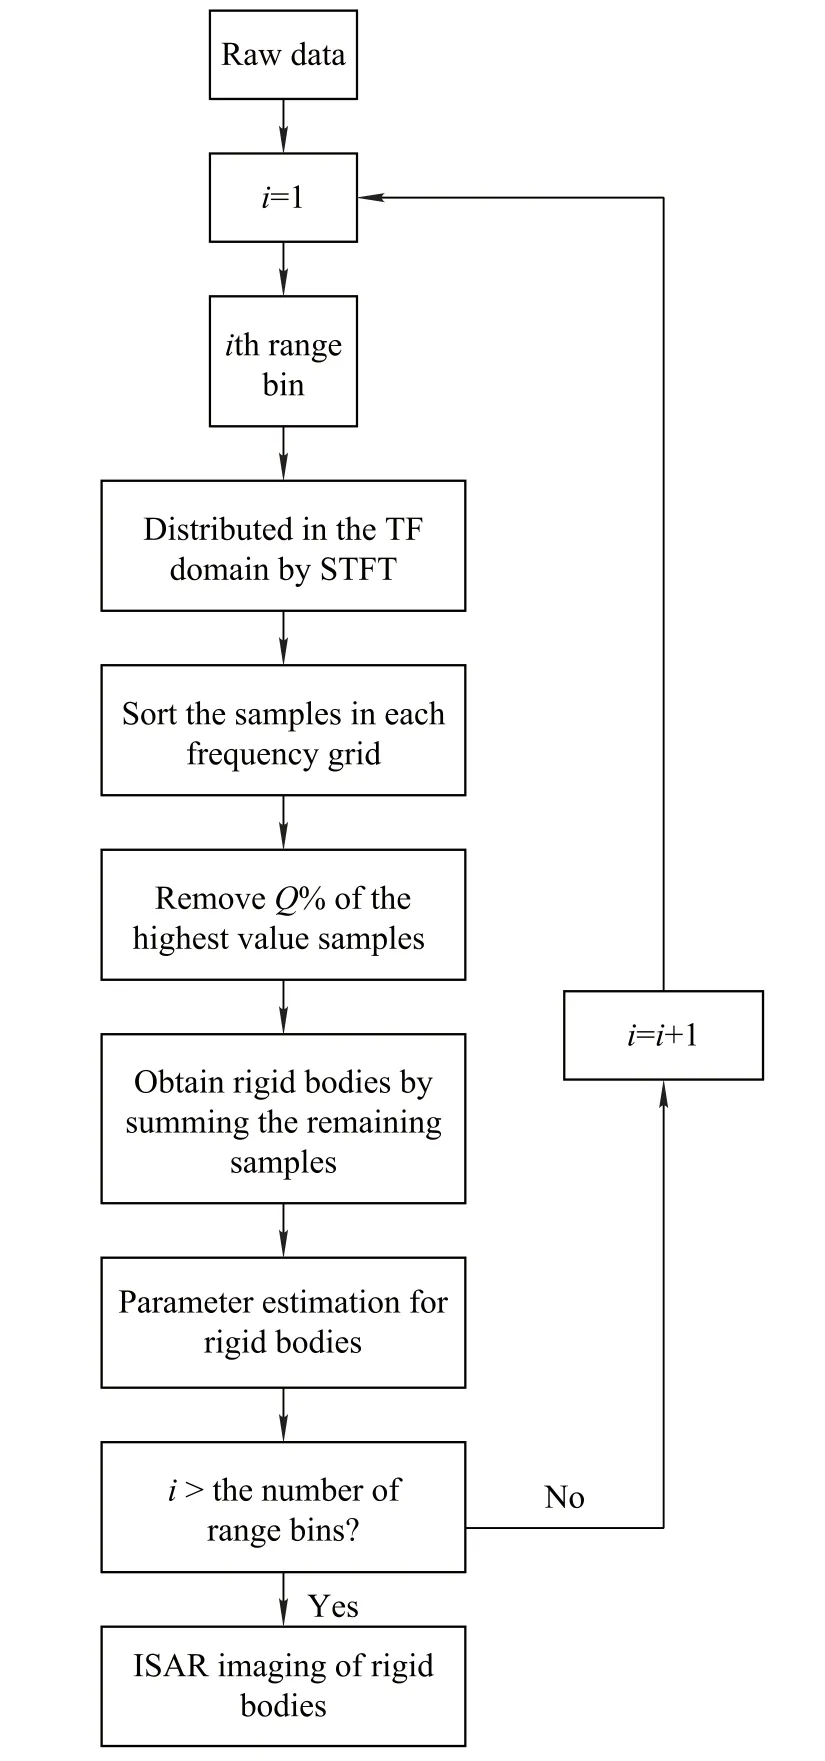
Fig.2 Flowchart for the proposed algorithm
4.Signal and ISAR image simulations
4.1Signal simulations
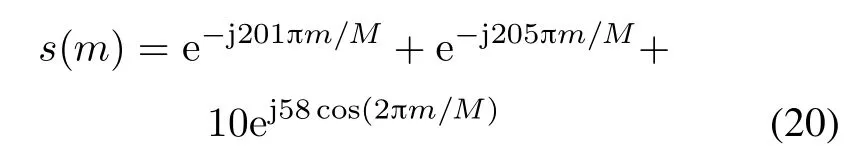
Example 1The radar received signal of one rigid body and a rotational point with the discrete form as
is proposed in this example.The STFT of the signal truncated by the Hanning window with the width Mw=M/8 shows that the frequencyof the rotational point varies over time in a wide range and the frequency of the rigid body remains the same in Fig.3(a).In Fig.3(b),the sorted absolutevalues ofSTFT samples in the TF domainindicatethat the sinusoidally FM signal is arranged at the bottom of the TF domain.By summing all the STFT samples,we can accurately obtain the original FT of signals in Fig.3(c).The remained STFT samples after the m-D removal of 50%of the highest STFT samples,are presented in Fig.3(d).We can see that a signicant part of the STFT samples of the rigid body is removed as well.The reconstructedFT of the rigidbodyobtainedby summingthe remainingSTFT samples over time is shown in Fig.3(e),which exists the side lobe problem closed to the rigid body.Fig.3(f)shows the result of the estimated rigid body by using the parameter estimation method.It can be clearly seen that the side lobe problem is avoided and the rigid body is accurately recovered.
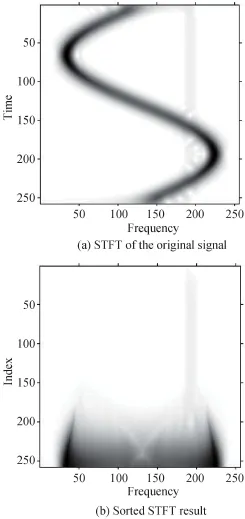
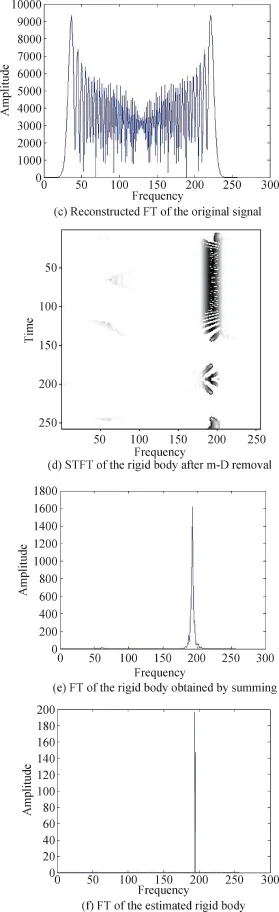
Fig.3 Radar received signal of one rigid body and one rotational point
Example 2In order to test the robustness of the proposed approach,we consider the same received radar signal as the previous example added white Gaussian noise with SNR=–6.53 dB.The STFT of the original signal and itsFTreconstructedbysummingallSTFTsamplesarepresented in Fig.4(a)and Fig.4(c),respectively.Sorted STFT samples of the TF domain are shown in Fig.4(b)and the remaining STFT samples of the rigid body after m-D removal are presented in Fig.4(d).FT of the rigid body with the m-D removal method is shown in Fig.4(e).With the methodof parameterestimation after the m-D removal,the rigid body is accurately estimated and robust to the noise in Fig.4(f).
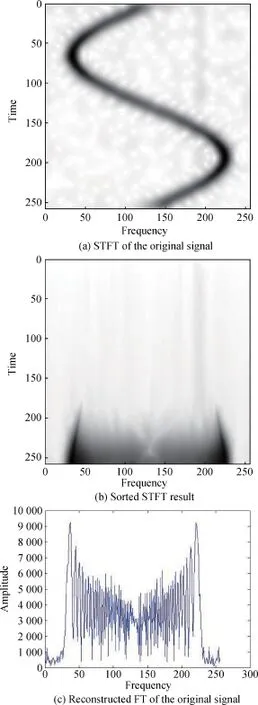

Fig.4 Radar received signal of one rigid body and one rotational point with noise
Example 3This example proposes the high resolution analysis of two close rigid bodies.Radar received signals induced by two close rigid bodies and a rotational point can be expressed as
where M=256 samples are presented.The width of the truncated window is set to Mw=M/4 which can insure the higher resolution of STFT of the rigid bodies.The STFT oftheanalyzedsignal is presentedin Fig.5(a),while the sorted STFT is presented in Fig.5(b).By summing all the STFT samples,we can accurately obtain the original FT of signals in Fig.5(c),while the two close rigid bodies cannot be clearly distinguished.By removing 50%of STFT samplesin the TF domain,the result is shownin Fig. 5(d).Summing the rest STFT samples,we can obtain two close rigid bodies which suffer from the side lobe problem in Fig.5(e).By the parameter estimating method,the two close rigid bodies are clearly distinguished to insure the high resolution in Fig.5(f).
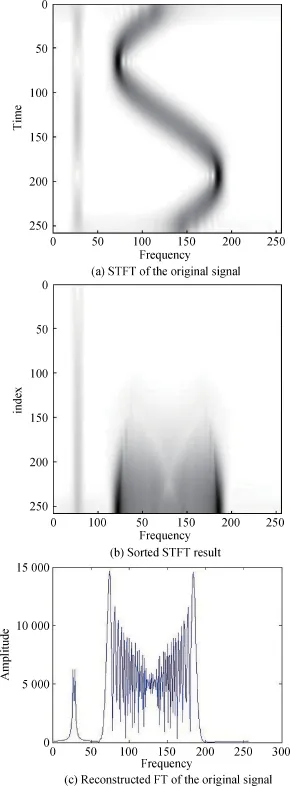

Fig.5 Radar received signal of two close rigid bodies and one rotational point
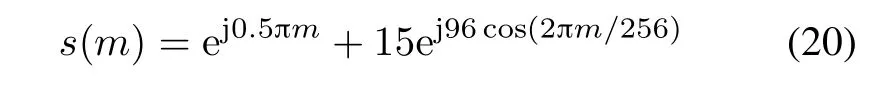
Example 4In this example,we test the proposedalgorithm on the signal with the form

Four signals of constant frequency model the rigid bodies and one sinusoidally FM signal models the rotational point with yBi=[1.7π,1.8π,1.9π,2π,2.1π]and Mw= M/4,for i=1,2,3,4,5.We also use the width set as Mw=M/4,since higher Mwproduces higher frequency concentration of the STFT.The STFT of the original signaland its FT reconstructedbysummingall STFT samples are presented in Fig.6(a)and Fig.6(c),respectively.The sorted STFT samples of the TF domain are shown in Fig. 6(b)and the remaining STFT samples of rigid bodies after m-D removal are presented in Fig.6(d).FT of the rigid bodieswith the m-D removalmethodis shown in Fig.6(e). We canclearlysee that this methodcandealwith thesignal which contains more than one rigid bodies.
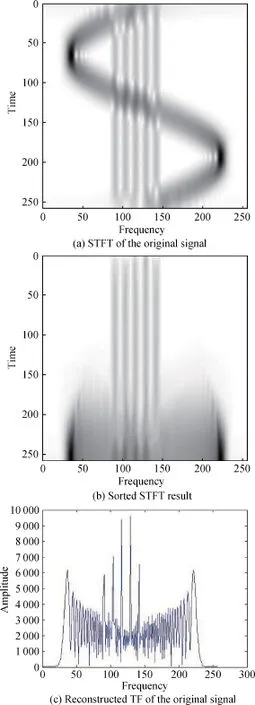

Fig.6 Radar received signal of fve rigid bodies and one rotational point
4.2ISAR imaging simulations
Example 5This example proposes a point-scatterer model to present the m-D characteristic of the target with rotating parts.The point-scattererrepresentation of the target is shown in Fig.7.Rigid body scatterers 2–5 rotate around the center 1 with the radius of 5 m and the angular speed is 0.1 rad/s.The rotational parts scatterer 6 rotates around the nonrotating scatterer 1 with a radius of 0.1 m and the rotational rate is 2 Hz.The radar center frequency is 10 GHz,the bandwidth is 400 MHz,the time width of the chirp pulse is 25.6 μ s,and the pulse repetition frequency(PRF)is 400 Hz.We choose 512 range samples and 512 echoes during the imaging time.
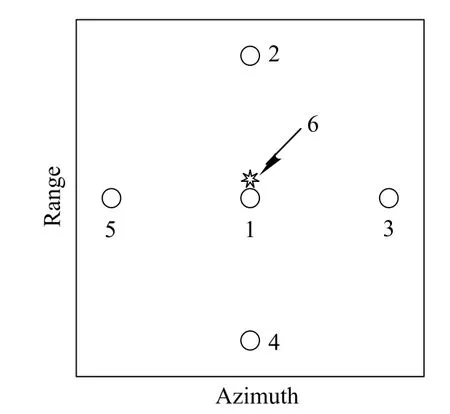
Fig.7 Point-scatterer model of the target
Fig.8(a)shows that using the traditional range Doppler (RD)algorithm,the ISAR imaging quality and readability of the targetwith the rotationalpartare severelydecreased. From,rigid bodies cannot be accurately detected because they are covered by the m-D.With the proposed method, we remove the rotational part and accurately estimate rigid bodies to obtain a high quality ISAR image in Fig.8(b).

Fig.8 ISAR imaging of point-scatterer with rotational part
Example 6In this example,we propose the same method applied in a plane model with two fast rotational parts.The radar center frequency is 5.52 GHz,the bandwidth is 400 MHz,the time width of chirp pulse is 25.6 μ s, and the PRF is 400 Hz.We choose 256 range samples and 256 echoes during the imaging time.Fig.9 indicates the ISAR imaging using the RD algorithm,the m-D extraction algorithm and the proposed algorithm.
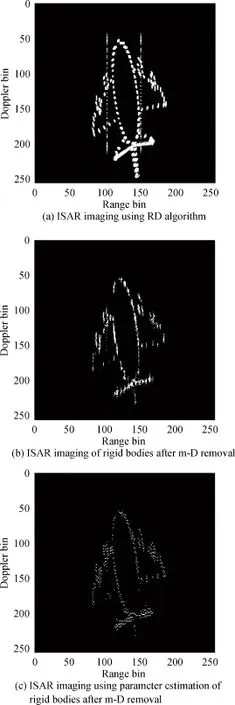
Fig.9 ISAR imaging of plane-scatterer with two rotational parts
From the results comparing as follows,it can be seen that rigid bodies in Fig.9(c)are clearly distinguished. However,by just the m-D removal method in Fig.9(b), smearing effects of rigid bodies caused by side lobes inuence the imaging quality.
5.Conclusions
The m-D effects induced by fast rotational parts produce high interference in ISAR imaging.The m-D can severely decrease the quality and readability of the obtained ISAR image because of the sinusoidally FM signals in radar received signals.The method based on L-statistics is an efcient algorithm to remove the rotational parts and reconstruct the FT of rigid bodies.With the basis of m-D removal,this paper proposes the parameter estimation of the rigid body to avoid side lobe problem owing to missing rigid body data during the procedure of m-D removal.The results for signal and ISAR image simulations verify the effectiveness and robustness of the proposed algorithm.
[1]V.C.Chen,F.Li,S.-S.Ho,et al.Analysis of micro-Doppler signatures.IEE Radar,Sonar and Navigation,2003,150(4): 271–276.
[2]V.C.Chen.Micro-Doppler effect in radar: Part I:phenomenon,physics,mathematics,and simulation study.IEEE Trans.on Aerospace and Electronic Systems,2006,42(1):2–21.
[3]X.Bai,F.Zhou,M.Xing.High resolution ISAR imaging of targets with rotating parts.IEEE Trans.on Aerospace and Electronic Systems,2011,47(4):2530–2543.
[4]F.Totir,E.Radoi.Superresolution algorithms for spatial extended scattering centers.Digital Signal Processing,2009, 19(5):780–792.
[5]M.Martorella.Novel approach for ISAR image cross-range scaling.IEEE Trans.on Aerospace and Electronic Systems, 2008,44(1):281–294.
[6]M.Martorella,F.Berizzi.Time windowing for highly focused ISAR image reconstruction.IEEE Trans.on Aerospace and Electronic Systems,2007,41(3):992–1007.
[7]H.Gao,L.Xie,S.Wen,et al.Micro-Doppler signature extraction from ballistic target with micro-motions.IEEE Trans.on Aerospace and Electronic Systems,2010,46(4):1969–1982.
[8]Q.Zhang,T.S.Yeo,H.S.Tan,et al.Imaging of a moving target with rotating parts based on the Hough transform.IEEE Trans.on Geoscience and Remote Sensing,2008,46(1):291–299.
[9]J.Li,H.Ling.Application of adaptive chirplet representation for ISAR feature extraction from targets with rotating parts. IEE Radar,Sonar and Navigation,2003,150(4):284–291.
[10]T.Thayaparan,S.Abrol,E.Riseborough,et al.Analysis of radar micro-Doppler signatures from experimental helicopter and human data.IEERadar,Sonar and Navigation,2007,1(4): 288–299.
[11]T.Thayaparan,P.Suresh,S.Qian.Micro-Doppler analysis of rotating target in SAR.IET Signal Processing,2010,4(3): 245–255.
[12]B.Lyonnet,C.Ioana,M.G.Amin.Human gait classication using micro-Doppler time-frequency signal representa-tions.Proc.of the IEEE Radar Conference,2010:915–919.
[13]C.Cai,W.Liu,J.S.Fu,et al.Empirical mode decomposition of micro-Doppler signature.Proc.of International Radar Conference,2005:895–899.
[14]X.Bai,M.Xing,F.Zhou,et al.Imaging of micromotion targets with rotating parts based on empirical-mode decomposition.IEEE Trans.on Geoscience and Remote Sensing,2008, 46(11):3514–3523.
[15]B.Yuan,Z.Chen,S.Xu.Micro-Doppler analysis and separation based on complex local mean decomposition for aircraft with fast-rotating parts in ISAR imaging.IEEE Trans.on Geoscience and Remote Sensing,2014,52(2):1285–1298.
[16]L.Stankovic’,T.Thayaparan,M.Dakovic’,et al.Micro-Doppler removal inthe radar imaginganalysis.IEEE Trans.on Aerospace and Electronic Systems,2013,49(2):1234–1250.
[17]I.Djurovic’,L.Stankovic’,J.F.Bohme.Robust L-estimation based forms of signal transforms and time-frequency representations:IEEE Trans.on Signal Processing,2003,51(7): 1753–1761.
[18]L.Stankovic’,S.Stankovic’,M.Amin.Missing samples analysis in signals for applications to L-estimation and compressive sensing.Signal Processing,2014,94:401–408.
[19]L.Stankovic’,V.P.Bugarin,F.Radenovic.Genetic algorithm for rigid body reconstruction after micro-doppler removal in the radar imaging analysis.Signal Processing,2013,93(7): 1921–1932.
[20]A.Mitra,D.Kundu.Genetic algorithms based robust frequency estimation of sinusoidal signals with stationary errors. Engineering Applicationof Artifcial Intelligence,2010,23(3): 321–330.
[21]E.Lutton,P.Matrinez.A genetic algorithm for the detection of 2D geometric primitives in images.Proc.of the 12th International Conference on Pattern Recognition,1994:526–528.
[22]K.S.Tang,K.F.Man,S.Kwong,et al.Genetic algorithms and their applications.IEEE Signal Processing Magazine,1996, 13(6):22–37.
Biographies

Yong Wang was born in 1979.He received his B.S.degree and M.S.degree in electronic engineering from Harbin Institute of Technology in 2002 and 2004,respectively.He received his Ph.D. degree in information and communication engineering from Harbin Institute of Technology in 2008.Currently,he is a professor in Harbin Institute of Technology.He has published more than 40 papers.His main research interests are time frequency analysis of nonstationary signal,radar signal processing and their application in synthetic aperture radar imaging.
E-mail:wangyong6012@hit.edu.cn

Jian Kang was born in 1991.He received his B.S. degree from Harbin Institute of Technology in 2013. He is now pursuing his M.E.degree in electronic engineering with Harbin Institute of Technology. His current research interests include ISAR imaging,time-frequency signal analysis,parameter estimation and micro-Doppler analysis.
E-mail:kangjiankarl@163.com
10.1109/JSEE.2015.00053
Manuscript received March 26,2014.
*Corresponding author.
This work was supported by the National Natural Science Foundation of China(61471149),the Program for New Century Excellent Talents in University(NCET-12-0149),the National Science Foundation for Postdoctoral Scientists of China(2013M540292),the postdoctoral scienceresearch developmental foundation of Heilongjiang province(LBHQ11092),and the Heilongjiang Postdoctoral Specialized Research Fund.
杂志排行

Journal of Systems Engineering and Electronics的其它文章
- Multi-channel differencing adaptive noise cancellation with multi-kernel method
- Combined algorithm of acquisition and anti-jamming based on SFT
- Modied sequential importance resamplinglter
- Immune particle swarm optimization of linear frequency modulation in acoustic communication
- Antenna geometry strategy with prior information for direction-nding MIMO radars
- Modied Omega-K algorithm for processing helicopter-borne frequency modulated continuous waveform rotating synthetic aperture radar data