Applications of Smart Grid Big Data Analytics
2015-03-11GAOFengLIUGuangyiSAUNDERSChrisZHUWendongTANChinwooYUYang
GAO Feng , LIU Guangyi , SAUNDERS Chris ,ZHU Wendong , TAN Chin-woo , YU Yang
(1.Smart Grid Research Institute North America Inc., Santa Clara, CA 95054;2. China Electric Power Research Institute, Beijing 100192, China; 3. Stanford University,Palo Alto 94305)
Applications of Smart Grid Big Data Analytics
GAO Feng1, LIU Guangyi2, SAUNDERS Chris1,ZHU Wendong1, TAN Chin-woo3, YU Yang3
(1.Smart Grid Research Institute North America Inc., Santa Clara, CA 95054;2. China Electric Power Research Institute, Beijing 100192, China; 3. Stanford University,Palo Alto 94305)
With the rapid progress in information technology, a novel concept—“Energy Internet”, that concentrates on the coordination and optimization of multi-type energy flows via advanced communication and internet technology, has received a lot of attention. The result of such an inevitable trend is that a fundamental technique—Big Data Analytics—must be developed to handle massive influx of data from multiple heterogeneous sources, as well as utilize the data to swiftly derive an economic value. The paper gives an overview on research works conducted at SGRI North America big data lab with highlights on hardware configuration and software deployment of the cluster environment. The paper reviews several ongoing research topics performed in the lab with an emphasis on customer segmentation and response targeting (collaboration with Stanford University); and energy disaggregation. These works are built on an integrated power system data model that is supported by open source technology. Preliminary results show that our research will benefit both utility companies and customers.
Big Data Analytics; mixed-integer programming; customer segmentation and targeting; energy disaggregation
0 Introduction
With the rapid progress in information technology, a novel concept-“Energy Internet”, that extends “Smart Grid” to concentrate on the coordination and optimization of multi-type energy flows via advanced communication and Internet technology, has received a lot of attention. The deployment of a massive amount of distributed, intelligent, cost-effective sensors, controllers, meters, and processors within the value chain of energy system forms the foundation for “Energy Internet”. The result of such an inevitable trend is that a fundamental technique must be developed that can handle massive influx of data from multiple heterogeneous sources, as well as utilize the data to swiftly derive an economical value. Big data analytics, as a process of examining large data sets containing a variety of data types to uncover hidden patterns, unknown correlations, market trends, customer preferences and other useful business information, has consequently increased its popularity.[1]
The utility industry is facing unprecedented challenges caused by extremely high volume and high frequency measurement data. According to the Navigant Research Report, the estimated installed base of smart meters worldwide will surpass 1.1 billion by 2022.[2]Advanced Metering Infrastructure (AMI) typically collects electricity usage data in the range of 15 minutes to 1 hour. This is up to a three thousand fold increase in the amount of data utilities would have processed in the past.[3]Meanwhile, synchrophasor is being deployed around the global that collects a large volume of low-latency, real-time streaming measurement data. Phasor Measure Unit (PMU) can measure AC waveforms (voltages and currents) typically at a rate of 48 samples per cycle (2 880 samples per second for 60 Hz systems)[4]. Just one Phasor Data Concentrator (PDC) collecting data from 100 PMUs of 20 measurements each at 30 Hz sampling rate generates over 50 GB of data one day.[5]
Big data analytics provides a suite of techniques for the utility industry that are deemed to resolve these challenges. The in-memory calculation engine and parallel computing framework, Hadoop/MapReduce and Spark, are ready for handling an extremely large scale of dataset; on the other hand, the stream processing engine, Storm, Streams, and Spark Streaming, are built to analyze data in motion and act on information as it is happening.
Consequently, big data analytics could be applied to improve both power system short-term operations and long-term planning processes. The promising applications for big data analytics include detection of energy theft, strategic adoption for electric vehicle and rooftop solar integration, fine granularity load forecast and renewable generation forecast, distribution system topology identification, online asset risk assessment, distribution system voltage and var optimization, customer segmentation & targeting, and revenue protection etc.[3]
The paper gives an overview on research works conducted in SGRI North America big data lab with highlights on hardware configuration and software deployment of the cluster environment. The paper reviews several ongoing research topics performed in the lab, for example: a conceptual design of data structure and computing architecture for smart grid, customer segmentation and response targeting (collaboration with Stanford University), and energy disaggregation. These works are built on an integrated power system data model that is supported by open source technology. Preliminary results show that our research will benefit both utility companies and customers.
1 Big Data Laboratory for Power Application
The SGRI North America big data lab was funded by SGRI North America Inc., and the construction will be finished by the end of 2015. The lab will serve as an integrated development environment and testing bed for data integration, data management and advanced optimization, data mining, and data analytics. The lab is composed of Hadoop cluster environment, data extract/transform/load platform, data mining & exploration platform, and data analysis platform, with two hundred terabyte initial processing power and extensible capacity.
The lab is equipped with fourteen high performance computing facilities and state-of-the-art apache Hadoop packages. Fig. 1 gives an overview of system architecture for the lab. Specific hardware and software configurations are shown as below:
·The lab is equipped with eight 4-U 4-Socket servers, six 2-U 2-Socket servers, and one 2600T storage server.
·The lab intranet consists of one 10 G switch, two 1 G switches, and one fiber switch. Firewall and wireless access point technology are deployed to assure cyber security.
·The lab deploys enterprise-grade big data platform—BigInsights/Open Data Platform. The platform integrates Apache open source components: Hadoop/MapReduce, Yarn, Spark, Hive, HBase, and big data analysis tools: BigSQL, BigSheet, and Text Analytics.
·The lab deploys real-time big data analytic tool— Streams, to provide integration and analysis services for streaming data.
·The lab deploys large-scale optimization and decision analysis package-ILOG CPLEX to address multi-dimensional optimization, decision, pricing and resource allocation problems for “Energy Internet”.
·The lab deploys business intelligence package to serve as an integrated environment for managing structural data and performing multi-dimensional analysis.
·The lab deploys open source programming language R that provides a complete set of data processing, statistical analysis, computation, and visualization tools.
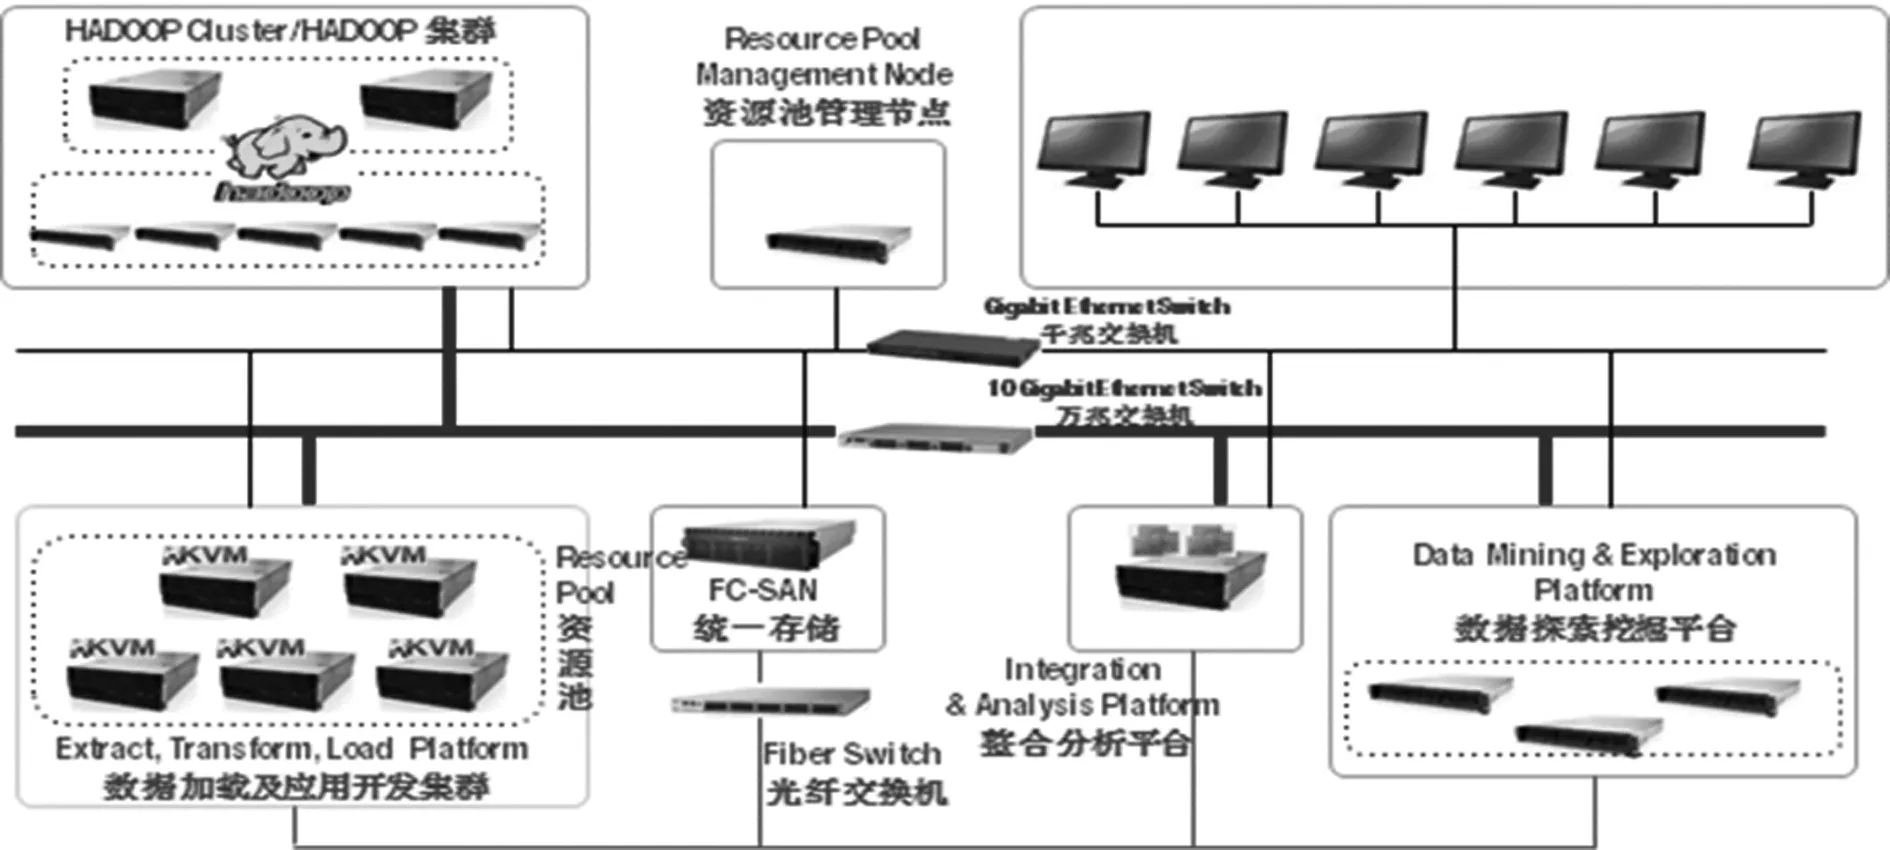
图1 大数据实验室系统架构Fig.1 System architecture for big data lab
In the lab, the research and development works are performed on an end-to-end platform for addressing the needs of the future “Smart Grid” and “Energy Internet”. A holistic solution including data processing, storage, analytics, and visualization technologies used in this lab enable rapid insights and informed decision making for meeting the business demands of a power system where distributed renewable generation, continuous metering and system monitoring, and frequent customer interaction are a reality. Fig. 2 illustrates software packages and workflow deployed in big data lab.
2 Demonstration of Research Works
2.1 Conceptual Design for Hierarchic Smart Grid Big Data Analytics Platform
The lack of a unified data model blocks the efficient data integration and module deployment for smart grid big data analytics platform. Our research teases out five rules and three criteria (shown in Fig. 3) for building a platform designed to comprehensively enable resilient features of smart grid big data.[6]
We propose a conceptual framework to enable situational awareness and control capabilities within a smart grid, by establishing a unified structural hierarchy which simultaneously yields an organizational pattern for the storage, processing, analytics, and control of a smart grid.[7]
·Comprehensive: store, process and communicate all available information and integrate all available tools and interfaces.
·Adaptive and dynamic: adaptively organized, dynamically innovated, and function-based structured to support all kinds of process and analytics.
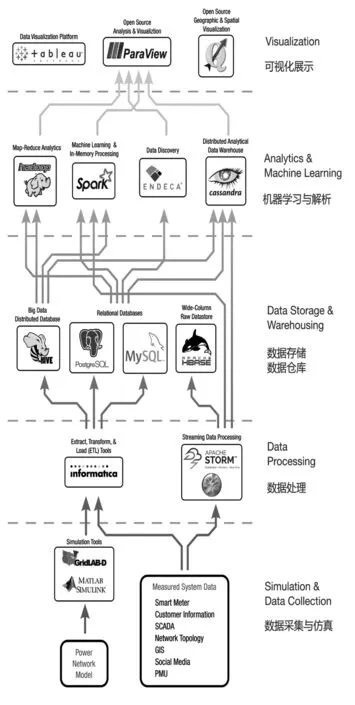
图2 大数据实验室软件配置与流程图Fig.2 Software packages and workflow for big data lab
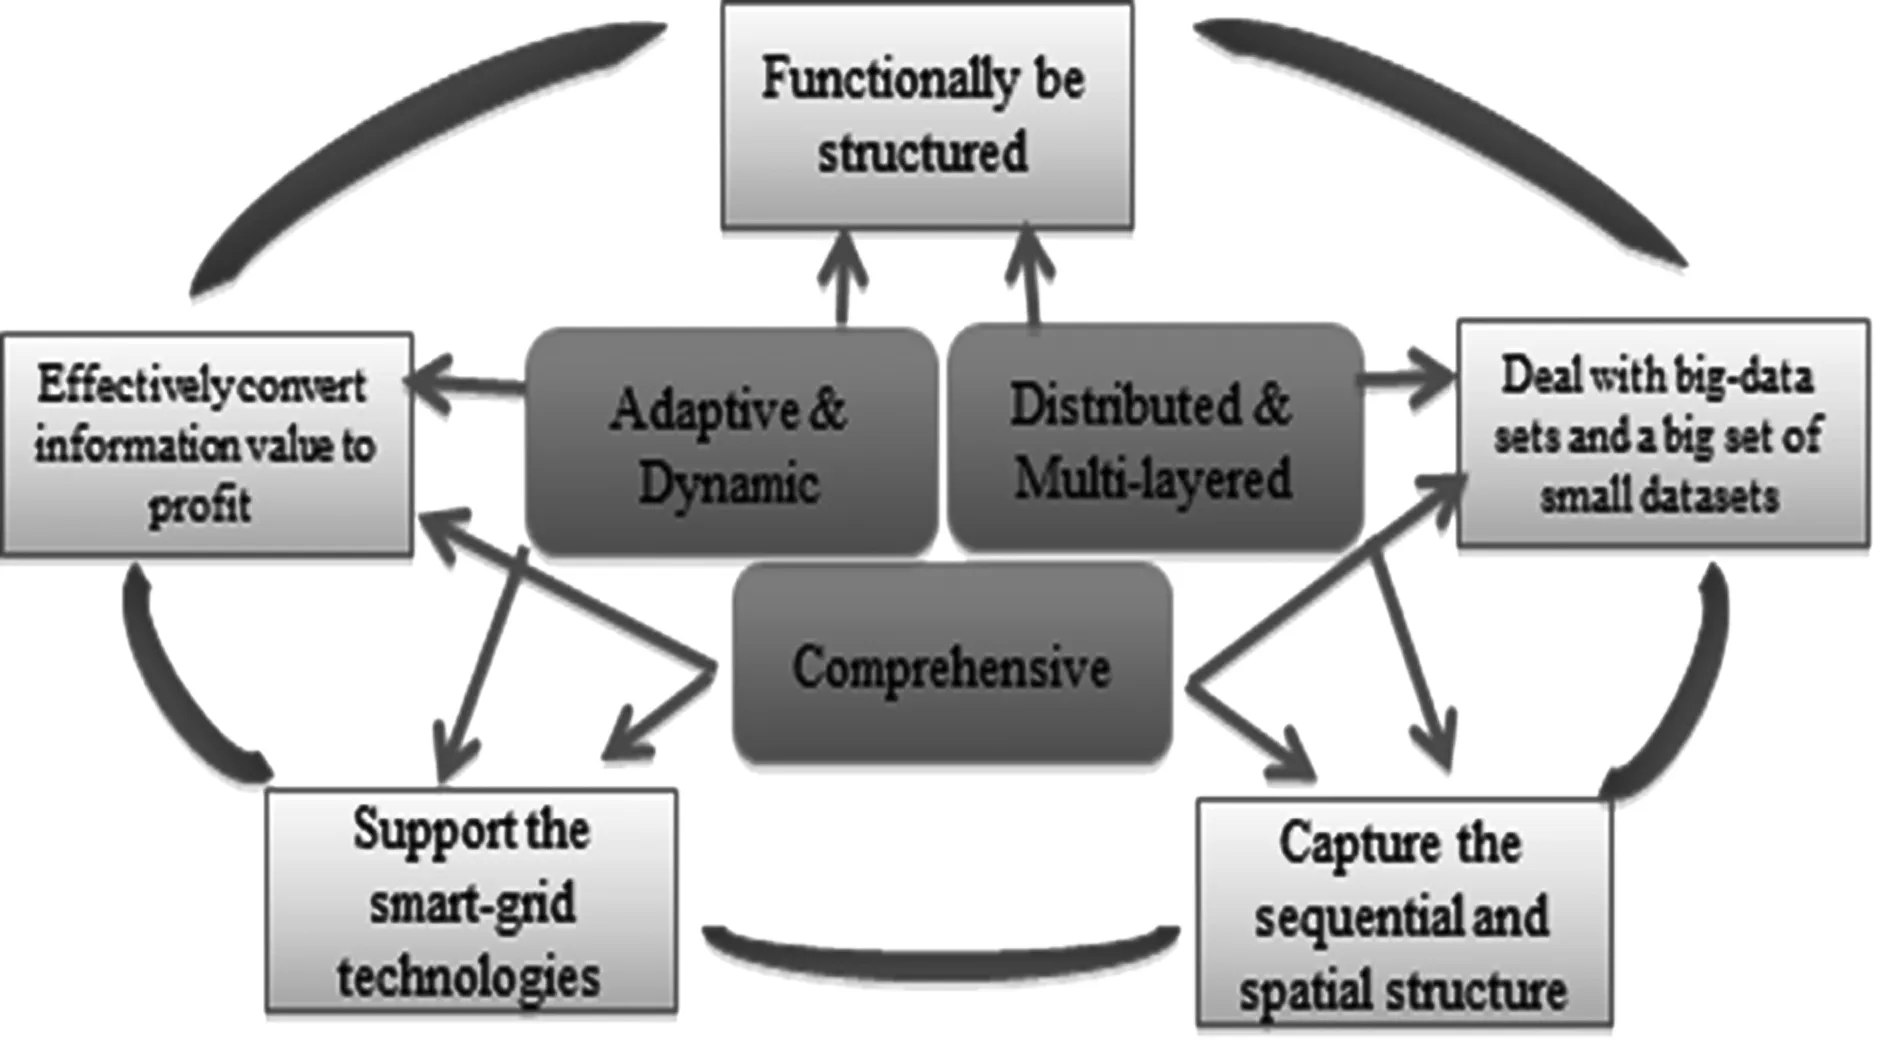
图3 智能电网大数据平台建设标准Fig.3 Rules and criteria for smart grid big data platform
·Distributed and multi-layered: multi-layered and each component are equipped with an intelligent “brain”. Only necessary data and information are communicated in-between.
We propose a Spark Streaming-based Real-Time Complex Event Processing framework for the smart grid (shown in Fig. 4). A number of commercial and open source events processing software are available for building complex event processing applications. Apache Spark is a fast and general engine for large-scale data processing[8]. It is a unified platform combining Spark SQL, Spark Streaming, and ML-Lib for machine learning and GraphX. Spark now boasts the ability to not only process streams of data at scale, but to “query” that data at scale using SQL-like syntax.[9]

图4 复杂事件处理架构Fig.4 Complex event processing system architecture
2.2 Customer Segmentation and Response Targeting (Collaboration with Stanford University)
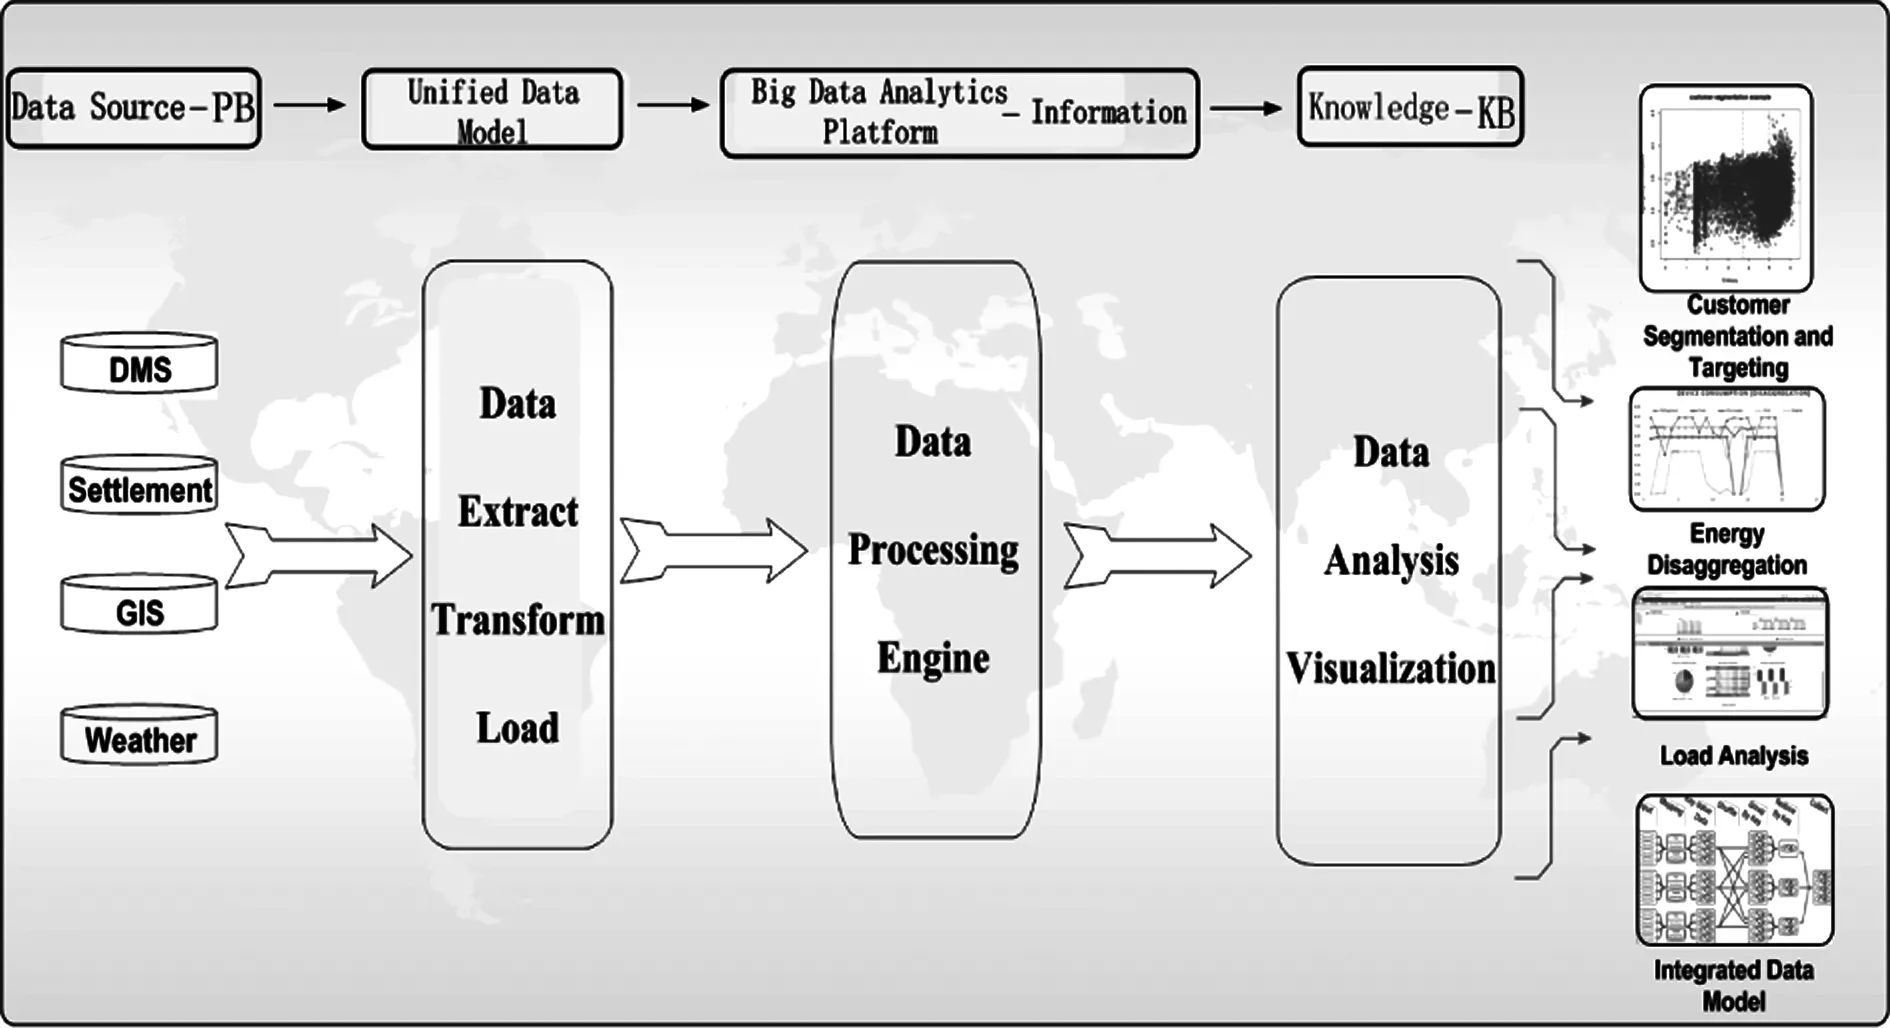
图5 大数据解析应用流程图Fig.5 Advanced big data analytics workflow for power application
We design a workflow for potential Big Data Applications that include segmentation, targeting, and disaggregation etc. (shown in Fig. 5). Segmentation based on consumption behavior benefits both utilities and customers. The primary benefit for utilities is to achieve higher returns in demand response programs as well as equipping decision makers with information to advance resource allocation, pricing, and program development. Segmentation also provides time of day consumption, daily usage pattern stability over time, as well as actual volume of energy use that would potentially drive customers to improve home energy efficiency.
Traditional segmentation method is based on customer self-report and survey data, without leveraging real electricity consumption measurement. The widespread deployment of smart meters creates opportunities for segmentation strategies based on 15 min, 30 min or hourly household energy use. Collaborating with Stanford University, we integrate segmentation package with commercial database and implement a novel browser-server based analysis platform. The segmentation method is called adaptiveK-means with a customized threshold to construct a shape dictionary[10]. The algorithm starts by a set of initialized cluster centers utilizing a standardK-means algorithm, with an initialK=k0. AdaptiveK-means then adds additional cluster centers, whenever a load shapes(t) in the dataset violates the mean squared error threshold condition as shown in (1):
(1)
where:
s(t):loadshape;
Ci*(t)(t):representativeloadshape;
θ:clusterthreshold.
Thestepsofthealgorithmarehighlightedasbelow.Thedetailedexplanationisinreference[10].
·Calculatingdailytotalconsumptioncharacterizationanditsprobabilitydistribution;
·Encodingsystembasedonapre-processedloadshapedictionary;
·ApplyingadaptiveK-means on normalized data;
·Performing hierarchical clustering.
The drive towards more green energy has enabled signicant growth of renewable generation. Demand response (DR) has become an efficient practice to address the intermittence issues caused by deep penetration of renewable generation. It becomes important to be able to target the right customers among a large population to keep DR enrollment cost low. The availability of high resolution smart meter information can signicantly reshape such a targeting schema.
We collaborate with Stanford University and integrate targeting package into the analysis platform. Since an enrollment decision is made in advance of the actual consumption period, only a prediction of the DR potential is available. The prediction can be estimated by analyzing the historical high resolution consumption data for each customer. Given a prediction of DR potential being a random variable, the targeting package chooses sufficient number of customers to balance the magnitude of demand response potential, and the uncertainty in the prediction.[11]
Assume the utility desires to enroll up toNcustomers from a population ofKindividuals, aiming to achieve at leastTkWh of energy savings with high probability. The targeting problem can be stated as:
The goal is to maximize the likelihood of saving at leastTkWh, given that we are limited to selecting at mostNcustomers amongKcandidates. In general, this is a stochastic knapsack formation and belongs to the family ofNP-hard problems.
(2)
where:
rk:energysavingresponseofcustomerk;
xk:decisionvariableforselectionofcustomerk.
We re-visit the problem from a different angle. Assume that the utility desires to achieve at leastTkWh of energy savings with probabilityP0, aiming to enroll the least number of consumers to keep the cost low.
We figure out a schema to transform the problem into a deterministic formulation with its relaxation being a Second Order Conic Programming (SOCP), a special case of Convex Programming. In this case, the problem becomes a little easier to conquer. Several commercial and academic optimization packages would provide SOCP solvers, for example: CPLEX and GUROBI etc.

(3)
where:
rk:energysavingresponseofcustomerk;
xk:decisionvariableforselectionofcustomerk;

Σ:covariancematrixofenergysavingresponse;
P0:probabilitythresholdoftargetingproblem;
Φ:cumulativedistributionfunctionofstandardnormaldistribution.
2.3EnergyDisaggregation
Segmentationandtargetingaretypicallybasedonhouseholdaggregateconsumptiondata.However,energydisaggregation,alsoknownasnonintrusiveloadmonitoring(NILM),isthetaskofseparatingaggregatedataforacustomerintotheenergydataforindividualappliances.Studieshaveshownthatsimplyprovidingdisaggregateddatatotheconsumerimprovesenergyconsumptionbehavior.[12]
Energydisaggregationhasbeenstudiedmorethan30years.Theliteraturecanbeclassifiedintotwomainareas:supervisedandunsupervisedmethods.Superviseddisaggregationmethodsrequireadisaggregateddatasetfortraining.Unsupervisedmethodsdonotrequireadisaggregateddatasettobecollected.However,theydorequirehandtuningofparameters.Theexistingsupervisedmethodsincludesparsecoding[ 1 3],changedetectionandclusteringbasedapproaches[14-15]andpatternrecognition[ 16].TheexistingunsupervisedmethodsincludefactorialhiddenMarkovmodels,differenceMarkovmodelsandvariantsandtemporalmotifmining.Weproposeasupervisedmethodbuiltonamixed-integerprogramming(MIP)formulationthatcanachievehighperformancewithstate-of-the-artbranch-and-cutalgorithm.
Typically,powerconsumptionforaparticularappliancecanbemodelledasmonotonicnon-decreasingcurvewithrespecttoitscontrolinputsthatcouldbeeithercontinuousordiscrete.Forexample,stoveorheatertypicallycanoperateatcontinuestemperaturesettings;andwasherordryercanoperateatdiscreteloadinglevels.Fig. 6illustratesanexemplarconsumptioncurveforanappliancewithrespecttoitscontrolinputs.Apiecewiselinearcurveisusedtoapproximatetheconsumptioncharacteristics.
WeproposeaMIPmodeltooptimizetheconsumptionerrorresidualsoverthetimehorizon.Meanwhile,eachapplianceisconstrainedbyitscharacteristics.Additionally,wecanmodelmore“logic”constraintsfordevices,forexample,typicallyitisnottruetoturnonorturnoffastoveorheateratahighfrequentrate.Thedeviceswouldratherstayat“on”or“off”statusduringapre-definedtimeperiodinreality.Theseadditional“logic”constraintscanbeeasilyimplementedwithinaMIPmodel.

图6 设备用电特性曲线Fig.6 An example of device consumption curve
The objective function of the MIP model is to minimize error residues for the power consumption over the time. Equation (4) describes device’s power consumption must be within high and low limits. Equation (5)~(7) are an “efficient” implementation for “logic” requirement that device has to stay at the same state for a certain time period after switching status. These constraints define the most compact relaxation area called “Convex Hull” for a MIP model that will speed up the overall performance. Fig. 7 illustrates several different MIP formulationsv.s. Convex Hull formulation. More discussion on efficient formulation for MIP model can be found in reference.[17]Equation (8) defines devicei’s power consumption characteristics.

图7 优化约束的Convex Hull模型Fig.7 Alternative formulation and convex gull in MIP min ‖Y·1-E‖1,2,
s.t.
(4)
(5)
(6)
vti≥uti-u(t-1),i
(7)
yti=Ci(xti)
(8)
wheredecisionvariables:
xti:devicei’s control input at timet;
uti:devicei’s status at timet, 1: on, 0: off;
vti:devicei’s start-up status at timet, 1: turn on att;
yti:devicei’s control output at timet,i.e. consumption att;
Y:aT-by-Imatrix of device control output variables;
parameters:


oni:devicei’s minimum stay-on time;
offi:devicei’s minimum stay-off time;
T:number of time intervals under study;
I: number of devices;
E:aT-by-1 vector of power measurement input;
1:aI-by-1 vector with all elements equal to 1;
functions:
Ci:devicei’s power consumption characteristics with respect to control inputs.
3 Numerical Examples
We now illustrate some selected numerical examples for the applications of customer segmentation, targeting and energy disaggregation at SGRI North America big data lab. All numerical examples are running on a computer with 8 G RAM and Intel Dual Core CPU @ 2.40 GHz.
3.1 Customer Segmentation
We create about six million records for customer meter data by Gridlab-D simulation tool and store them into Oracle and PostgreSQL database. Our software platform built on browser-server architecture is developed by R-shiny that is an open source tool. R script is fully supported as a complete set of data processing, statistical analysis, computation, and visualization tools.
Fig.8 shows multidimensional segmentation results based on smart meter data. We describe customers by two aspects: quantity and variability. The left graph uses Entropy and logarithm of average daily consumption. The right graph adds one more dimensionality that is maximum daily consumption. As shown in both graphs, those households with heavy and stable consumption behaviors would become good candidates for demand response during peak days.

图8 用户分类分组示意图Fig.8 Multidimensional customers segmentation examples
We are performing more business intelligence analysis based on meter data. Fig. 9 shows the software would select top usage customers based on minimum and maximum daily consumption criteria set by uses.
Fig. 10 shows the most popular load shapes in the sample data. This is again based on adaptiveK-mean clustering algorithm. The top rated shape (56%) is of twin-peak: morning peak and evening peak, which are typically caused by more activities occurring during the time in a household.
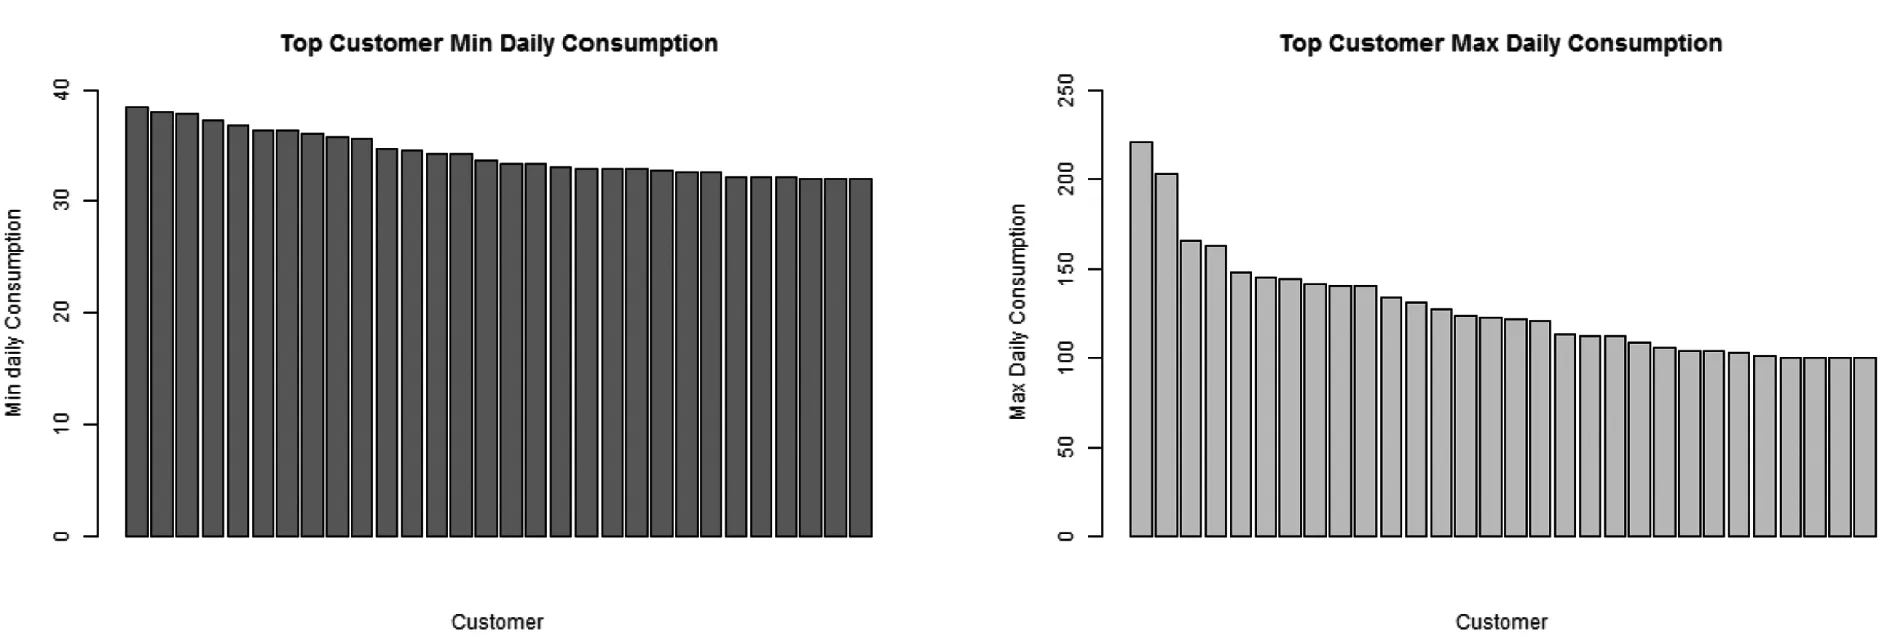
图9 用户最小最大日用电量Fig.9 Customer sorted by minimum and maximum daily consumption

图10 典型负荷曲线示意图Fig.10 Top 9 typical load shapes
3.2 Customer Targeting
Fig. 11 draws several plots to illustrate customer targeting results. The left shows a graph of “ReliabilityvsNumber of Selected Customers” given target energy saving equal to 100 kWh. The right one shows a graph of “ReliabilityvsAvailable Demand Response Energy” given the number of customers to recruit equal to 200. Based on the same principle, one can draw a plot of “Available Demand Response EnergyvsNumber of Selected Customers” given a reliability level.
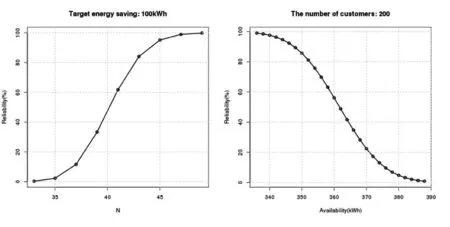
图11 定量需求响应示意图Fig.11 Response targeting examples
3.3 Energy Disaggregation
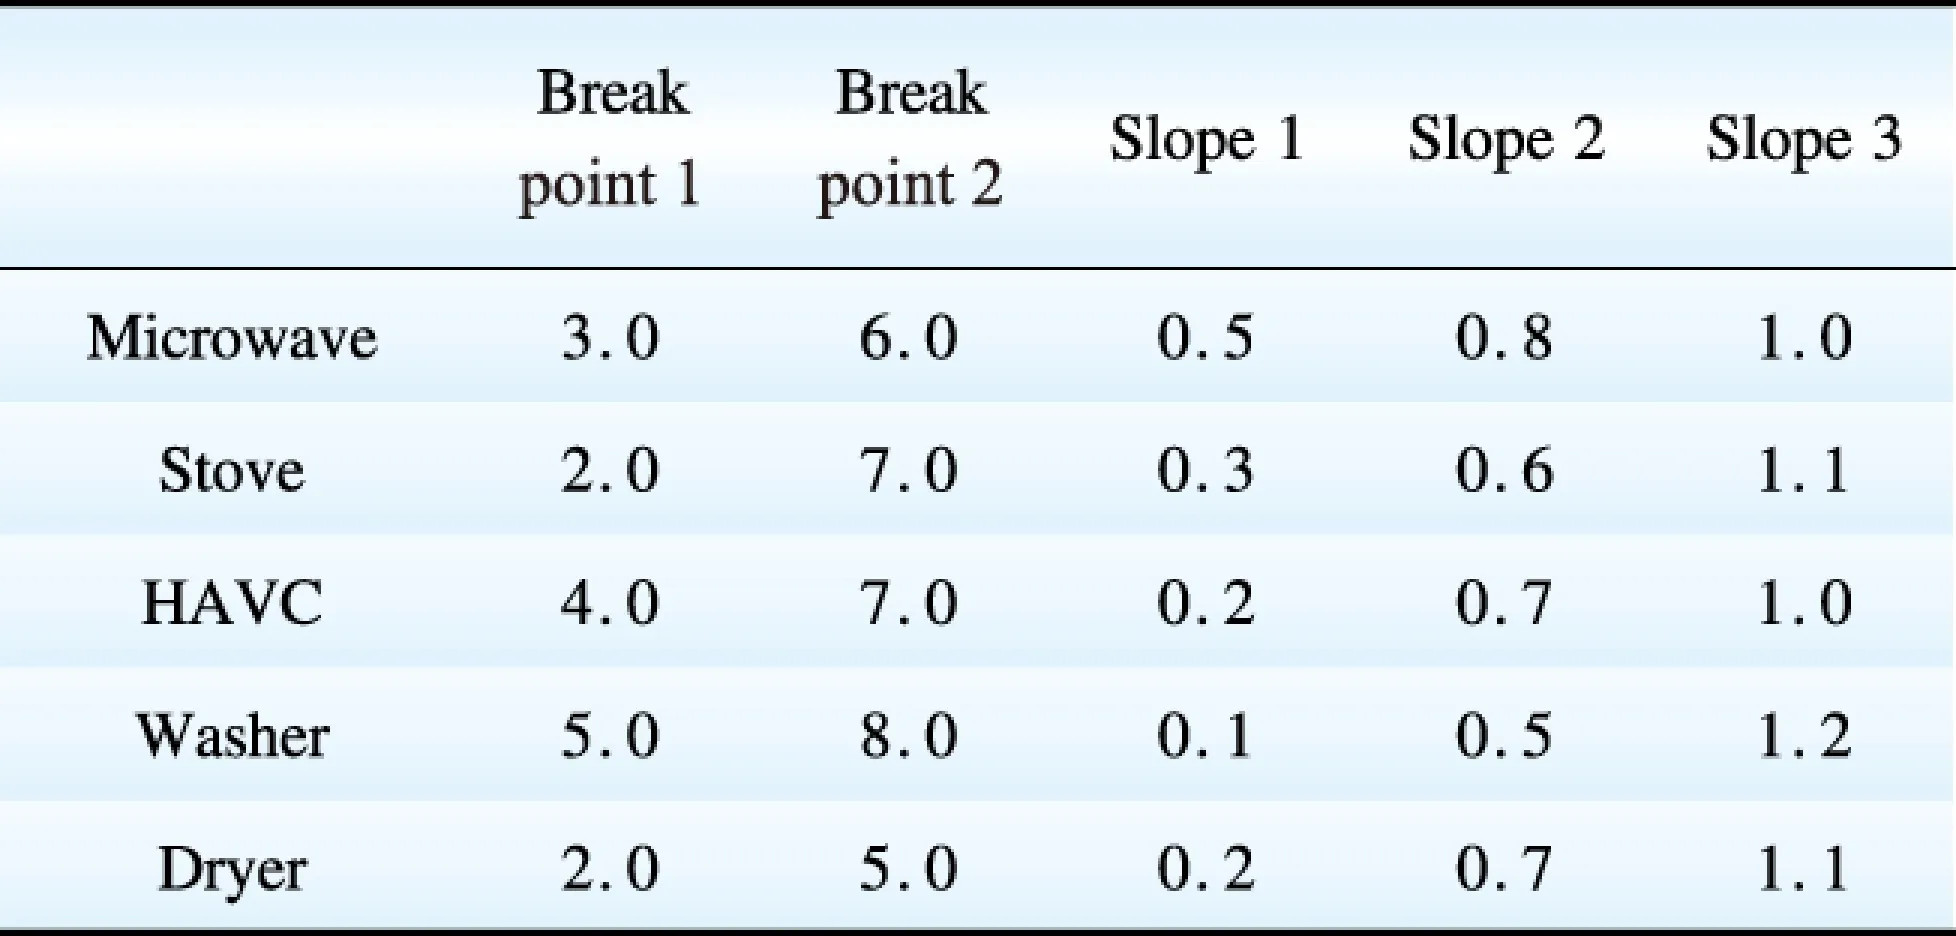
We implement the MIP model for Energy Disaggregation described in Section 2.3 by IBM Optimization Programing Language (OPL) that is a type of high-level scripting language seamlessly integrated with CPLEX optimization engine. We use OPL to create a moving window for energy disaggregation on an appliance level with an interval equal to 30 s. The total time interval for disaggregation is 600 s. All of the parameters are configurable in real time. Table 1 lists consumption characteristics for five types of appliances represented by piecewise linear curves.
表1 用电设备特性参数
Table 1 Parameters for five devices’ consumption characteristics
In this example, we selectL1-norm as the objective function to minimize the aggregated absolute error residues of consumption data,however, our software does supportL1,L2, and L-infinite norms in the optimization model. We use a random term with normal distribution to simulate the electricity consumption over time produced by smart meters. Fig. 12 shows the total power consumption from both measurement and disaggregation result. During most of the time points, the error residue is small except at two time points the relative error is beyond 25%. The root cause is that all of the data are from a stochastic simulation process and between time point 10 and 15 there is a significant change in simulation data. In reality, the case is having a low probability to occur.

图12 总用电量与拟合误差Fig.12 Total power consumption and relative error
Fig. 13 shows device’s on and off status from disaggregation results. During the two valley spots, the Washer and HAVC got shutdown accordingly.
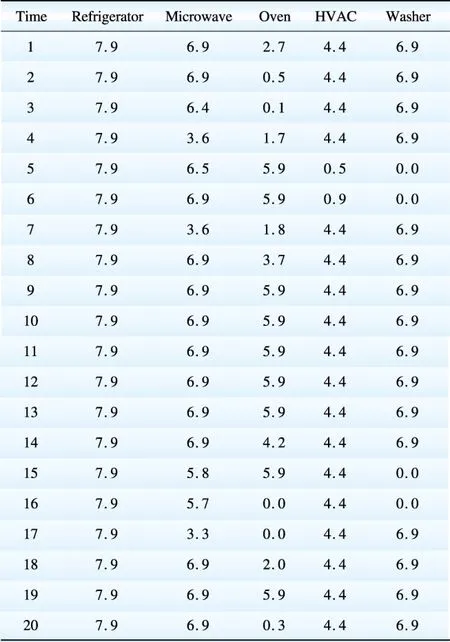
Table 2 gives each device’s power consumption based on disaggregation results. The result is shown in Fig. 14. Our energy disaggregation tool can operate on a continuous rolling window mode. All of the simulations perform very efficiently, typically less than 1 s.
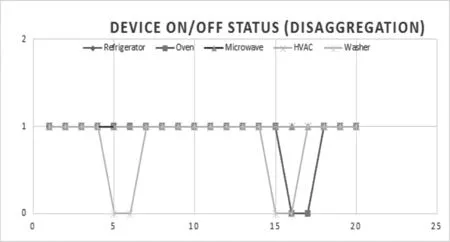
图13 基于电能分解的设备开关状态Fig.13 Device status based on energy disaggregation

图14 基于电能分解的设备用电量Fig.14 Device consumption based on energy disaggregation
4 Conclusion
The paper gives an overview on research works conducted at SGRI North America big data lab with highlights on hardware configuration and software deployment of the cluster environment. The paper reviews several ongoing research topics performed in the lab, for example: a conceptual design of data structure and computing architecture for smart grid, customer segmentation and response targeting (collaboration with Stanford University), and energy disaggregation. These works are built on an integrated power system data model that is supported by open source technology. Preliminary results show that our research will benefit both utility companies and customers. The future directions would include integrating the existing applications with parallel computing framework at big data lab to accelerate the overall performance and making the software platform mature eventually.
表2 基于电能分解的用电量
Table 2 Device power consumption
Acknowledgement
The authors would like to thank Dr. J. Kwac and Prof. R. Rajagopal for their contributions. The authors also express their thanks to Prof. C. Kang for the review and comments.
5 References
[1]What is big data analytics?-Definition from WhatIs.com[EB/OL]. http://searchbusinessanalytics.techtarget.com/definition/big-data-analytics.
[2]Smart electric meters, Advanced metering infrastructure, and meter communications: Global market analysis and forecasts[EB/OL] Navigant Research, 2013. http://www.navigantresearch.com/research/smart-meters.
[3]Yu N, Shah S, Johnson R, et al. Big data analytics in power distribution systems[J]. IEEE ISGT 2015.
[4]Wikipedia[EB/OL]. https://en.wikipedia.org/wiki/Phasor_measurement_unit
[5]Xie L, Chen Y, Kumar P R. Dimensionality reduction of synchrophasor data for early anomaly detection: linearized analysis[J]. IEEE Transactions on Power Systems, 2014, 29(6): 2784-2794.
[6]Liu G, Yu Y, Gao F,et al. Research of smart gird big data model[C]. 23rd International Conference on Electricity Distribution Lyon, 2015.
[7]Saunders C, Liu G, Yu Y, et al. Data-driven distributed analytics and control platform for smart grid situational awareness[C]. CSEE, 2015.
[8]Spark official website[EB/OL]. https://spark.apache.org/.
[9]Liu G, Zhu W, Saunders C, et al. Real-Time Complex Event Processing and Analytics for Smart Grid[C]//Complex Adaptive Systems, San Jose: Conference Organized by Missouri University of Science and Technology, 2015.
[10]Kwac J, Tan C, Sintov N, et al. Utility customer segmentation based on Smart Meter Data: Empirical Study[J]. IEEE Smart Grid Community, 2013.
[11]Kwac J, Rajagopal R, Demand response targeting using big data analytics[C]// 2013 IEEE International Conference on Big Data.
[12]Dong R, Ratliff L, Ohlsson H, et al. A dynamical systems approach to energy disaggregation[C]//2013 IEEE 52nd Annual Conference on Decision and Control (CDC).
[13]Kolter J Z, Batra S, Ng A Y. Energy disaggregation via discriminative sparse coding[C]//Advances in Neural Information Processing Systems, 2010.
[14]Drenker S, Kader A. Nonintrusive monitoring of electric loads[J]. IEEE Computer Applications in Power, 1999, 12(4): 47-51.
[15]Rahayu D, Narayanaswamy B, Krishnaswamy S. Learning to be energy-wise: discriminative methods for load disaggregation[C]//Third International Conference on Future Energy Systems: Where Energy, Computing and Communication Meet (e-Energy), 2012. [16]Farinaccio L, Zmeureanu R. Using a pattern recognition approach to disaggregate the total electricity consumption in a house into the major end-uses[J]. Energy and Buildings, 1999, 30(3): 245-259.
[17]Rajan D, Takriti S. Minimum up/down polytopes of the unit commitment problem with start-up costs[R].IBM Research Report, 2005.
高峰(1977),博士,IEEE与INFORMS会员,高级工程师。研究方向为电力系统经济运行、电力市场交易、优化与决策分析、电力大数据、电力系统规划,人工智能技术;
刘广一(1963),博士,教授级高级工程师,研究方向为电力系统经济调度、网络分析、 EMS/DMS、主动配电网、电力大数据和电力市场;
Chris Saunders(1980),博士,高级工程师,研究方向为数据库架构、电力系统数据分析、电力系统数据挖掘、机器学习、电力系统运行与规划;
朱文东(1969),硕士,高级工程师,研究方向为关系型数据库、NoSQL & NewSQL、分布式计算、实时流数据计算、基于内存计算的开源集群计算平台Spark及其在电力系统中的应用;
陈振宇(1961),博士,斯坦福大学智能电网研究所主任。研究方向为智能电网大数据,分布式能源规划及运作,电力系统动态分析;
于洋,博士,研究方向为电力市场设计、新能源接入、配电侧市场设计、电力消费分析、电力系统机制设计的环境影响、电力市场与碳市场等。
(编辑:刘文莹)
国家自然科学基金资助项目(51261130472); 国家电网公司科技项目 (DZB51201403772)。
TM 76
A
1000-7229(2015)10-0011-09
智能电网大数据的分析与应用
高峰1,刘广一2,Chris Saunders1, 朱文东1, 陈振宇3,于洋3
(1. 国网智研院美国研究院,Santa Clara, CA 95054;2. 中国电力科学研究院,北京市 100192;3. 斯坦福大学,Palo Alto 94305)
能源互联网的兴起是全球能源环境与经济发展双重压力导致的结果,这种趋势不可避免地促进大数据分析技术的快速发展。大数据技术是指从各种各样类型的海量数据中,快速获得有价值信息的技术。简要介绍了国网智研院美国研究院大数据团队的研究工作和实验室软硬件配置,介绍了智能电网数据结构和计算架构等概念性的设计。重点介绍了与斯坦福大学合作进行的用户分组分类和需求响应定量计算方法,以及非侵入式电能分解。这些工作基于集成的数据模型和开源软件技术,将为电网公司和客户同时带来收益。
大数据解析;混合整数规划;用电行为分析;电能分解
2015-08-03
2015-09-14
10.3969/j.issn.1000-7229.2015.10.002
Project supported by National Natural Science Foundation of China (51261130472);Science and Technology Program of the State Grid Corporation of China (DZB51201403772).
