Dominant Cloud Microphysical Processes of a Torrential Rainfall Event in Sichuan,China
2015-02-24HUANGYongjieandCUIXiaopeng
HUANG Yongjieand CUI Xiaopeng
1Key Laboratory of Cloud-Precipitation Physics and Severe Storms,Institute of Atmospheric Physics, Chinese Academy of Sciences,Beijing100029
2University of Chinese Academy of Sciences,Beijing100049
3Collaborative Innovation Center on Forecast and Evaluation of Meteorological Disasters, Nanjing University of Information Science&Technology,Nanjing210044
Dominant Cloud Microphysical Processes of a Torrential Rainfall Event in Sichuan,China
HUANG Yongjie1,2and CUI Xiaopeng∗1,3
1Key Laboratory of Cloud-Precipitation Physics and Severe Storms,Institute of Atmospheric Physics, Chinese Academy of Sciences,Beijing100029
2University of Chinese Academy of Sciences,Beijing100049
3Collaborative Innovation Center on Forecast and Evaluation of Meteorological Disasters, Nanjing University of Information Science&Technology,Nanjing210044
High-resolution numerical simulation data of a rainstorm triggering debris fow in Sichuan Province of China simulated by theWeather Researchand Forecasting(WRF)Model wereused tostudythedominant cloud microphysical processes of the torrential rainfall.The results showed that:(1)In the strong precipitation period,particle sizes of all hydrometeors increased, and mean-mass diametersof graupel increased themost signifcantly,ascompared withthose intheweakprecipitation period; (2)The terminal velocity of raindrops was the strongest among all hydrometeors,followed by graupel’s,which was much smaller than that of raindrops.Differences between various hydrometeors’terminal velocities in the strong precipitation period were larger than those in the weak precipitation period,which favored relative motion,collection interaction and transformation between the particles.Absolute terminal velocity values of raindrops and graupel were signifcantly greater than those of air upward velocity,and the stronger the precipitation was,the greater the differences between them were; (3)The orders of magnitudes of the various hydrometeors’sources and sinks in the strong precipitation period were larger than those in the weak precipitation period,causing a difference in the intensity of precipitation.Water vapor,cloud water, raindrops,graupel and their exchange processes played a major role in the production of the torrential rainfall,and there were two main processes via which raindrops were generated:abundant water vapor condensed into cloud water and,on the one hand,accretion of cloud water by rain water formed rain water,while on the other hand,accretion of cloud water by graupel formed graupel,and then the melting of graupel formed rain water.
torrential rainfall,Sichuan,cloud microphysical processes,numerical simulation
1. Introduction
Orographictorrentialrainfallcancausefoods,landslides, debris fows and other natural disasters,constituting a great threat to the lives and properties of people,and representing a great challenge to mountain weather forecasters.The Sichuan Basin,with its complex terrain,is located east of the Tibetan Plateau,north of the Yunnan–Guizhou Plateau,and south of the Qinling Heights.It is a storm-proneplace,where debris fows,landslides and other secondary geological disasters occur frequently.Following two major earthquakes—Wenchuanearthquake(2008)andYa’anearthquake(2013)—the situation has worsened because the soil of Sichuan’s complex terrain surrounding these earthquake zones has become much looser,meaning frequent torrential rainfall ismore likely to lead to debris fows and other disasters.Therefore,understandingthe physicalprocesses responsibleforthe developmentof orographictorrentialrainfall is crucial forthe improvement of operational forecasts in this area.
Sawyer(1956)revealed three important factors for orographic rainfall:larger-scale atmospheric circulation;the interaction of the ambient fow by terrain;and cloud microphysical processes.Smith and Barstad(2004)developed a linear steady-state theory for orographic rainfall and derived a linear precipitation model that can represent many complex processes in orographic rainfall using a relatively simple equation(Crochet et al.,2007;Smith and Evans,2007). However,this linear model cannot include fow blocking, gravity wave breaking,and other non-linear processes,and usesrelativelysimplemicrophysics.Comparedwiththissimple linear model,high-resolution mesoscale models,such as the Weather Research and Forecasting(WRF)model,can better refect nonlinear dynamics,thermodynamics,and de-tailed microphysical processes in complex orographic rainfall,which has been intensively applied to studies of severe weather and torrential rainfall(Ge et al.,2008;Maussion et al.,2010;Smith et al.,2010;Wang et al.,2011;He and Li, 2013;Wang et al.,2013;Li et al.,2014).Luet al.(2009)simulated and analyzed several local heavy rainfall events over the western Sichuan Basin during August 2003 using the AdvancedRegionalEta-coordinateModel(AREM),andshowed that heavyrainfall events overthis area are highly sensitive to the initial local water vaporconditions.Chen et al.(2010)exploredamethodtoimprovetheaccuracyofSichuantorrential rainfall forecasts based on Bayesian decision theory.Chen and Li(2013)used satellite,radar and routine meteorological data to analyze a mesoscale convectivesystem(MCS)and its effects on short-term heavy rainfall in the Sichuan Basin during July 2012.Wang et al.(2013)simulated and analyzed a rainstorm process infuenced by the terrain in Sichuan using the WRF model and carried out a diagnostic analysis using dynamical parameters.Li et al.(2014)analyzed observations and a WRF simulation of a rainstorm process that triggered debris fows,and their results indicated that this precipitation process had a short duration,strong intensity and local characteristics,and the heavy rainfall occurred mainly near steep terrain in the Wenchuan–Ya’an earthquake fault zone.Their study(Li et al.,2014)also noted that,under favorable largescale circulations,the developmentof a southwest vortex and its interaction with strong wind at the western edge of the subtropical high enhanced the lifting effects of steep terrain and caused heavy rainfall.Because of the combined effects of complex dynamic,thermodynamic and cloud microphysical processes over complex terrain,more accurate quantitative precipitation forecasts(QPFs)remain a huge challenge. Studies on orographictorrential rainfall in Sichuan,in particular,and studies on cloudmicrophysicalprocesses associated with torrential rainfallhave seldom been conducted,although some numerical sensitivity experiments of cloud microphysical parameterization schemes have been carried out(Li and He,2011;Liao et al.,2012;Ma et al.,2012).Overall,however,a number of open questions remain.For example,what is the key cloud microphysical process for the formation of orographic torrential rainfall?And what are the main raindrop sources for the production of torrential rainfall?
Li et al.(2014)carried out a numerical simulation of a rainstorm in Sichuan using the WRF model.They discussed the role of large-scale circulation evolution and development of the mesoscale system in the emergence of the rainstorm over complex terrain from macroscopic and dynamic perspectives.However,since the formation of a rainstorm is related to both macroscopic dynamic and cloud microphysical processes,as discussed above,it is necessary to also examine the dominant cloud microphysical processes involved in the torrential rainfall event.To address this,we used similar schemes and the same model as Li et al.(2014)to carry out a high-resolution numerical simulation of the orographic rainfall event.However,as an extension to the work of Li et al.(2014),in our study cloud microphysical data were output and analyzed to investigate the above aspect.The numerical simulation and cloud microphysical scheme are briefy described in section 2,the results are presented in section 3, and a summary is given in section 4.
2. Numerical simulationandcloudmicrophysical scheme
2.1.Numerical simulation
A torrential rainfall event in Sichuan Province of China from 1800 UTC 17 August to 0000 UTC 20 August 2010 was simulated using the same WRF model setup as in Li et al.(2014).The simulation was integrated for 54 hours,using three nests with resolutions of 27,9,and 3 km.In the 3 km domain,only the cloud microphysical parameterization scheme was used[for simulation verifcation and other details,see Li et al.(2014)],and the cloud microphysical data (including cloud microphysical conversion terms)were output and analyzed in this study.
2.2.Cloud microphysical scheme
The cloud microphysical scheme used was the Milbrandt 2-mom scheme(Milbrandt and Yau,2005a,b),which includes water vapor and six cloud species:water vapor(Qv); cloud water(Qc);rain water(Qr);cloud ice(Qi);snow(Qs); graupel(Qg);and hail(Qh).Figure 1 shows the microphysical fowchart for the Milbrandt 2-mom scheme[for detailed microphysical conversion processes,see Milbrandt and Yau (2005b)].The tendencies for the mixing ratios are
whereSQv,SQc,SQr,SQi,SQs,SQgandSQhare microphysical source/sink terms of water vapor and cloud species,respectively.The notation for the terms involving two interacting categories is denoted by QAByx(also see Milbrandt and Yau, 2005b),whereQis theprognosticvariablemass mixingratio, AB represents microphysical processes(QCL for collection, QCN for conversion,QFZ for freezing,QIM for ice multiplication,QML formelting,QNU fornucleation,QSH forshedding,QVD for diffusional growth),and the subscript“yx”indicates that mass is being transferred from categoryytox[x,y∈(v,c,r,i,s,g,h)denote various water species].δxryis a determination coeffcient meaning that categoryx(s,i,g) and raindrops collide to form categoryy(s,g,h).For example,if raindrops and snow collide to form graupel,thenδsrg=1,δsrs=0 andδsrh=0(for details,see Milbrandt and Yau,2005b).
3. Results
3.1.Precipitation and cloud hydrometeors distribution
Figure 2 shows the distributions of 6-hourly accumulated rainfall and 6-hourlyaveragedand verticallyintegratedaIntegral calculation method:where,Qx,vintrepresents vertically integrated mixing ratio of category x(Qx),PtandPsarepressure at the top and the surface of the atmosphere.mixing ratios of hydrometeors in the weak(0000–0600 UTC 18 August 2010)and strong(1800UTC 18 August to 0000UTC 19 August 2010)precipitation periods.The mixing ratio of hail was negligibly small in this rainfall event and is not analyzed in the following discussions.In the strong precipitation period,the area and intensity of precipitation and cloud hydrometeors increased compared with those in the weak precipitation period(Fig.2).In the weak precipitationperiod,6-hourlyaccumulatedrainfall didnot exceed40 mm,compared to the maximum 6-hourly accumulated rainfall of over 100 mm in the strong precipitationperiod(Figs.2a and b).As for the 6-hourly averaged and vertically integrated mixing ratios ofhydrometeors,themaximumofthemixingratiosincreased from less than 0.09×10⁻³kg kg-1to more than 0.27×10⁻³kg kg-1for cloud water(Figs.2c and d),from less than 0.06×10⁻³kg kg-1to morethan0.3×10-3kgkg-1forrain water(Figs.2e and f),from less than 0.06×10⁻³kg kg-1to morethan 0.14×10⁻³kg kg-1forcloudice(Figs.2gand h), from less than 0.2×10⁻³kg kg-1to more than 0.7×10⁻³kg kg-1for snow(Figs.2i and 2j),and from less than 0.04× 10⁻³kg kg-1to more than 0.6×10⁻³kg kg-1for graupel (Figs.2k and l).In the strong precipitation period,the centers of the rain water mixing ratio coincided well with rainfall centers as well as cloud water,snow and graupel,indicating that the evolutions of both liquid and solid hydrometeors may have important contributions to precipitation development.Compared with the weak precipitation period,in the strong precipitation period,not only liquid hydrometeors(cloud water and rain water)increased signifcantly(themaximumgrowthof cloud water contentwas more than three times greater,and the maximum growth of rain water content was more than fve times greater),but also solid hydrometeors(cloudice,snowandgraupel)grewsignifcantly(themaximum growth of cloud ice content was more than two times greater,the maximum growth of snow was more than three times greater,and the maximum growth of graupel was more than ffteen times greater),and their centers were consistent with strong rainfall centers,showing that cold cloud processes developed remarkably and ice-phase processes contributed much more to the rainfall in the strong precipitation period.
3.2.Cloud microphysical characteristics
To further study the differences in cloud microphysical characteristics between the weak and strong precipitation periods,we focused our analysis on the region of(28°–33°N, 100°–106°E)in the 3 km domain.Grids whose 6-hourly accumulated rainfall was greater than 35 mm(256 grids in total)in the weak precipitation period(0000–0600 UTC 18August 2010)and grids whose 6-hourly accumulated rainfall was greater than 80 mm(228 grids in total)in the strong precipitation period(1800 UTC 18 August to 0000 UTC 19 August 2010)were chosen for analysis.
Figure3 shows compositesof verticalproflesofhydrometeor mixing ratios(Figs.3a and b),number concentrations (Figs.3c and d),mean-mass diameters(Figs.3e and f),and terminal velocities and air vertical velocities(Figs.3g and h)in the weak and strong precipitation periods.In the Milbrandt2-momscheme,the mean-mass diameterDmxforeach hydrometeorcategoryxwas computed by
whereρis the air density,cxanddxare parameters for the mass–diameter relations[see Milbrandt and Yau(2005a)for specifc values],Qxis the mixing ratio,andNxis the total number concentration.Tables 1 and 2 show the vertical accumulations of the above profles of mixing ratios and number concentrations,respectively.In the weak precipitation period,graupel was the most abundant(3.9036),the mixing ratios of cloud water(2.5644)and rain water(2.3247) were similar,and cloud ice(0.6282)and snow(0.7426)were the least prevalent(Fig.3a,Table 1).In the strong precipitation period,the abundance of the main hydrometeors increasedsignifcantly(Fig.3b).Theratiosofthemixingratios of cloud water,rain water,cloud ice,snow and graupel between the weak andstrong precipitationperiods were 1.6170,2.5864,5.1195,9.0687 and 1.7009,respectively(Table 1). A larger rain water mixing ratio(6.0126)corresponded with the strong precipitation.Higher snow(6.7344)and graupel (6.6396)mixing ratios may have made an important contribution to the development of the cloud system and strong precipitation;compared with the weak precipitation period, the higher cloud water mixing ratio(4.1467)in the strong precipitation period may also have played an important role in the strong surface precipitation(Fig.3b,Table 1).Furthermore,as shown in Figs.3a and b,and the vertically stratifed accumulationresults in Tables 1 and 2,the cloud water above and below the zero layer possessed similar magnitudes,and abundantsuper-cooledcloud water may havemade an important contribution to the heavy rainfall.Rain water(cloud ice, snow and graupel)was mainly distributes below(above)the zero layer,and the coalescence of cloud water and rain water below the zero layer should also plays an important role in strong rainfall.There was also some graupel distributed below the zero degree layer,whose melting may have made an important contribution to the growth of rain water and the enhancement of surface rainfall.
As shown in Figs.3e and f,in the strong precipitation period,particle sizes of all hydrometeors increased compared with those in the weak precipitation period,and mean-mass diameters of graupel increased the most signifcantly(maximum increased from about 0.9 mm to more than 1.9 mm), while the increase in the mean-mass diameters of cloud ice was not signifcant.In Eq.(8),the mean-mass diameterDmxis not only correlated with the number concentrationNx,but also with the mixing ratioQx.Although the number concentrations of all hydrometeors increased(Figs.3c and d,Table 2),their mixingratios increased as well(Figs.3a and b,Table 1).Therefore,the ratio of the mixing ratioQxto the number concentrationNxforeachhydrometerincreased(butwithdistinctly different magnitudes),indicating that the mean-mass diameter increased,thereby increasing the mean particle size (Figs.3e and f).The increasing of graupel particle sizes may be partially related to the accretion of cloud water by graupel to form graupel,which causes the graupel mixing ratio to increase while the graupel number concentration remains roughly the same.Similarly,the increasing of rain water particle sizes may be partially related to the accretion of cloud water by rain water to form rain water.Besides,the increasing of particle sizes of all hydrometeors is favorable for the occurrence of collision between particles,especially cloud water with rain water and graupel.
Meanwhile,Figs.3c and d show that the height of the number concentration maximum of cloud water and rain water in the strong precipitation period was higher than in the weak precipitation period.This may have been related to stronger vertical upward motion in the strong precipitation period(Figs.3g and h).By analyzing the vertical profles of vertical velocity of air and various hydrometeors’terminal velocities in the two periods(Figs.3g and h),we can see thatthe rain water’s terminal velocity was the strongest among all hydrometeors in both the strong(strongest value was close to-6.5 m s-1)and weak(strongest value was close to-4.5 m s-1)precipitationperiods.Graupel’sterminalvelocitywas second strongest,but its strongest value was only about-2 m s-1(in the strong precipitation period),far below that of rain water.In the strong precipitation period,the differences among the various hydrometeors’terminal velocities became larger compared to in the weak precipitation period,which would have been more benefcial to relative motion,coalescence and transformation between particles.It is worth noting that the absolute values of the rain water’s and graupel’s terminal velocities were signifcantly greater than that of air vertical velocity,and the stronger the precipitation was,the larger the differences between them were(Figs.3g and h). This was the result of the development of the cloud microphysicalprocessesduringtherainstorm,whichmayhavepresaged the gradual demise of the storm cloud system and the gradual end of the rainstorm process.
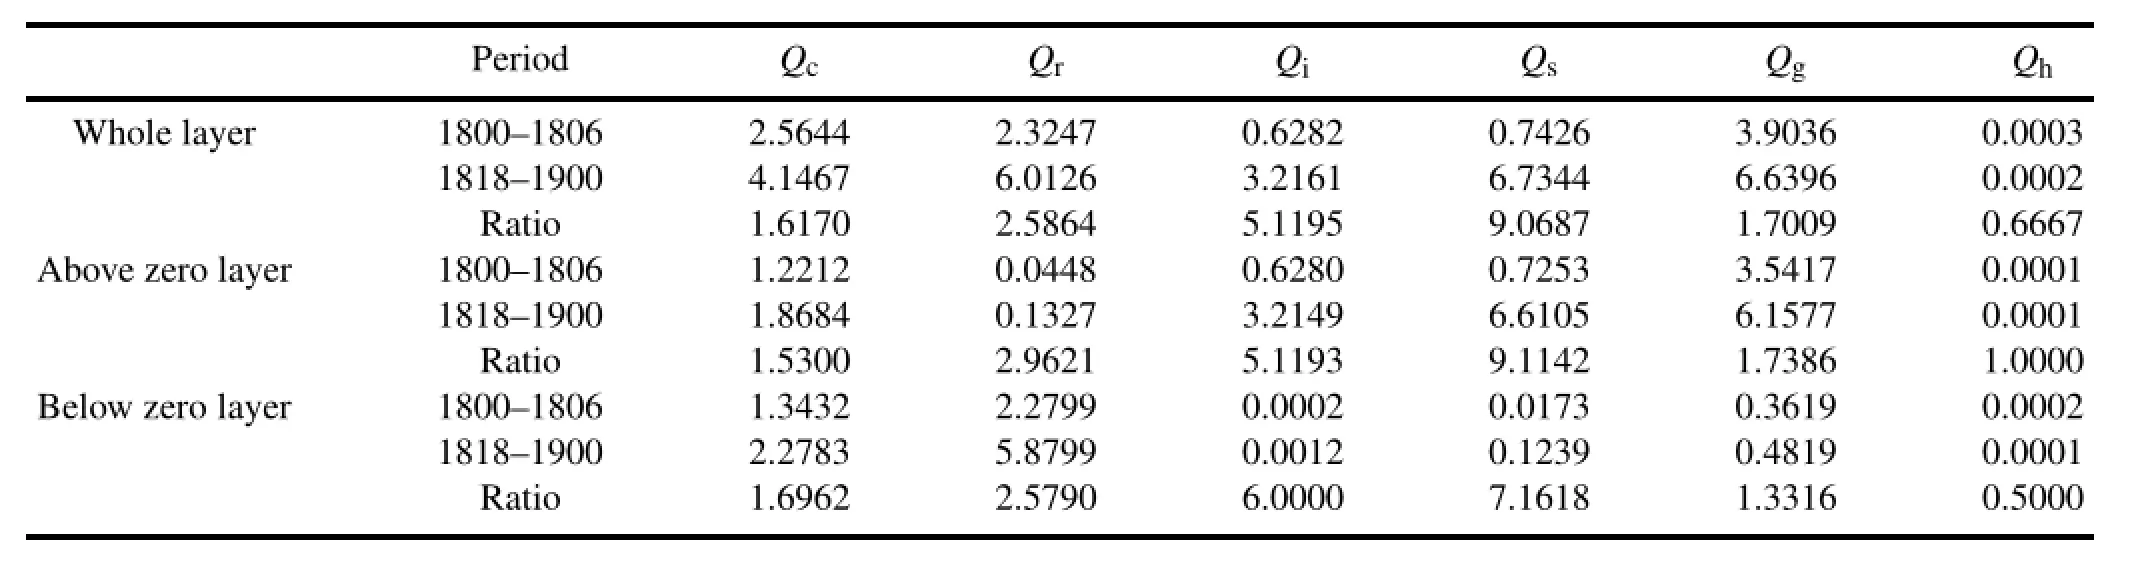
Table 1.Vertical cumulative mixing ratios of cloud hydrometeors(Qv,Qc,Qr,Qi,Qs,Qg,Qh,units:10-3kg kg-1)throughout the whole layer,above and below the zero layer,in the weak precipitation period(0000–0600 UTC 18 Aug 2010)and the strong precipitation period (1800 UTC 18 Aug–0000 UTC 19 Aug 2010).The ratio is(1818–1900)/(1800–1806).
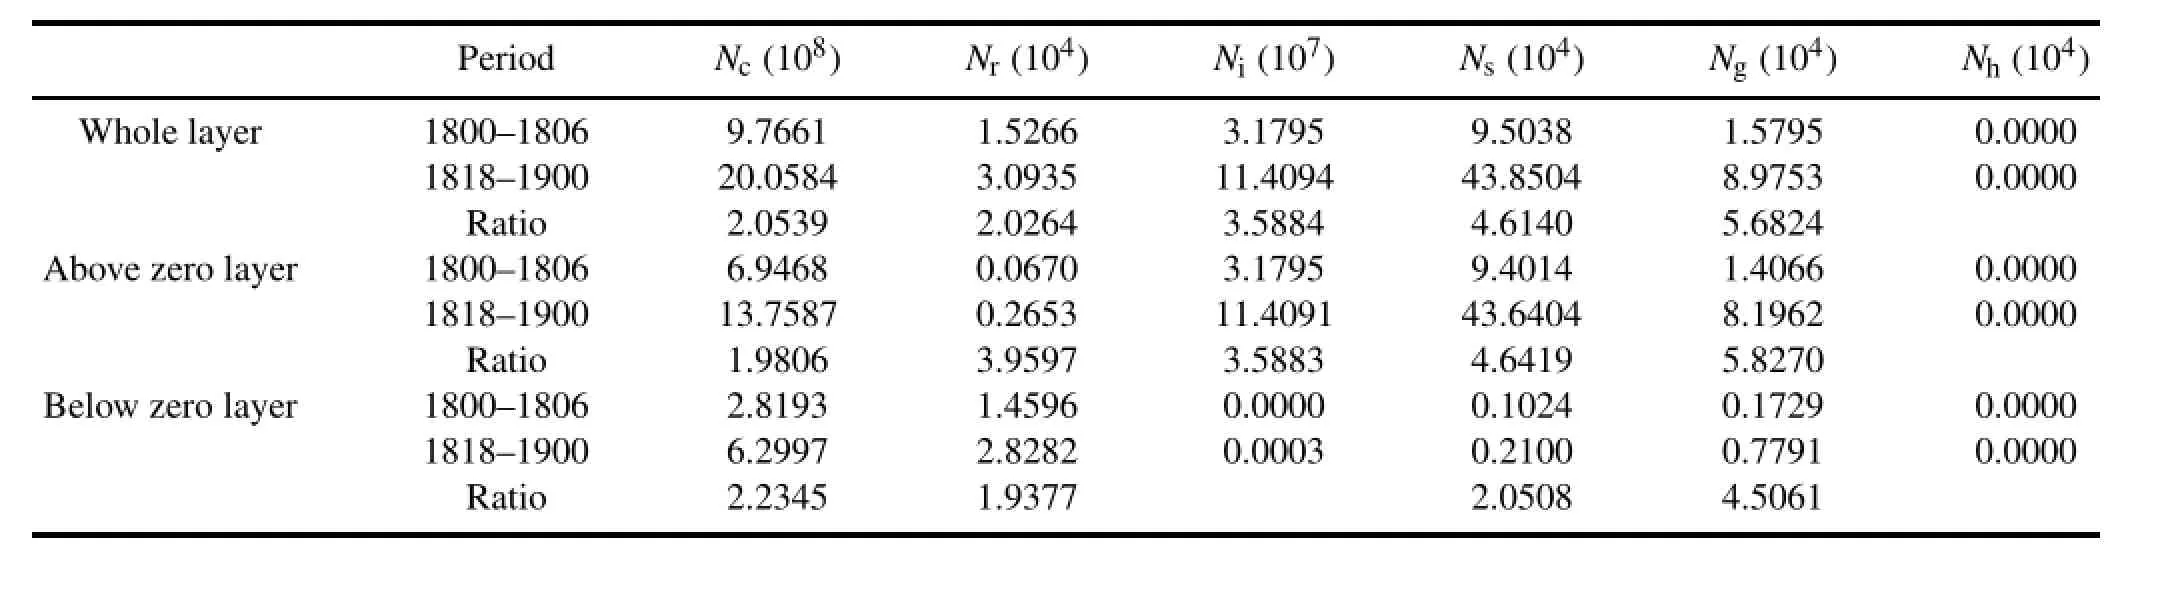
Table 2.Vertical cumulative number concentrations of cloud hydrometeors(Nc,Nr,Ni,Ns,Ng,Nh,units:kg-1)throughout the whole layer, above and below the zero layer,in the weak precipitation period(0000–0600 UTC 18 Aug 2010)and the strong precipitation period(1800 UTC 18 Aug–0000 UTC 19 Aug 2010).The ratio is(1818–1900)/(1800–1806).
3.3.Cloud microphysical conversion processes
The microphysical sources/sinks and conversion processes of hydrometeors in the weak and strong precipitation periods are shown in Fig.4.The hydrometeors’main microphysical sources/sinks were similar in both periods,but the sources/sinks in the strong precipitation period were signifcantly stronger than those in the weak precipitation period,ultimately resulting in differences in the intensity of precipitation.Furthermore,the orders of magnitude of the sources/sinks(cloud microphysical conversion rates)of water vapor,cloud water,rain water and graupel were much larger than those of cloud ice and snow,indicating that water vapor,cloud water,rain water,graupel and their conversion processes played a major role during the development of the rainstorm.Condensation of water vapor to form cloud water(QVDvc)was the main source term of cloud water,while accretion of cloud water by rain water(QCLcr)and the accretion of cloud water by graupel(QCLcg)were the main sink terms of cloud water(Figs.4c and d).In the budget of graupel,the collection of cloud water by graupel(QCLcg)was a main source term of graupel,while the melting of graupel to form rain water(QMLgr)was a major consumption term of graupel(Figs.4k and l).The graupel production from the process of graupel–rain collision(QCLgrg)required the expenditure of graupel(QCLgr)and rain water(QCLrg).Therefore,the net growth of graupel by graupel–rain collision and coalescence was(QCLgrg-QCLgr).Meanwhile,since absolute values of QCLgrgand QCLgrwere similar(Figs.4k and l),values of(QCLgrg-QCLgr)were small,meaning that the collection of rain water by graupel to form graupel was not a main source/sink term of graupel(Figs.4k and l).As for rain water,the accretionof cloudwater byrain water(QCLcr) and the melting of graupel to form rain water(QMLgr)were the main source terms(Figs.4e and f),which caused the rapid growth of rain water(Fig.4f)and eventually enhanced surface precipitation in the strong precipitation period(Fig. 2b).
The above analysis of hydrometeors’microphysical sources/sinks is summarizedin Fig.5.The solid thick arrows (Fig.5)represent the most important microphysical conversion processes in this rainstorm.The main cloud microphysical conversion processes related to precipitation in the two periods were the same,shown as solid thick arrows in Fig.5, and proportions of these processes to total water vapor loss (WVLbWVL,Water Vapor Loss is defned asWVL=max(QVDvc,0)+max(QVDvr,0)+max(QNUvi,0)+max(QVDvi,0)+max(QVDvs,0)+max(QVDvg,0)+max(QVDvh,0),Colle and Zeng,2004)in each period were roughly equal(see the values on the right-hand sides of the conversion process notations in Fig.5).However,due to different total water vapor loss rates in the strong(WVL=15.73)and weak(WVL=7.38)precipitation periods,the microphysical conversion rates between these two periods were signifcantlydifferent(seevaluesin parenthesesin Fig.5),resulting in signifcant differences in precipitation intensity between these two periods.In the strong precipitation period(Fig. 5b),there were two main pathways to generate rain water: QVDvc→QCLcrand QVDvc→QCLcg→QMLgr,which can be described as follows:Abundant water vapor condensedintocloudwater(QVDvc)and,ontheonehand,accretion of cloud water by rain water(QCLcr)formed rain water, while on the other hand,accretion of cloud water by graupel(QCLcg)formed graupel,and then the melting of graupel formed rain water(QMLgr).As discussed above,the net growthof graupelby graupel–rainwater collision and coalescence(QCLgrg-QCLgr)was not a major source of graupel and was also not a major sink of rain water(Fig.5).Therefore,the net result of(QCLgrg-QCLgr)contributed little to raindrop growth and enhancement of surface precipitation. In Fig.5,we can see another distinct difference between the two periods:In the strong precipitation period,depositional growth of snow(QVDvs),melting of snow to form rain water(QMLsr),and autoconversion(aggregation)of snow to form graupel(QCNsg)strengthened,which played a role in the growth of rain water(Fig.5b).Due to the accumulation of abundant moisture in the strong precipitation period, water vapor deposition to form ice-phase particles,such as snow(QVDvs),was more likely to occur in the upper levels. Meanwhile,in the strong precipitation period,mixing ratios of cloud water and snow were signifcantly larger than those in the weak precipitation period(Figs.3a and b),so the accretion of cloud water by snow(QCLcs)strengthened(Fig. 5).The increasing of snow also had an active effect on the autoconversion of snow to form graupel.Besides,from Fig. 3b,we can see that the vertical profle of the snow mixing ratio extended below the zero layer,thereby enhancing the process of snow melting into rain water.However,the orders of magnitudes of these conversion processes associated with snow were signifcantly smaller than those of the mainmicrophysical conversion processes mentioned above.
4. Summary
In this study,by using high-resolution numerical simulation data of an orographic torrential rainfall process in Sichuan simulated by the WRF model,differences of cloud microphysical characteristics and conversion processes between weak and strong precipitation periods were analyzed to investigatethedominantcloudmicrophysicalprocesses responsible for the development of the torrential rainfall.The major results can be summarized as follows:
(1)In the strong precipitation period,the area and intensity of precipitation and cloud hydrometeors increased compared with those in the weak precipitation period,and the centers of rain water,cloud water and graupel were collo-cated with strong rainfall centers,showing that both liquid and solid hydrometeors may play an important role in surface precipitation.
(2)Composite analysis of cloud hydrometeors revealed that,in the strong precipitation period,the cloud hydrometeors increased signifcantly.Abundantsuper-cooledcloud water may have made an important contribution to heavy rainfall.The coalescence of cloud water and rain water below the zero layer and the melting of graupel may also have played important roles in the growth of rain water and the enhancement of surface rainfall.In the strong precipitation period, particle sizes of all hydrometeors increased,especially graupel’s.Theincreasingofparticlesizes ofall hydrometeorswas favorable to the occurrenceof collision between particles,especially cloud water with rain water and graupel.
(3)The terminal velocity of raindrops was the strongest among all hydrometeors in both the weak and strong precipitation periods,followed by that of graupel.Differences of terminal velocities among the various hydrometeors in the strong precipitation periodwere larger than those in the weak precipitationperiod,which was favorable for the relative motion,collection interaction and exchange between particles. Absolute values of terminal velocities of raindrops and graupel were signifcantly greater than those of air updrafts.Thestronger the precipitation was,the greater the differences between them were,which may imply a decay of the rainfall.
(4)In both periods,the budgets of cloud microphysics weresimilar,buttheordersofmagnitudesofthecloudmicrophysical conversion terms in the strong precipitation period were signifcantly larger than those in the weak precipitation period,resulting in a difference in the intensity of surface rainfall.Besides,the orders of magnitude of the conversion rates of water vapor,cloudwater,rain water and graupelwere much larger than those of cloud ice and snow,showing that water vapor,cloud water,rain water and graupel and their conversionprocesses may have played a major role in the development of the torrential rainfall event.
(5)In the rainstorm process,there were two main pathways for the generation of raindrops:QVDvc→QCLcrand QVDvc→QCLcg→QMLgr.In detail,abundant water vapor condensed into cloud water(QVDvc)and,on the one hand, the accretion of cloud water by rain water(QCLcr)formed rainwater,whileontheotherhand,theaccretionofcloudwater by graupel(QCLcg)formed graupel,and then the melting of graupel formed rain water(QMLgr).Furthermore,the net growthofgraupelby graupel–rainwater collision andcoalescence(QCLgrg-QCLgr)contributedlittle to raindropgrowth and enhancement of surface precipitation.
Our own previous analyses and studies have shown that the type of orographic torrential rainfall discussed in this study is very common in summer in the Sichuan region. Thus,although only one case has been analyzed in this paper,the conclusions may have a certain degree of universality,which is of great signifcance as we strive for an in-depth and comprehensive understanding of the mechanisms underpinning orographic torrential rainfall in the Sichuan region. In future work,we will analyze more cases to make the conclusions more robust and statistically signifcant.
Acknowledgements.This work was supported by the Key Research Program of the Chinese Academy of Sciences(Grant No. KZZD-EW-05-01)and the National Basic Research Program of China(973 Program)(Grant No.2014CB441402).
REFERENCES
Chen,C.P.,H.Z.Feng,and J.Chen,2010:Application of Sichuan heavy rainfall ensemble prediction probability products based on Bayesian method.Meteorological Monthly,36(5),32–39. (in Chinese)
Chen,Y.R.,and Y.Q.Li,2013:Characteristics of mesoscale convective system and its effects on short-time severe rainfall in Sichuan Basin during 21–22 July 2012.Meteorological Monthly,39(7),848–860.(in Chinese)
Colle,B.A.,and Y.G.Zeng,2004:Bulk microphysical sensitivities within the MM5 for orographic precipitation.Part II: Impact of barrier width and freezing level.Mon.Wea.Rev., 132,2802–2815.
Crochet,P.,T.J´ohannesson,T.J´onsson,O.Sigurðsson,H. Bj¨ornsson,F.P´alsson,and I.Barstad,2007:Estimating the spatial distribution of precipitation in Iceland using a linear model of orographic precipitation.J.Hydrometeor.,8,1285–1306.
Ge,J.J.,W.Zhong,N.Du,and H.C.Lu,2008:Numerical simulationandanalysis of Sichuanrainstormunder terraininfuence.Scientia Meteorologica Sinica,28(2),176–183.(in Chinese)
He,Y.,and G.P.Li,2013:Numerical experiments on infuence of Tibetan Plateau on persistent heavy rain in South China.Chinese J.Atmos.Sci.,37(4),933–944.(in Chinese)
Li,A.T.,and H.R.He,2011:Impact of different cloud microphys-ical parameterization schemes on the numeric simulation results of“8.8”rainstorm process in Zhouqu.Meteorology and Disaster Reduction Research,34(3),9–16.(in Chinese)
Li,Q.,X.P.Cui,and J.Cao,2014:The observational analysis and numerical simulation of a heavy rain event in Sichuan Province.Chinese J.Atmos.Sci.,doi:10.3878/j.issn.1006-9895.1401.13255.(in Chinese)
Liao,J.B.,X.M.Wang,B.C.Xia,T.J.Wang,and Z.M.Wang, 2012:The effects of different physics and cumulus parameterization schemes in WRF on heavy rainfall simulation in PRD.J.Trop.Meteor.,28(4),461–470.(in Chinese)
Lu,P.,R.C.Yu,and T.J.Zhou,2009:Numerical simulation on the sensitivity of heavy rainfall over the western Sichuan Basin to initial water vapor condition.Chinese J.Atmos.Sci.,33(2), 241–250.(in Chinese)
Ma,Y.Z.,C.G.Lu,and S.T.Gao,2012:The effects of different microphysical schemes in WRF on a heavy rainfall in North China during 18–19 August 2010.Chinese J.Atmos. Sci.,36(4),835–850.(in Chinese)
Maussion,F.,D.Scherer,R.Finkelnburg,J.Richters,W.Yang, and T.D.Yao,2010:WRF simulation of a precipitation event over the Tibetan Plateau,China—An assessment using remote sensing and ground observations.Hydrology and Earth System Sciences Discussions,15,1795–1817.
Milbrandt,J.A.,and M.K.Yau,2005a:A multimoment bulk microphysics parameterization.Part I:Analysis of the role of the spectral shape parameter.J.Atmos.Sci.,62,3051–3064.
Milbrandt,J.A.,and M.K.Yau,2005b:A multimoment bulk microphysics parameterization.Part II:A proposed threemoment closure and scheme description.J.Atmos.Sci.,62, 3065–3081.
Sawyer,J.S.,1956:The physical and dynamical problems of orographic rain.Weather,11(12),375–381.
Smith,B.L.,S.E.Yuter,P.J.Neiman,and D.E.Kingsmill,2010: Water vapor fuxes and orographic precipitation over Northern California associated with a landfalling atmospheric river.Mon.Wea.Rev.,138,74–100.
Smith,R.B.,and I.Barstad,2004:A linear theory of orographic precipitation.J.Atmos.Sci.,61,1377–1391.
Smith,R.B.,and J.P.Evans,2007:Orographic precipitation and water vapor fractionation over the Southern Andes.J.Hydrometeor.,8,3–19.
Wang,C.X.,S.T.Gao,L.Liang,and Y.Z.Ma,2013:Diagnostic analysis of dynamical parameters for Sichuan rainstorm infuenced by terrain.Chinese J.Atmos.Sci.,37(5),1099–1110. (in Chinese)
Wang,W.,J.Liu,and X.J.Cai,2011:Impact of mesoscale gravity waves on a heavy rainfall event in the east side of the Tibetan Plateau.Transactions of Atmospheric Sciences,34(6),737–747.(in Chinese)
:Huang,Y.J.,and X.P.Cui,2015:Dominant cloud microphysical processes of a torrential rainfall event in Sichuan, China.Adv.Atmos.Sci.,32(3),389–400,
10.1007/s00376-014-4066-7.
(Received 28 March 2014;revised 5 June 2014;accepted 10 July 2014)
∗Corresponding author:CUI Xiaopeng
Email:xpcui@mail.iap.ac.cn
杂志排行

Advances in Atmospheric Sciences的其它文章
- A Hybrid Coupled Model for the Pacif i c Ocean–Atmosphere System.Part I:Description and Basic Performance
- Processes Leading to Second-Year Cooling of the 2010–12 La Ni˜na Event,Diagnosed Using GODAS
- Characterization and Source Apportionment of Volatile Organic Compounds in Urban and Suburban Tianjin,China
- Processes Leading to Second-Year Cooling of the 2010–12 La Ni˜na Event, Diagnosed Using GODAS
- Incorporation of Parameter Uncertainty into Spatial Interpolation Using Bayesian Trans-Gaussian Kriging
- An Assessment of the Predictability of the East Asian Subtropical Westerly Jet Based on TIGGE Data