Study of errors in ultrasonic heat me*ter measurements caused by impurities of water based on ultrasonic attenuation
2015-02-16SHIShuo石硕LIUZhenggang刘正刚SUNJianting孙建亭ZHANGMin张敏DUGuangsheng杜广生LIDong李冬
SHI Shuo (石硕), LIU Zheng-gang (刘正刚), SUN Jian-ting (孙建亭), ZHANG Min (张敏),DU Guang-sheng (杜广生), LI Dong (李冬)
1. School of Energy and Power Engineering, Shandong University, Jinan 250061, China
2. Key Laboratory of Renewable Energy Utilization Technology of National Education Ministry, Shandong Jianzhu University, Jinan 250001, E-mail: shishuo@sdjzu.edu.cn
Study of errors in ultrasonic heat me*ter measurements caused by impurities of water based on ultrasonic attenuation
SHI Shuo (石硕)1,2, LIU Zheng-gang (刘正刚)1, SUN Jian-ting (孙建亭)1, ZHANG Min (张敏)1,DU Guang-sheng (杜广生)1, LI Dong (李冬)1
1. School of Energy and Power Engineering, Shandong University, Jinan 250061, China
2. Key Laboratory of Renewable Energy Utilization Technology of National Education Ministry, Shandong Jianzhu University, Jinan 250001, E-mail: shishuo@sdjzu.edu.cn
(Received September 28, 2014, Revised December 16, 2014)
Impurity is one of the main factors that affect the measurement accuracy of an ultrasonic heat meter. To study the effects of different impurity species and concentrations on the accuracy of heat meters, flow tests were carried out for the suspending of calcium carbonate and yellow mud. By analyzing the attenuation characteristics of the ultrasound amplitude in different impurity concentrations and species, the influence of the impurities on the heat meter measurement accuracy is evaluated. In order to avoid the inaccuracy caused by the sediment of the reflective bottom surface, a vortex generator is put ahead of the reflective surface. According to the test, the calcium carbonate suspension with a mass concentration of 1%, which influences the heat meter accuracy severely, is used as the flow media. The influence of the vortex generator on the calcium carbonate suspension flow field in the heat meter body is studied with numerical simulations. The results of this paper provide some theoretical guide on improving the heat meter measurement accuracy when the water contains impurities.
impurities, ultrasonic heat meter, amplitude attenuation, measuring error, experiment study
Introduction
With the development of Chinaʼs energy conservation and emission reduction, new requirements are put forward for heat metering. The Chinese State Council promulgated a policy of “Speed up the development of energy saving and environmental protection industry”, which indicates clearly that China must implement the policy of household heat metering in new buildings and promote heat metering and energy efficiency renovations in the existing residential heating system. Ultrasonic heat meters are widely applied in China for its predominant advantages such as high accuracy, no moving parts, small pressure loss, easy installation and maintenance. But because of the poor heating water quality in China, the solid impurity in the water is one of the main problems that influence the heat metering accuracy. The ultrasonic wave propagation and attenuation in the water containing impurities is the basis of exploring the influence of impurities on the errors of the ultrasonic heat meter measurements and of improving the ultrasonic measurement accuracy under actual working conditions.

Fig.1 Schematic diagram of the flow measurement
Ultrasonic heat meter involves the calculation of the velocity of the fluid by measuring the time diffe-rence of the ultrasonic wave transmission in the downstream and the upstream. The structure of the U-type ultrasonic heat meter is shown in Fig.1. Two reflective surfaces are in symmetrical positions, and the angle between the eflective surface and the horizontal line is 45o. Transducers A and B can not only emit ultrasonic pulses, but also receive ultrasonic signals, When the transducer A is in the state of emitting, the transducer B is in the state of receiving, the downstream transmission time 1t can thus be determined, when the transducer B is in the state of emitting, the transducer A is in the state of receiving, we can determine the upstream transmission time2t So the transmission time difference between the downstream and the upstream Δt is t2-t1. If the transmission velocity of the ultrasound in a static fluid is constant, the velocity of the fluid can be obtained as
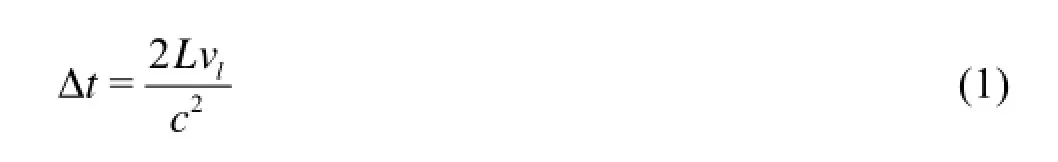
where c is the ultrasonic velocity in the medium, L the propagation distance in the flow direction,lv the average linear velocity of the flow.
When the ultrasonic wave travels in the medium,the wave energy decreases gradually with the increase of the transmission distances, and this phenomenon is called the ultrasonic attenuation, which includes the diffusion attenuation, the scattering attenuation and the absorption attenuation. The diffusion attenuation is mainly due to the non-planar sound wave propagation,which only depends on the geometry of the sound source rather than the transmission medium. The scattering attenuation is mainly due to the impurity in the water, which makes some parts of the sound waves to scatter and is influenced by the shape, the size, the quantity of the scattering particle, as well as the nature of the scattering particles and the medium. The absorption attenuation is mainly due to the internal friction between the particles caused by the medium viscosity,so that a part of sound energy turns into heat energy. Besides, the heat conduction and the relaxation caused by the microscopic process also lead to the sound energy consumption. When the water contains impurities,because of the influence of gravity and the interactions between the impurity particles and the fluid, the distribution of impurities is often uneven. Thus the ultrasonic attenuation mechanism is very complicated in the water containing impurities. The ultrasonic signal intensity, the transmission depth and the amplitude are affected by the impurities, so the waveform changes and the measurement accuracy is decreased.
The ultrasonic attenuation in the fluid containing impurities was extensively studied. Spelt et al.[1]used an effective-medium model to predict the attenuation in solid-liquid systems. Carlson and Martinsson[2]presented a simple theoretical model to predict the sound attenuation due to particles. Baudoin et al.[3]improved the coupled phase theory to consider the polydisperse suspensions using an effective medium and the selfconsistent theory. Galaz et al.[4]performed two-dimensional finite-difference time domain simulations in suspensions of polystyrene, which were validated by experiments. Richards et al.[5]developed a reverberation technique for measuring the ultrasonic absorption. In the field of ultrasonic flow metering, Inoue et al.[6]improved the precision of the time difference ultrasonic flow meter measurement by changing the incident angle of the ultrasonic pulse, Ruppel and Peters[7]found a unique assignment between the flow pattern and the error shift in an experimental study. An initial process based on the cross-correlation method was developed by Brassier et al.[8], which validated the choice of the high working frequency. Wang and Tang[9]reduced the errors caused by the inertia delay and the amplitude attenuation by a novel method. A two path ultrasonic gas flowmeter was designed by Chen et al.[10]to eliminate the influence caused by the inherent switch time. Takamoto et al.[11]developed a very small ultrasonic flowmeter for liquids,which can be used to measure the liquid flow rate below 1 ml/min. Liu et al.[12], Liu et al.[13], Liu[14],Lynnworth and Liu[15]also made some progress in the heat meter accuracy improving research. Impurities in the fluid can seriously influence the measurement accuracy of an ultrasonic heat meter, but the influence of impurities on the measurement error is not well studied. In this paper, we study the errors of the heat meter measurement and the variations of the ultrasonic wave amplitude caused by different impurities in the fluid, both theoretically and experimentally.
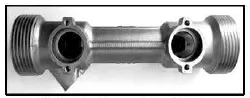
Fig.2 The ultrasonic heat meter

Fig.3 Outline of flow test device
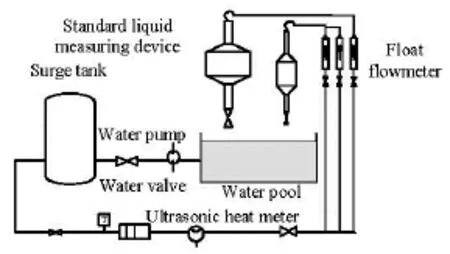
Fig.4 Sketch of flow test device structure
1. Experimental setup and method
The nominal diameter of the U-shaped time-difference-type ultrasonic heat meter considered in this paper is 0.025 m, as shown in Fig.2. The experimental device is consistent with the "ultrasonic flowmeter verification regulations”. The appearance of the device and the principle diagram of the structure are shown in Fig.3 and Fig.4. The size of the water tank is 2.44 m× 1.24 m×0.40 m, the water pump is driven by a Y90L-2 electric motor, 2.2 kW, the LZB series of glass rotameters of diameters of 0.015 m, 0.025 m and 0.050 m are taken as the standard flowmeters. The accuracy class of the experimental set is 0.5. The tested heat meter is installed approximately 10 pipe diameters downstream and 5 pipe diameters upstream of the pipe.
In this experiment, the calcium carbonate and the yellow mud were added, respectively into the water as impurities, the calcium carbonate is analytically pure white powders, with density of 7.27×10⁴kg/m3, and the size of nearly all particles is less than 10 microns. The yellow mud is taken from the Yellow River and the big grit and sand rocks were filtered out. Its density is 1.8×10³kg/m3. The impurities were put into the water pool according to a specified mass concentration. Results of the composition analysis reveal that the solid impurity content in the heating pipeline is 0.0028%, so 0.0028% is used as the initial measurement concentration of the calcium carbonate.
The measurement accuracy of the DN25 heat meter is tested while the clean water, the water with different concentrations of calcium carbonate and yellow mud suspension flow through the heat meter. According to the test standard of the DN25 heat meter,the heat meter is tested when the instantaneous flow rate is 0.07 m3/h, 0.14 m3/h, 0.35 m3/h, 1.05 m3/h and 3.5 m3/h, respectively. The impurities are distributed evenly by manual mixing. The impure fluid in the tank is driven by a pump, and it flows sequentially through the surge tank, the ultrasonic heat meter, the glass rotameter and then into the standard measuring container. The instantaneous flow rate is adjusted by the rotameter valve. The total valve opens to start testing, the ultrasonic heat meter starts its measurements after the flow volume is set at zero, and the valve closes to end testing when the standard liquid measuring device reaches the test volume, then the accumulated flow volumes of the ultrasonic flow meter and the standard measuring container are recorded. The test for each suspension is repeated four times, each at the same test flow point to avoid the random error. The relative error of the ultrasonic heat meter is calculated by
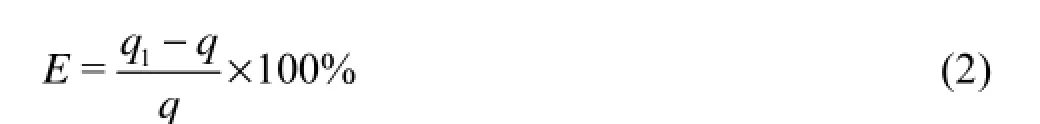
where 1q is the accumulated flow volume of the ultrasonic heat meter, q the reading of the standard measuring container. In order to analyze the ultrasonic attenuation in the tested suspensions, the oscilloscope is used to record the waveform change while reading the error.

Fig.5 Relative error of calcium carbonate suspensions at different concentrations

Fig.6 Relative error of yellow mud suspensions at different concentrations
2. Experimental results and analyses
The flow relative error of the ultrasonic heat meter at different instantaneous flow rates varies with the mass concentrations of the calcium carbonate and the yellow mud, as shown in Fig.5 and Fig.6. The abscissa is the mass percent concentration of the impurity, and the ordinate is the relative error of the ultrasound heat meter. To see the repeatability when theerror is bigger, four measurement results when the instantaneous flow rate is 0.07 m3/h are shown in Table 1.

Table1 Relative error of repeated measurements (Flow rate: 0.07 m3/h)
2.1 Effects of the concentration
When the mass concentration of the calcium carbonate and the yellow mud is less than 0.5%, the effect of impurities on the error of the ultrasonic heat meter measurement is small, within a reasonable error range of 2%, when the impurity concentration is above 0.5%, the measurement error exceeds 2% as shown in Figs.5,6. These data suggest that the critical concentration within the error limitation is 0.5%.
2.2 Effects of concentration at different flow rates
As the instantaneous flow rate decreases, the effect of the impurity’s concentration on the measurement error increases. When the test flow rate is above 0.35, the relative error of the heat meter is nearly unchanged, and the accuracy requirements can be met. But when the flow rate is 0.07 m3/h and 0.14 m3/h,and the mass concentration is more than 0.5%, a great error would be made by the heat meter.
2.3 Effects of different impurities
From Fig.5 and Fig.6, it can be seen that at the same mass concentration and the same instantaneous flow rate, the error for the case of the calcium carbonate is more severely influenced by the impurity concentration than for the case of the yellow mud.
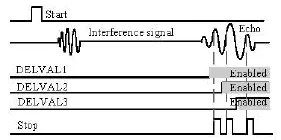
Fig.7 Enable signal of STOP channel
2.4 Repeatability of measurement results
As the concentration increases, the relative errors during repeated measurements at a small flow rate greatly increase and the results become disordered, such as, when the concentration of the calcium carbonate is 1%, and the flow rate is 0.07 m3/h, the error fluctuates between -1.45% and 11.35%, the measurement becomes very unstable, as shown in Table 1.
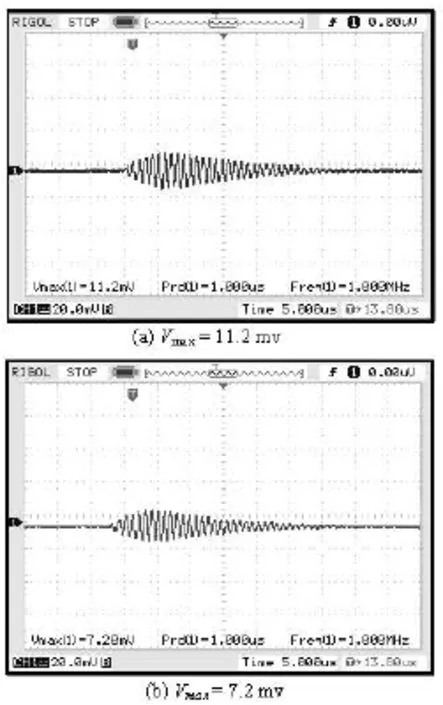
Fig.8 Ultrasonic echo waveform
The errors come from the characteristics of the chips of the ultrasonic heat meter, which are used to record the measurement time difference and the ultrasonic attenuation in the water with impurities. In this experiment, we use the ultrasonic heat meter with the integrated TDC-GP2[16]chip to measure the transmit time based on the propagation delay of the signal through the gate circuit with high accuracy, the minimum time can be measured by the gate circuit is 65 ps. The main time measurement framework is shown in Fig.7. After the propagation, the sound waves are received by the receiving transducer and are transferred into electrical signals. The received waveform is similar to a sine wave. The amplitude of the waveform increases from zero to the maximum and then decays slowly, as shown in Fig.8. The threshold testing me-thod is used to stop the signal detection, which means that the TDC-GP2 stops receiving the signal when the pulse voltage reaches the original setting.
The time interval between the point of the ultrasonic signal being launched by transducer A and the corresponding point of the echo signal being received by transducer B is the ultrasonic transmission time. This measurement approach requires an accurate reference point in a pulse cycle, so the waveform of the received electrical signals must be very neat and regular.

Fig.9 Schematic diagram of enlarged waveform

Fig.10 maxV of ultrasonic echo waveform
A comparison of the two experiment oscilloscope waveform screenshots of the ultrasonic echo voltage amplitude attenuated from 11.2 mV to 7.2 mV is shown in Fig.8. For the waveform of Vmax=11.2 mV , it can be seen from the diagram that each pulse wave of the waveform of Vmax=7.2 mV attenuates. An amplification of the waveform near the acquisition points is shown in Fig.9, with the dotted line representing the threshold. In Fig.9 it can be seen from the waveform (a), that the signal receiving point of the wave threshold is postponed, which causes a deviation 11tt′-. As shown in Fig.10, for the waveform (b), if the voltage attenuates to a value below the threshold,the second sine wave can not be captured until the third sine wave comes, then the time delay 11tt′′- lasts nearly a cycle.
The ultrasonic velocity in the static water is about 1 450 m/s, the horizontal distance between the ultrasonic transducers is 0.080 m, the diameter of the heat meter is 0.017 m, the velocity of the fluid is 0.086 m/s and the testing flow rate is 0.07 m3/h, then the time difference between the ultrasonic downstream and upstream is 0.00654 μs according to formula 1. When the transmitting frequency is 1 MHZ and the vibration period is 1 μs, for the time difference between the downstream and upstream t2-t1, any tiny changes of time difference have a great effect on the measured results. When the oscilloscope voltage amplitude attenuates from 11.2 mV to 7.2 mV, the measurement downstream travel time1t′ differs from the true value of1t by about 0.0008 μs, if the error of the downstream travel time2t′ can be ignored, the measurement error tΔ reaches –12%, whereas if the error of the downstream travel time1t can be ignored and the measurement downstream travel time1t′ differs from the true value of1t by about 0.0008 μs, the error tΔ reaches 12%. The error will fluctuate between -12% and 12% if there are some varying degree measurement time deviations both in1t and2t. When the concentration of impurities is higher, the ultrasonic amplitude attenuation is greater. Both1t′ and2t′ have deviations. As the distribution of impurities is uneven in the flow of the impurity water, the amplitude attenuation levels of the downstream travel and the upstream travel are different, so the measurement time difference tΔ fluctuates and the error becomes greater and at the same time, the repeatability gets worse. For a high flow rate, tΔ increases according to the formula 1. For the measurement point 3.5 m3/h, the normal time difference is about 0.327 μm, for the small deviation of1t′ of 0.0008 μs, the relative error is about 0.24%,so it is almost not influenced by the concentration in the experiment.
The density of the calcium carbonate is larger than that of the yellow mud, so the calcium carbonate subsides faster under gravity and is more uneven at the same concentration. Therefore, the calcium carbonate is easier to deposit on the reflectors, to have a great influence on the reflectors. So, with the calcium carbonate, apparently the measurement results are affected in a greater extent at a same concentration.
The oscilloscope figure of the voltage amplitude against the impurity concentration is shown in Fig.10. When the impurity concentration is greater than or equal to 0.5%, the maximum voltage signal of the receiving wave attenuates to a point below 8.8 mV,which explains the causes that the large error appears when the impurity concentration is greater than 0.5%. It can also be seen that with the change of the concentration, the maximum voltage of the carbonate calcium attenuates faster, which agrees with the experiment result that the error with the use of the calcium carbonate is larger at the same concentration.

Fig.11 The structure of V-type ultrasonic heat meter and the position of coordinates
3. The study of vortex generator in improving V type heat meter accuracy
The structure of the “V” Type heat meter is shown in Fig.11. The mounting holes of the ultrasonic transducer are symmetrically arranged, with the angle between the reflection line and the horizontal line beingo45. The bottom surface is taken as the reflection surface. The acoustic signal emitted by the transducer is received by the other transducer after the reflection from the bottom. Because there is no other reflection surface, the structure of the V type heat meter is simple and it does not affect the flowing field. But various granular impurities, flocs, etc in the heat pipe will deposit in the bottom of the reflection surface after long time working, which can influence the accuracy of the measurement. In order to eliminate the effects of the sediment, a vortex generator is put in the rectangular channel of the heat meter body. One important function of the vortex generator is to stir up the flow in the separate division through a trailing vortex. The impurities on the reflection surface are washed off by the downwash and the upwash of the vortex, to keep the reflection surface clean.

Fig.12 The sketch of vortex generator
Numerical simulations are carried out for the triangle, rectangle and trapezoid vortex generators. The k coefficient[13]distribution and the standard deviation of the k coefficient are taken as the judgment basis of the vortex generator function. Triangle is selected for its k coefficient stabilization according to the results. The purpose of the vortex generator is to wash the reflection bottom surface and it should not hinder the transmission of the ultrasound. The installation range of the vortex genetator and the coordinate system of the flow field are shown in Fig.12, and the center of the origin of the coordinate is at the rectangular duct center.

Fig.13 Grids on the ultrosonic heat meter with votex generator

Table2 kcoefficient result of simulation and experiment

Fig.14 Velocity vector of -zcoordinate surface
In order to ensure that the flow field of the heat meter is stable, a pipe of diameter of 10 and a pipe of diameter of 5 are put on the front and the rear of the heat meter, respectively, as shown in Fig.13. The mass concentration of the calcium carbonate is 1% and the particle size is 10 μm, which is substituted for the impurities in the hot water. Because the volume fraction of the impurities is less 10%, so the Euler-Lagrange method is used in the analysis of the fluid field. TheCFD software-Fluent is used to simulate the flow of the body meter. The discrete phase model (DPM)[17,18]and the -kε turbulence model are applied to simulate the trajectory of the solid particles and the flow field of the continuous phase, respectively. The coupling calculation and the unsteady tracking are adopted to simulate the discrete phase.
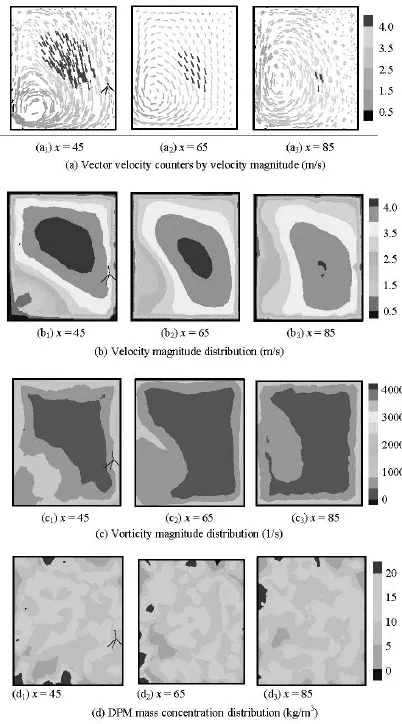
Fig.15 Flow field at different -xcoordinate surfaces
To verify the reliability of the numerical simulation, the simulation result of the k coefficient is compared to the flow test experiment as shown in Table 2. k is calculated by wheresv is the profile average velocity on the pipe cross-section andlv is the linear average velocity in the reflection path. The result shows that k of the simulation result agrees well with that of the experiment,thus, the above calculation method is validated.

Figure 14 shows the flow field in the heat meter body. The oblique line in Fig.14 is the vortex generator. It can be seen from Fig.14 that at the surface =z -6, which is near the bottom, there are eddies surrounding the reflective area. The mass concentration of the DPM particles (orDPMBρ, for short) decreases because of the influence of the vortex. Larger vortexes are generated on the right side of the vortex generator.The effect of the vortex gradually weakens from left to right.
In order to study the scouring effect of the vortex on the reflection surface, results at the back of the vortex generator in x direction are compared, including the places next to the vortex generator, in the reflection area and the far away area. The velocity vector and contours of the vorticity magnitude are shown in Figs.15(a), 15(b). =45x is the place near the vortex generator. It can be seen that the flow field changes greatly and large vortexes are generated. =65x is the place in the area of the reflection surface, the vortex there expands. The closer it is to the bottom, the stronger the vorticities will be. This indicates that the ability of the vortex carrying impurities increases around the bottom surface. So impurities can be washed out. The place of =85x is far from the vortex generator. As can be seen, the swirl strength decays, the flow field becomes steady again. Combining with Fig.15, it is evident that the vortex affected area is within some limits. As the distance x increases, the effect of the vortex weakens in both length and height. It means that the vortex generator will not influence the area at the back of the reflection surface very much, while the vortex washes the reflection surface. The contour of the DPM mass concentration is shown in Fig.15(d). It is evident that the impurities at the bottom surface x=65 are decreased compared with those at x=45. The particles move upward from the bottom, as are influenced by the vortex. As a result, the upward movement of the surface particles is enhanced. It also confirms the flushing ability of the vortex.
4. Conclusion
In this paper, experiments are carried out to study the ultrasonic transmission error in the fluid with different impurities. Because the ultrasonic wave attenuates differently in different kinds and concentrations of impurity water, the time difference measured by the ultrasonic heat meter would involve large errors. Experiments show that when the mass percentage concentrations of the calcium carbonate and the yellow mud are less than 0.5%, the measurement error is within the allowance. When the concentration is above 0.5%, the error of the ultrasonic heat meter increases and the results become unstable, which means that the measurement can not be made normally. At the same concentration, the distribution of the calcium carbonate is more uneven due to the deposit feature,so the resulted error is larger than that caused by the yellow mud. The amplitude changes at different concentrations suggest that when the maximum voltage of the amplitude signal is less than 8.8 mV, the error will go beyond the normal precision requirement. For the bottom surface sediment, a vortex generator is put in the heat meter and the flow field is simulated. Simulation results show that the vortex generator can produce a large vortex near the reflection bottom surface and will not influence the results in far away areas. So it can decrease the sedimentation on the reflection surface effectively.
[1] SPELT P. D., NORATO M. A. and SANGANI A. S. et al. Attenuation of sound in concentrated suspensions:Theory and experiments[J]. Journal of Fluid Mechanics, 2001, 430: 51-86.
[2] CARLSON J., MARTINSSON P. E. A simple scattering model for measuring particle mass fractions in multiphase flows[J]. Ultrasonics, 2002, 39(8): 585-590.
[3] BAUDOIN M., THOMAS J.-L. and COULOUVRAT F. et al. An extended coupled phase theory for the sound propagation in polydisperse concentrated suspensions of rigid particles[J]. The Journal of the Acoustical Society of America, 2007, 121(6): 3386-3397.
[4] GALAZ B., HAÏAT G. and BERTI R. et al. Experimental validation of a time domain simulation of high frequency ultrasonic propagation in a suspension of rigid particles[J]. The Journal of the Acoustical Society of America, 2010, 127(1): 148-154.
[5] RICHARDS S. D., LEIGHTON T. G. and BROWN N. R. Sound absorption by suspensions of nonspherical particles: Measurements compared with predictions using various particle sizing techniques[J]. The Journal of the Acoustical Society of America, 2003, 114(4):1841-1850.
[6] INOUE Y., KIKURA H. and MURAKAWA H. et al. A study of ultrasonic propagation for ultrasonic flow rate measurement[J]. Flow Measurement and Instrumentation, 2008, 19(3-4): 223-232.
[7] RUPPEL C., PETERS F. Effects of upstream installations on the reading of an ultrasonic flowmeter[J]. Flow Measurement and Instrumentation, 2004, 15(3): 167-177.
[8] BRASSIER P., HOSTEN B. and VULOVIC F. Highfrequency transducers and correlation method to enhance ultrasonic gas flow metering[J]. Flow Measurement and Instrumentation, 2001, 12(3): 201-211.
[9] WANG X. F., TANG Z. A. A novel method for digital ultrasonic time-of-flight measurement[J]. Review of Scientific Instruments, 2010, 81(10): 105112.
[10] CHEN Q., LI W. and WU J. Realization of a multipath ultrasonic gas flowmeter based on transit-time technique[J]. Ultrasonics, 2014, 54(1): 285-290.
[11] TAKAMOTO M., ISHIKAWA H. and SHIMIZU K. et al. New measurement method for very low liquid flow rates using ultrasound[J]. Flow Measurement and Instrumentation, 2001, 12(4): 267-273.
[12] LIU Yong-hui, DU Guang-sheng and TAO Li-li et al. Study on the influence of ultrasonic reflection device on the flow characteristics of ultrasonic flowmeter[J]. Chinese Journal of Scientific Instrument, 2011, 32(5):1183-1188(in Chinese).
[13] LIU Zheng-gang, DU Guang-sheng and SHAO Zhufeng. The direct numerical simulation of pipe flow[J]. Journal of Hydrodynamics, 2013, 25(1): 125-130.
[14] LIU Zhuang. Design and implementation of an ultrasonic heat meter beam pipe[J]. China instrumentation, 2014, (4): 20-22(in Chinese).
[15] LYNNWORTH L. C., LIU Y. Ultrasonic flowmeters:Half-century progress report, 1955-2005[J]. Ultrasonics, 2006, 44(Suppl.): e1371-e1378.
[16] YAO Bin-bin, ZHANG Hong-jian and TANG Xiao-yu et al. Method of ultrasonic flow rate measure based on delta-T and TDC-GP2[J]. Automation and Instrumentation, 2011, (8): 17-20(in Chinese).
[17] SUN Peng-wen, WANF Fei and YAN Jin-shun et al. Simulation and analysis on horizontal flow separating field of urban garbage based on DPM[J]. Journal of Inner Mongolia University of Technology, 2013,32(2): 101-106(in Chinese).
[18] RU Xiao- long, ZHOU Tao and WANG Ze-lei et al. Simulation of PM1particles deposition in the narrow vertical rectangular channel[J]. Journal of Safety and Environment, 2013,13(4): 74-78(in Chinese).
10.1016/S1001-6058(15)60466-8
* Project supported by the National Natural Science Foundation of China (Grant No. 51276102), the Natural Science Foundation of Shandong Province (Grant No. ZR2014EEM015,ZR2011EEM011.)
Biography: SHI Shuo (1980-), Female, Ph. D. Candidate,Lecturer
DU Guang-sheng,E-mail:du@sdu.edu.cn
猜你喜欢
杂志排行

水动力学研究与进展 B辑的其它文章
- 3-D numerical investigation of the wall-bounded co*ncentric annulus flow around a cylindrical body with a special array of cylinders
- Application of support vector machine in drag reduction effect p*rediction of nanoparticles adsorption method on oil reservoir’s micro-channels
- Numerical research on the performances of slot hydrofoil*
- Numeri*cal simulation of 3-D water collapse with an obstacle by FEM-level set method
- Ferrofluid measurements of bottom velocities and shear stresses*
- Flow choking characteristics of slit-type energy dissipaters*