Multi-parameter Sensitivity Analysis and Application Research in the Robust Optimization Design for Complex Nonlinear System
2015-02-07MATaoZHANGWeigangZHANGYangandTANGTing
MA Tao*,ZHANG Weigang,ZHANG Yang,and TANG Ting
State Key Laboratory of Advanced Design and Manufacturing for Vehicle Body,Hunan University,Changsha 410082,China
1 Introduction*
Each product or system is designed for the use of certain requirements,product in its life cycle should keep its function steadily[1].In practical engineering,the performance of a product or system is not only influenced by the design parameters,but also affected probably by boundary conditions.If a product is a dynamic nonlinear complex system,then system performance usually varies to a great extent.Therefore,robust design is necessary to be considered for complex nonlinear system[2].
In the past several decades,a lot of research works have been done about the robust analysis of high dimensional nonlinear systems,and significant results have been achieved.For example,PIET,et al[3]and YAN,et al[4],first studied the probability distribution of all design parameters,and tested point by point through the design space using Monte Carlo method and finally got the robust solution of a nonlinear system.LOCKE,et al[5],proposed a useful strategy using Sobol sampling and simulated annealing method.ALVES,et al[6],presented a random search for kinetic parameters to find all plausible models.STELLING,et al[7],explored the two-dimensional spaces to all kinetic parameters.Although their research works made a great step for approaching to global analysis,there were still limitations due to the calculation complexity.WAGNER[8]performed the Monte Carlo simulation for dynamic models to simulate a target function by randomly perturbing all parameters,but the huge computational resource with an increase in the numbers of all parameters is hard to accept.OKUYAMA,et al[9],presented a method of the robust stability condition for sampled-data control systems,but it is applicable only to the sampled-data control system.KIM,et al[10],applied the complex-step method in nonlinear robust performance analysis,the accuracy of the solutions seemed to be significantly better than those achieved using gradient approximation methods.However,it needs cost function of dynamical systems,and it's not suitable for all nonlinear systems.KÖKSOY[11]proposed a nonlinear programming solution to solve robust quality problems,but sometimes the accuracy of the estimated models is not satisfied.YANG,et al[12],first used T-S fuzzy models to describe complex nonlinear systems,and then investigated the global robust stability of T-S fuzzy models.ZHANG,et al[13],put forward moderate sensitivity matrix of a system and use Taylor expansion to solve the optimal problem for the robust design of a nonlinear system with analytical formulations.However,for many complex nonlinear mechanical systems,it cannot be found out exact mathematical expressions to reflect the relation between the output responses and design variables.Furthermore,with the increase of the number of design parameters,the costs of the calculation rise sharply while the computational efficiency declines heavily.With the development of sensitivity analysis methods in recent years,a lot of researches have been done to evaluate the importance of parameters by calculating the sensitivity and uncertainty of parameters[14-16].DOODMAN,et al[17],achieved further progress,they investigated the use of global sensitivity analysis(GSA)and harmony search(HS)algorithm for design optimization of air cooled heat exchangers(ACHEs).GSA was performed to identify the non-influential parameters,then HS algorithm was applied to the optimization of relatively influential parameters.Finally,the robust stochastic approach was achieved.
In this paper,general global sensitivity analysis is replaced by sensitivity analysis based on grouped variables which needs less computation time.By analyzing the sensitivity and uncertainty of design parameters based on grouped variables,the importance of parameters is evaluated by calculating the contribution of each parameter to the total variance of the response.The surrogate model of the system is established by using important variables and the accuracy is verified.Finally,robust optimization design is conducted and an example is given out to show the effect of the new method.
2 Multidimensional Sensitivity Analysis Using Group Sensitivity
2.1 Global sensitivity analysis
There are two kinds of sensitivity analysis methods,one is local sensitivity analysis and the other is global sensitivity analysis.Local sensitivity analysis is simple and easy to realize,but not suit for high dimensional and nonlinear system[18].Global sensitivity analysis studies the system response influenced simultaneously by all design parameters in the whole design space.The analytical methods mainly include response surface method(RSM),Fourier amplitude sensitivity test(FAST),regression analysis method(RAM)and variance-based sensitivity analysis(VBSA),among which the variance-based Sobol'method[19]is very popular and widely used in many fields.However,it is difficult to calculate the sensitivity indices by using Sobol' method directly.SALTELLI,et al[20]and TARANTOLA,et al[21],proposed a new method for global sensitivity analysis based on Monte Carlo sampling and found that the Sobol' method had better performance than Latin Hypercube Sampling(LHS),particularly in the case where there is a larger subset of inputs interacting with each other strongly.The theory of the method is as follows:
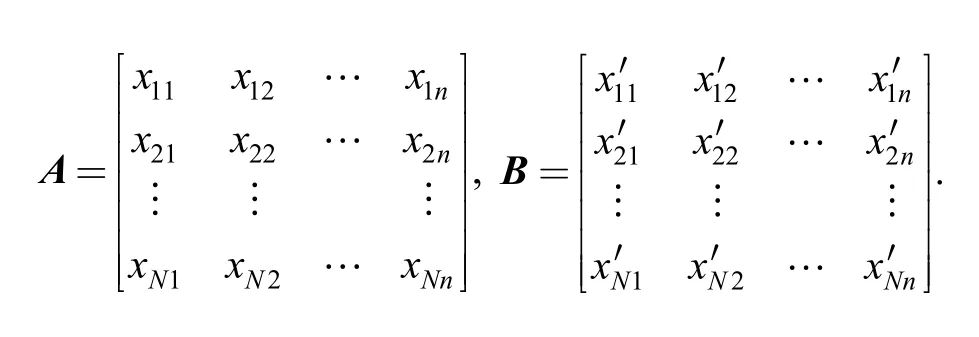
First,two input matrices A and B are generated using Monte Carlo sampling,each row of the two matrices is a set of design variables.n and N stands for the variable number and sampling number respectively.Input matrices A and B are written as
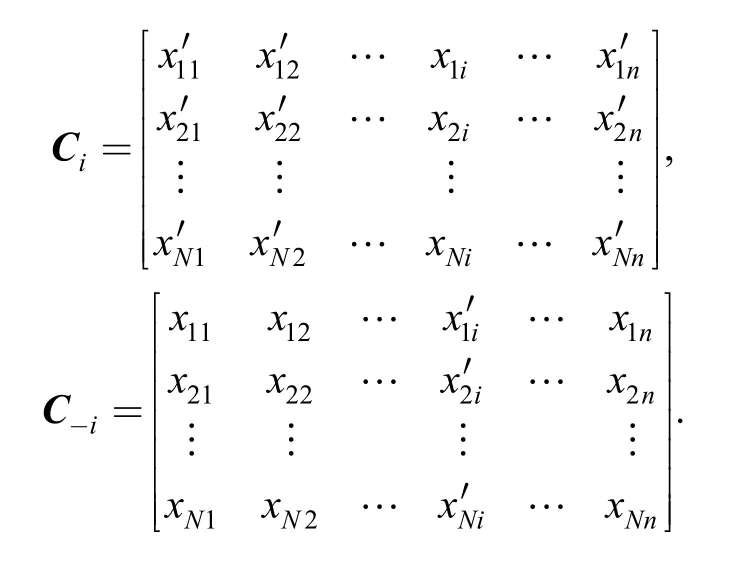
Matrix Ciis got through matrix B by replacing the ith column with the ith column of matrix A.Matrix C-iis got through matrix A by replacing the ith column with the ith column of matrix B.Matrices Ciand C-iare as follows:
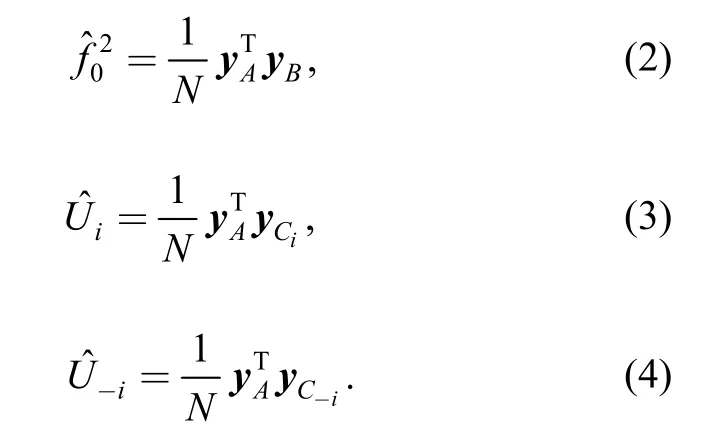
The input matrices are submitted into the model to calculate the result,and the corresponding output vectors are obtained.Vectors yA,yB,yCare the output column vectors corresponding to the input matrices.Estimations are obtained by using sensitivity analysis based on Monte Carlo method.
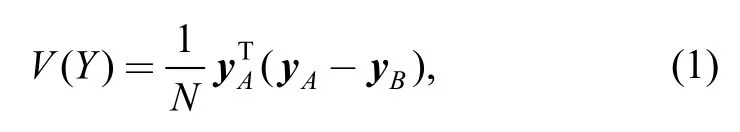
Meanwhile,
The estimation of the main effect indexof the input parameter xiis
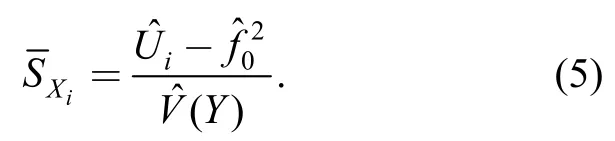
The estimation of the total effect indexof the input parameter xiis
2.2 Sensitivity analysis based on grouped variables
As to high dimensional and nonlinear system,the sensitivity indices calculation work is too huge to accept by using global sensitivity analysis method based on Monte Carlo algorithm.An effective analytical method is to decompose the system into several low-dimensional sub systems[23-24],then analysis is conducted on the low-dimensional systems.Group sensitivities strategy is an analytical algorithm based on this method,the main idea is that the related variables are divided into one group and all the groups are uncorrelated.The detailed methodology is presented below.
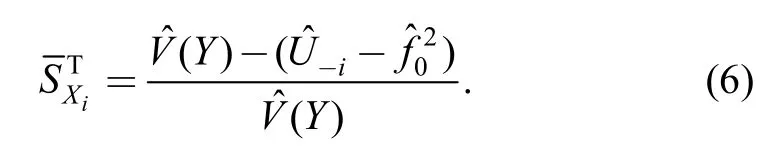
Consider that a model M can be divided into two sub models M1and M2,and sensitivity analysis is made for each model,sensitivity indicesfor M1andfor M2are computed,then sensitivity indicescan be obtained as follows.
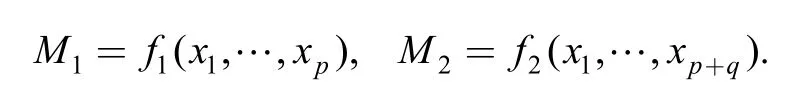
(1)Assume that all input variables are different in M1and M2,i.e.,
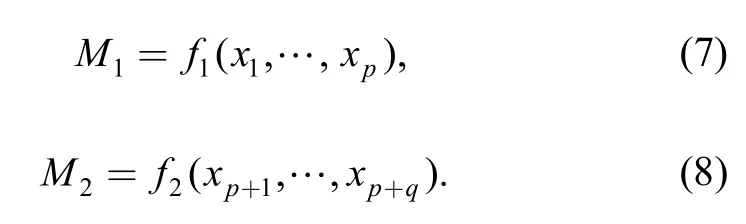
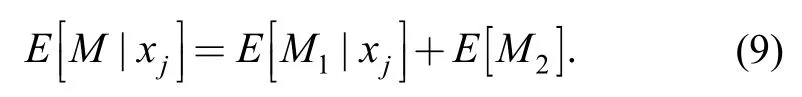
If 1≤j≤p,for xj,the conditional expectation of M can be calculated by Eq.(9):
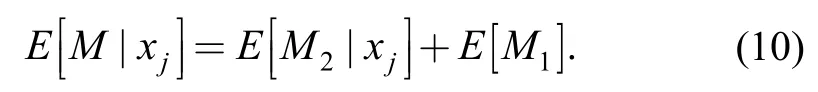
If p+1≤j≤p+q,for xj,the conditional expectation of M can be calculated by Eq.(10):
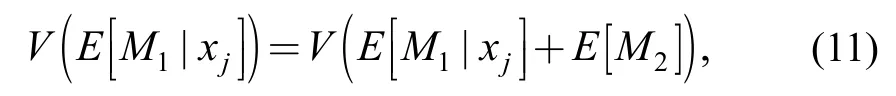
The terms E[M1]and E[M2]are constant,and thus the variance of the conditional expectation V(E[M1|xj])and V(E[M2|xj])for given xjcan be got by Eqs.(11),(12):

Thus,sensitivity indices of M can be obtained by indices of M1multiplying V(M1)/(V(M1)+V(M2))and M2multiplying V(M2)/(V(M1)+V(M2)).It is easy to verify that all sensitivity indices relative to interaction between variables of M1and M2are equal tozero.
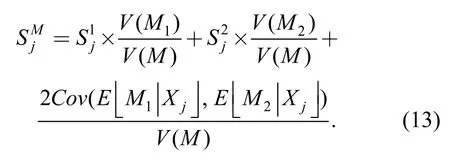
(2)Assume that models M1and M2have the same input variables,then the conditional expectation of M for given a variable xjis equal to the sum of the conditional expectation of M1and the conditional expectation of M2.Thus,the first-order sensitivity indices of M are obtained by Eq.(13):
In practice,the cost of the estimation of the covariance is very expensive as the direct estimation of sensitivity indices of M.
(2)Assume that M1and M2have part common variables,i.e.,
For the common variables,the sensitivity indices are calculated as above;and for the different variables(xp+1,…,xp+q),indices are calculated by multiplying sensitivity indices of M2with V(M2)/V(M).
3 6σ Robust Optimization Design
Robust optimization aims at developing a solution that is insensitive to variations of the nominal design,and realizes the target of optimal mean and minimum variation.In order to quantify the performance of the robust design,this paper uses 6σ as the evaluation index.6σ is a quality philosophy at the highest level relating to all processes[25].The signal σ refers to standard deviation.
The difference of robust optimization and deterministic optimization is shown in Fig.1.The x-axis represents the uncertain parameters,including design variables and noise factors,while the vertical axis represents the objective function to be minimized.If it is not considered the influence of the uncertain factors acting on the objective function,then point 1 is the deterministic optimization solution;If there is a variation of±Δx,the response will have a bigger variationΔf1in the left and a relatively flat area in the right,which is more robust for design parameter x.Point 2 is also within the design space when the design variable varies in±Δx,but the perturbation causes a much smaller change in objective function.That is to say,point 1 is highly sensitive to the parameter perturbation and usually cannot be recommended in practice,though it has a better mean value than point 2[26].
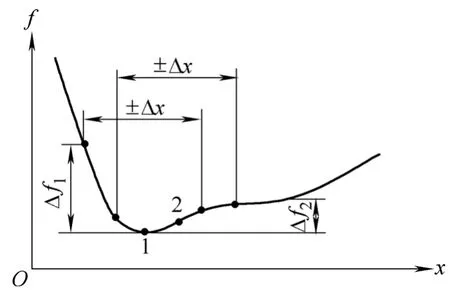
Fig.1.difference of deterministic optimization and robust optimization
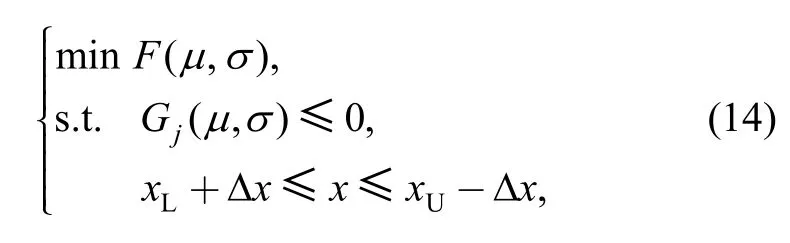
Generally,robust design can be formulated as the following reliability-based design problem of optimization.Find the set of design variables x that where x means the input parameters that may be design variables or random variables,j stands for the number of constraint function,xU,xLstand for the upper andlower specification limit of the design variables.
Both input and output constraints are formulated to include mean performance and a desired“sigma level”.
The robust design objective with optimal mean and minimum variation can be formulated as follows:
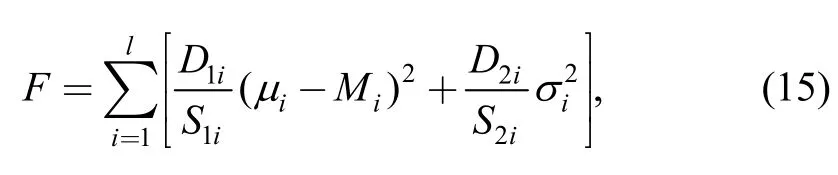
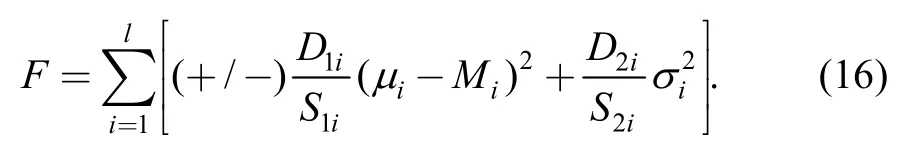
where D1iand D2iare weight factors,S1iand S2iare scale factors for the“optimal mean”and“minimum variation”respectively for response i,Miis the target for response i,and l is the number of response included in the objective.For those cases in which the mean performance is to be minimized or maximized,the objective formulation of Eq.(15)can be modified as shown in Eq.(16),where there is a“+”sign before the first term when the response mean is to be minimized,and the“-”sign when the response mean is to be maximized:
In Eq.(16),constraints can be modified as quality constraints,which mainly contain the mean value of the performance and standard variation.The quality constraints are formulated as follows:
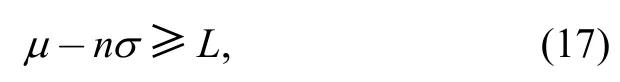
where L,U stand for lower and upper specification limit of constraints.
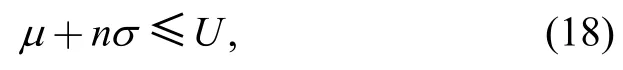
In order to get quality of sigma level,the constraints should be changed to make the system performance defined on the boundary of sigma level.Six sigma robust optimization design based on Monte Carlo technology defines n as 6.To get robust design for six sigma is to both shift and shrink a performance distribution,as illustrated in Fig.2.In Fig.2(a),given the increased reliability,the potential worst-case performance associated with the left tail may be undesirable.With the shrunken distribution of Fig.2(b),the level of reduced possible may not be sufficient to achieve an acceptable reliability level without shifting the mean performance.Only with both shift and shrink in Fig.2(c),the reliability level is achieved,and the robustness is improved[27].
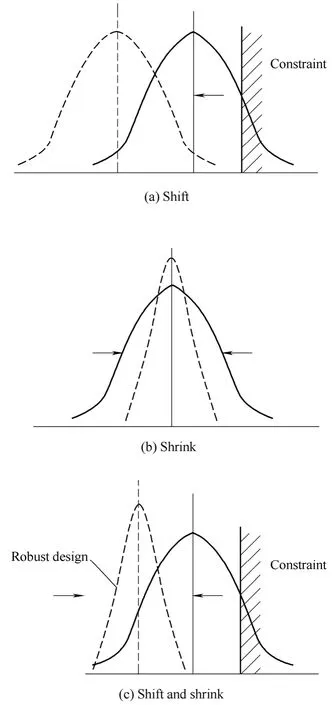
Fig.2.Design for six sigma:shift and shrink
In this article,global sensitivity analysis and robust optimization method are combined effectively.Compared with the research works others had done,general global sensitivity analysis is replaced by global sensitivity analysis based on grouped variables which needs less computation time.Then,robust optimization design is conducted on important and influential parameters.Finally,the robust design solution of complex nonlinear system is achieved.
The flow chart of the robust optimization design for complex nonlinear system is shown in Fig.3.
Fig.3.Flow chart of robust optimization design
4 Case Study
4.1 Occupant restraint system model for vehicle crash
Occupant system model is constructed for frontal impact analysis by using MADYMO software,which includes floor,steering wheel and column,seat,seat belt,airbag and Hybrid III dummy,as shown in Fig.4.
The acceleration pulse curve of the frontal crash is defined in the model,which is measured by the accelerometer mounted on the B-pillar in the crash test.The occupant injury in frontal crash involves head,chest,leg and so on,and the Weighted Injury Criterion(WIC)[28]is used to evaluate the occupant injuries,as shown in Eq.(19):
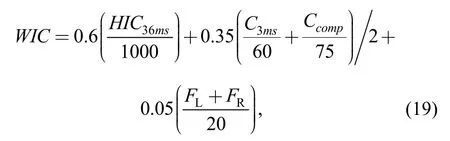
where HIC36msstands for head injury criterion,C3msis the value of chest 3ms acceleration,Ccompis the chest depression,FLis the maximum axial force on left thighbone,FRis the maximum axial force on right thighbone.
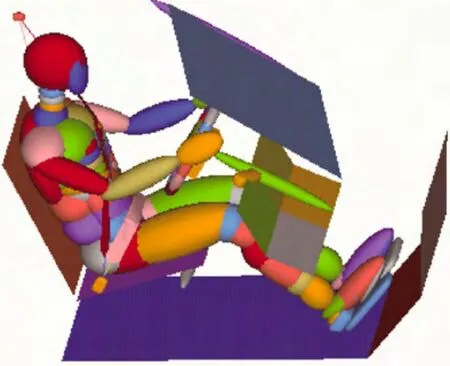
Fig.4.Occupant restraint system model
4.2 Group variables and parameter sensitivity analysis
The design variables include lock time of seat belt retractor,pre-load time,pre-load length,limited force,height of D-ring,the relative elongation of webbing,volume of airbag,coefficient of vent area,switch time and mass flow rate.Among these ten parameters,six parameters related with seat belt and are classified in one group,four parameters related with airbag and classified in another group.Global sensitivity analysis is conducted in groups of parameters.The initial value and the range of each design variable can be seen in Table 1 and Table 2.
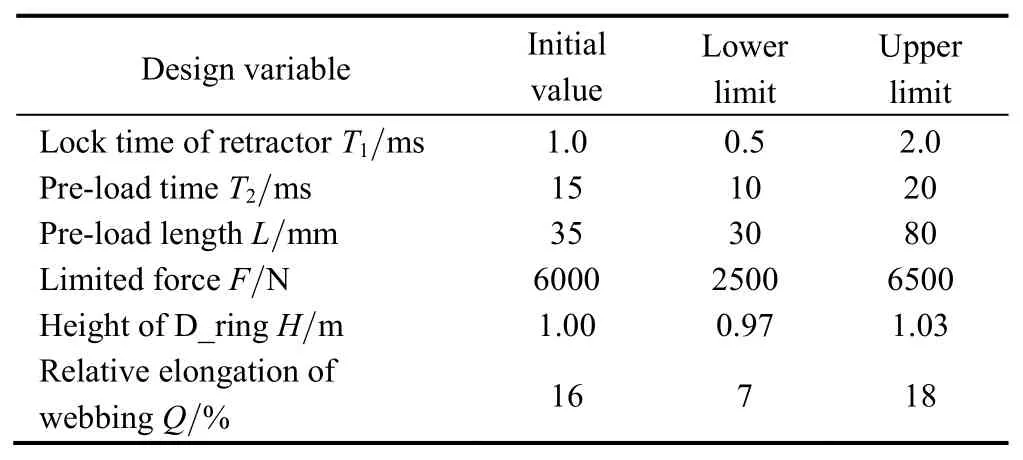
Table 1.Design range of seat belt parameters
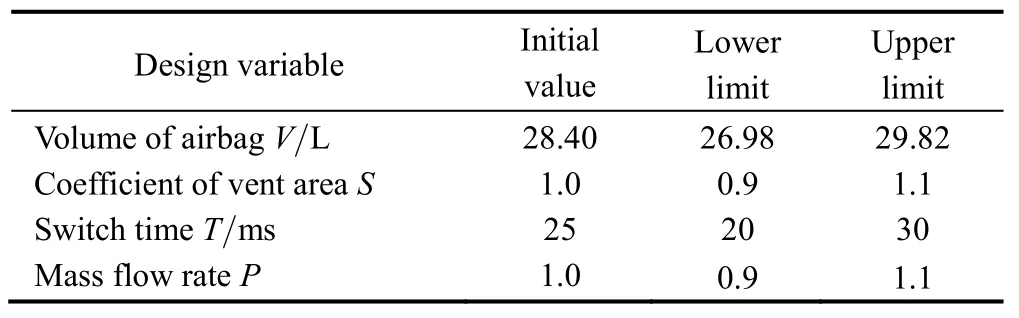
Table 2.Design range of airbag parameters
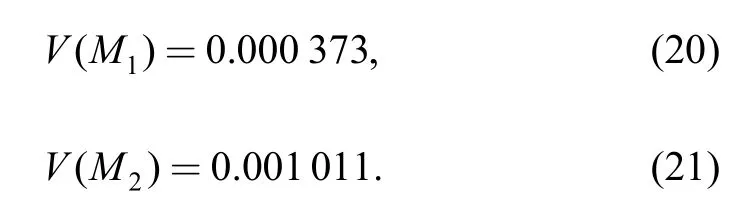
Forty points are sampled respectively in the two groups of variables and are used to construct Kriging surrogate models.After the accuracy of the surrogate models is validated,5000 samples are generated by using Monte Carlo method and sensitivity analysis is conducted to calculate the global sensitivity indices,which can be used to rank the design variables of each group on WIC.The ranking results can be seen in Tables 3 and 4.The variance of seat belt model M1and airbag model M2are calculated,as shown in Eqs.(20),(21):
And so:
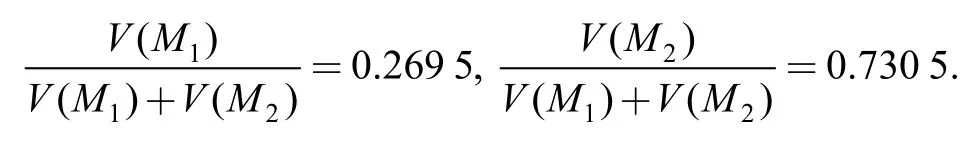
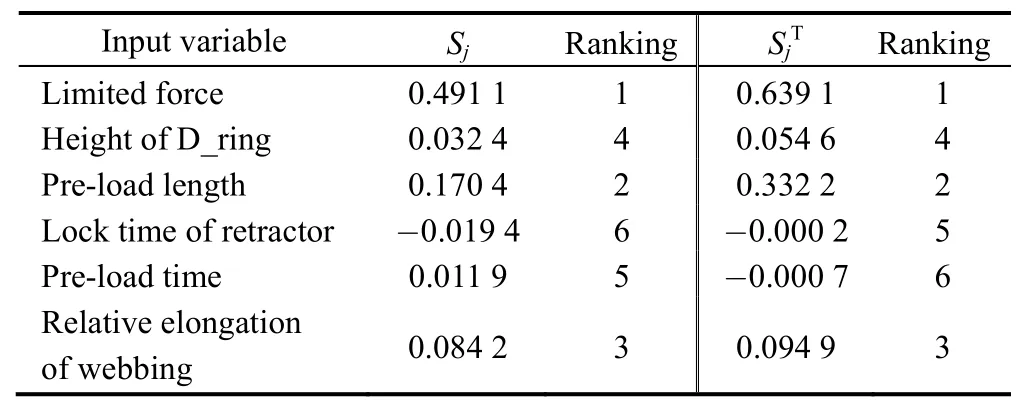
Table 3.Global sensitivity indices and ranking for seat belt design variables on WIC
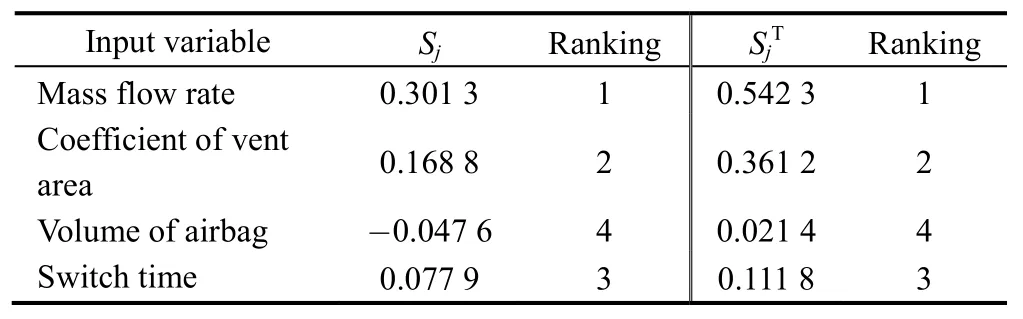
Table 4.Global sensitivity indices and ranking for airbag design variables on WIC
Total effect indices are selected to simplify the mathematical model using the method based on group variables.The parameters of total sensitivity indices ranking top four in the sensitivity analysis are chosen as design factors,which are mass flow rate,coefficient of vent area,limited force and pre-load length.The design range and associated distributions of variables can be seen in Table 5.
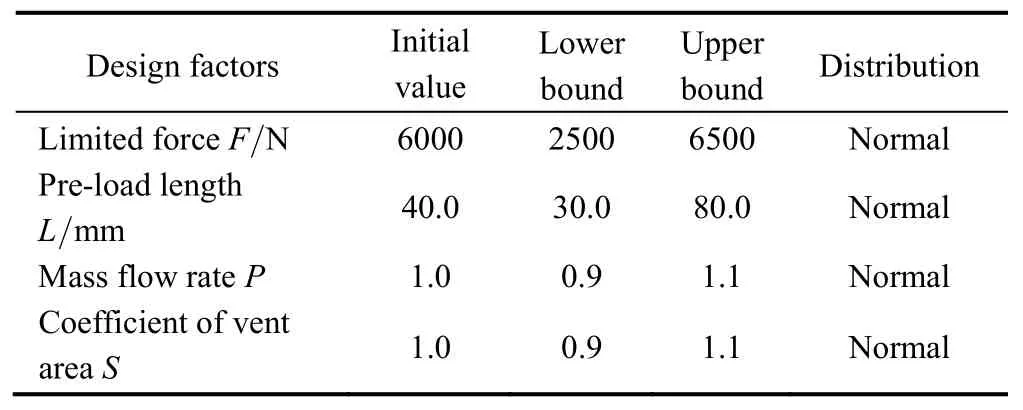
Table 5.Robust design factors and associated distributions
4.3 Robust optimization analysis
The parameters of total sensitivity indices ranking top four in the sensitivity analysis are chosen as design factors,optimal latin experimental method is used to generate 50 samples,and the results of calculation are used to build Kriging metamodel of WIC.Then six stochastic samples are chosen to check the relative absolute error,the check result indicates that the metamodel is very good and can replace the simulation model to solve the problem.
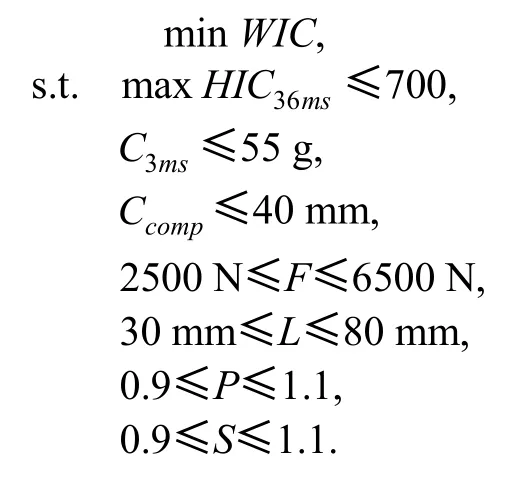
The deterministic optimization of occupant restraint system is formulated as follows:
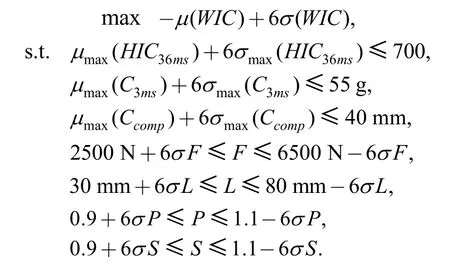
Correspondingly,6σ robust optimization model is formulated as follows:
In order to solve the robust optimization problem,Sequential Quadratic Programming is used first to get the deterministic design solution:F=6000 N,L=40.1 mm,P=0.93,S=1.09.In this study,it is assumed that the design variables follow a Gaussian normal distribution.The mean value for each variable is set to be the same as the optimal design.The standard deviations of the variables are given as 5 percent of their mean values.Then,Monte Carlo descriptive sampling is used to generate 2000 samples,6σ robust design values are obtained when the samples are calculated by using verified Kriging model.
In order to illustrate the efficiency and advantage of this method,a general dimension reduction method for reliability-based robust design is used in solving this problem.First,General global sensitivity analysis is applied to reduce the dimension of high nonlinear system.It comes out that the four parameters of coefficient of vent area,mass flow rate,limited force and pre-load length rank the top four,but the computational time is huger than the method of sensitivity analysis based on grouped variables.Then reliability-based robust design analysis is conducted on the results of general global sensitivity analysis.At last,a solution of reliability-based robust design analysis has been obtained.
The comparison of deterministic optimization,reliability-based robust design and 6σ robust optimization is shown in Table 6,from which it can be seen that,although the deterministic optimization value is better than 6σ robust optimization,the response fluctuation of objective function σ is 0.018,which means that the quality requirement is not satisfied.The WIC value of the robust optimization is relative higher than deterministic optimization,but the response fluctuation of objective function σ is reduced to 0.01,which means that the robustness of the occupant restraint system is improved obviously.Although the value WIC of reliability-based robust design is close to 6σ robust optimization,the response fluctuation of objective function σ is higher than the result of 6σ robust optimization.More computational time is used to compute the values of reliability-based robust design.All of these indicate that the new method raised in this paper is relatively effective and progressive.
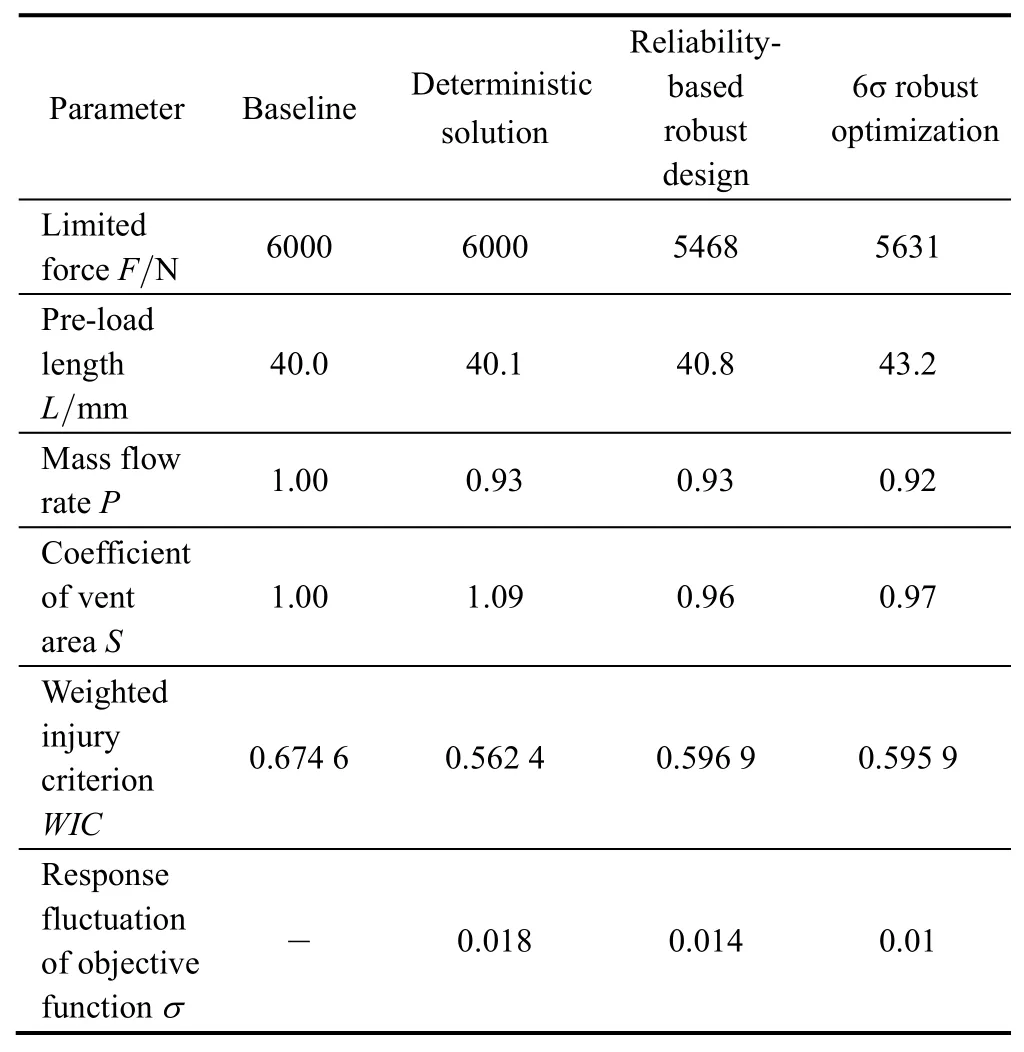
Table 6.Result of optimization
The contrast of dummy injury curves before and after 6σ robust optimization is shown in Fig.5.
5 Conclusions
(1)Robustness is an important criterion to assess the design quality of a product or system.It is usually complicated and time-consuming to obtain robust optimization result for complex nonlinear system due to multi-parameter interaction,uncontrollable factors and dynamic system characteristics.Global sensitivity analysis based on grouped variables proposed in this paper is an effective method and can be used to obtain the robust optimization result properly.
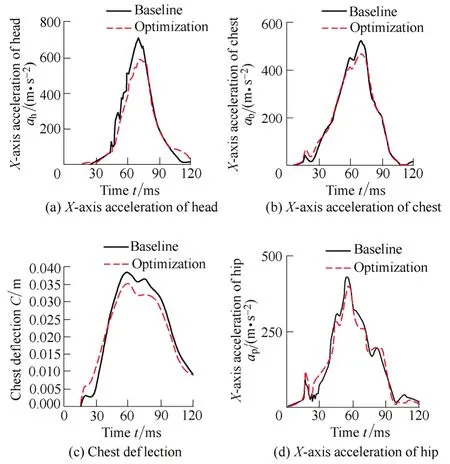
Fig.5.Contrast of dummy injury before and after 6σ robust optimization
(2)By applying this method to the robust optimization design of a real complex nonlinear system-a vehicle occupant restraint system,good results have been obtained with occupant injury reduced effectively,and the robustness of the restraint system is improved significantly.
[1]WEN Bangchun,ZHOU Zhicheng,HAN Qingkai,et al.Important role of products design of modern machinery in the research and development of new products-study on the threefold synthesis method“dynamic design,intelligent design and partial virtual design”face to products generalization quality[J].Chinese Journal of Mechanical Engineering,2003,39(10):43-52.(in Chinese)
[2]ZHANG Jian,GU Peihua,BAO Nengsheng,et al.Analytical robust design of non-linear mechanical systems[J].Journal of Mechanical Engineering,2009,45(10):207-215.(in Chinese)
[3]PIET W,GIELEN G,SANSEN W.Symbolic network analysis methods for practical analog integrated circuits:A survey[J].IEEE Transactions on Circuits and Systems II:Analog and Digital Signal Processing,1998,45(10):1331-1341.
[4]YAN Changhao,WANG Shengguo,ZENG Xuan.A new method for multiparameter robust stability distribution analysis of linear analog circuits[J].IEEE/ACM International Conference on Computer-Aided Design,Digest of Technical Papers,2011,6105363:420-427.
[5]LOCKE J C W,MILLAR A J,TURNER M S.Modelling genetic networks with noisy and varied experimental data:the circadian clock in Arabidopsis thaliana[J].Journal of Theoretical Biology,2005,234(3):383-393.
[6]ALVES R,SAVAGEAU M A.Extending the method of mathematically controlled comparison to include numerical comparisons[J].Bioinformatics,2000,16(9):786-798.
[7]STELLING J,GILLES E D,DOYLE F J.Robustness properties of circadian clock architectures[J].Proceedings of the National Academy of Sciences of the United States of America,2004,101(36):13 210-13 215.
[8]WAGNER A.Circuit topology and the evolution of robustness in two-gene circadian oscillators[J].Proceedings of the National Academy of Sciences of the United States of America,2005,102(33):11 775-11 780.
[9]OKUYAMA Y,TAKEMORI F.Robust stability analysis for nonlinear sampled-data control systems in a frequency domain[J].European Journal of Control,2002,8(2):99-108.
[10]KIM J,BATES D G,POSTLETHWAITE I.Nonlinear robust performance analysis using complex-step gradient approximation[J].Automatica,2006,42(1):177-182.
[11]KÖKSOY O.A nonlinear programming solution to robust multi-response quality problem[J].Applied Mathematics and Computation,2008,196(2):603-612.
[12]YANG Huizhong,LI Sheng.Robust stability of uncertain stochastic fuzzy cellular neural networks[J].Neurocomputing,2009,73(2):133-138.
[13]ZHANG Jian,BAO Nengsheng,ZHANG Guojun,et al.An analytical approach to robust design of nonlinear mechanical systems[J].Frontiers of Mechanical Engineering in China,2009,4(2):1673-3479.
[14]YU W,HARRIS T J.Parameter uncertainty effects on variance-based sensitivity analysis[J].Reliability Engineering and System Safety,2009,94(2):596-603.
[15]RAHMAN S.Global sensitivity analysis by polynomial dimensional decomposition[J].Reliability Engineering and System Safety,2011,96(7):825-837.
[16]NOSSENT J,ELSEN P,BAUWENS W.Sobol′ sensitivity analysis of a complex environmental model[J].Environmental Modelling &Software,2011,26(12):1515-1525.
[17]DOODMAN A R,FESANGHARY M,HOSSEINI R.A robust stochastic approach for design optimization of air cooled heat exchangers[J].Applied Energy,2009,86(7-8):1240-1245.
[18]SALTELLI A,ANNONI P.How to avoid a perfunctory sensitivity analysis[J].Environmental Modelling &Software,2010,25(12):1508-1517.
[19]SOBOL I M.Global sensitivity indices for nonlinear mathematical models and their Monte Carlo estimates[J].Mathematical modeling&Computational Experiment,1993,55(1-3):407-414.
[20]SALTELLI A,RATTO M,ANDRES T,et al.Global sensitivity analysis.The Primer[M].Chichester:John Wiley and Sons,2008.
[21]TARANTOLA S,BECKER W,ZEITZ D.A comparison of two sampling methods for global sensitivity analysis[J].Computer Physics Communications,2012,183(5):1061-1072.
[22]SALTELLI A.Making best use of model evaluations to compute sensitivity indices[J].Computer Physics Communications,2002,145(23):280-297.
[23]JACQUES J,LAVERGNE C,DEVICTOR N.Sensitivity analysis in presence of model uncertainty and correlated inputs[J].Reliability Engineering and System Safety,2006,91(10-11):1126-1134.
[24]SHAHSAVANI D,GRIMVALL A.Variance-based sensitivity analysis of model outputs using surrogate models[J].Environmental Modelling &Software,2011,26(6):723-730.
[25]LI Yuqiang,CUI Zhenshan,CHEN Jun,et al.Six sigma robust design methodology based on dual response surface model[J].Journal of Mechanical Strength,2006,28(5):690-694.(in Chinese)
[26]LI Tiezhu,LI Guangyao,CHEN Tao,et al.Robustness design of occupant restraint system based on Kriging model[J].Chinese Journal of Mechanical Engineering,2010,46(22):123-129.(in Chinese)
[27]KOCH P N,YANG R J,GU L.Design for six sigma through robust optimization[J].Structural and Multidisciplinary Optimization,2004,26:235-248.
[28]VIANO D C,AREPALLY S.Assessing the safety performance of occupant restraint system[R].SAE Paper,902328,1990.