Settlement Prediction of Dredger Fill with the Optimal Combination Model
2014-12-20WANGQingYANHuanYUANXiaoqing苑晓青NIUCencen牛岑岑ZHANGXudong张旭东
WANG Qing (王 清) ,YAN Huan (闫 欢),YUAN Xiao-qing (苑晓青),NIU Cen-cen (牛岑岑),ZHANG Xu-dong (张旭东)
College of Construction Engineering,Jilin University,Changchun 130026,China
Introduction
With the rapid economic development in recent years,reclaiming land from sea has become an important component of coastal engineering[1-4].Using dredger fill as foundation material for these projects has gained increasing attention because of its high moisture content and low strength.These characteristics lead to large post-construction settlement which requires a long time to become stable.This uneven settlement may also endanger the safety of people[5-7].Hence,calculating late settlement including the final settlement according to the measured settlement data is significant in the engineering field.Numerous prediction methods for settlement have been reported.Some of these methods are the curve fitting,Poisson curve method,genetic algorithm,neural network,and experience coefficient correction method[8].Utilizing these methods has advantages and disadvantages in the process.With the influence of factors,such as foundation soil nature and construction process,the actual settlement may be coupled by primary consolidation,creep,and other types of settlement at a certain moment.In addition,reflecting the settlement rules at a certain stage or the whole process using a prediction model is difficult[9].Thus,combining single models to achieve a better predictive effect,truthfully reflect the actual settlement rule,and improving the model prediction precision and applicability is necessary and meaningful.These combined models reflect different settlement rules in a certain manner.
The combined prediction method has its advantages in civil engineering.Hence,the method has greatly developed since its introduction by Bates and Granger[10].Li et al.[11]established a combination model of the hyperbolic and residual subsidence logarithmic methods following the principle of maximizing effectiveness.They analyzed the feasibility and effectiveness of this model in calculating settlement and the time-varying characteristics of the weight of the single prediction method.Wu and Li[12]used the least squares principle to establish the variable weight combination model based on the Logistic and Gompertz models.This research found that the fitting precision of the combination model is higher than that of the single model.Zhao et al.[13],Chen and Hou[14],and Jiang et al.[15]also used examples to prove that the combination model has higher accuracy.The weight of each model has become the focus of attention when using combination model to predict settlement.The weight is calculated based on correlation coefficient (CC)and fitting error.However,weight calculation still presents some problems.Therefore,considering a number of indicators of the fitting precision evaluation is more important in determining the weight of each model.
This study chooses the settlement data of the indoor simulation test of a vacuum preloading consolidation for the prediction analysis.This study also predicts the settlement by monitoring the data using the Hyperbolic,Logistic,Gompertz,Weibull,and other models according to the prediction results of a single model.The CC,maximum error,mean absolute error(MAE),and other indicators values are then obtained.The coefficient of variation is introduced to calculate the weight of a single evaluation index and the weight of each model in the combination model.The combination model accuracy is analyzed by comparing the predicted data of the optimized combination model and the original monitoring data.
1 Optimal Combination Model
The combination model predicts one question obtained by the single model.It then combines these single predictive models according to the different information provided and improves the predictive accuracy.The combination model effectively utilizes the information provided by each method.Moreover, the proposed model is more comprehensive,systematic,and scientific in considering problems compared with the single model.The combined model also effectively reduces the influence of environmental factors to single predictive models[9].
Assume that n kinds of predictive models are used to monitor the settlement data (i.e.,M1,M2,…,Mp).S(t)(t = 1,2,…,N)is the actual monitoring value.m(m <p)kinds of models for the combination model are then used according to the fitting results of the single model.Accordingly,Sj(t)(j = 1,2,…,m)is the settlement fitting prediction of model i at t time.The settlement of the combination model is presented as follows:where wjis the weight of each model,and

The core problem of the combination model is how to determine the weight to make the model more effective.Most of the past methods of obtaining the weight have adopted the following principle:the sum of the dispersion absolute value or the sum of the error square is the least.However,such guidelines may not truly reflect the effectiveness of the predictive method[11].Therefore,the coefficient of variation method is introduced according to the fitting results of different models to calculate the weight.The coefficient of variation is the ratio of the standard deviation and the average.Its size is influenced by the dispersion degree and the average level of variable.The average variable level is high,and the measured value of the dispersion degree is large or conversely small.
The coefficient of variation is introduced into the combination model.Assume that the number of fitting effect evaluation index for each model is n when using m kinds of predictive models.Accordingly,xij(i = 1,2,…,n;j =1,2,…,m)is the indicator i value of model j.The coefficient of variation method is used to determine the index weight.
Each index value used in weight calculation is initially standardized.The contribution of each index value to the predictive results of the combination model has both positive and negative effects.Some numerical values are large,and the prediction precision is high (e.g.,CC).Some numerical values are large,and the model prediction accuracy is low(e.g.,maximum error absolute value).Therefore, the corresponding data of each model must be standardized as follows to eliminate the effect:

where xijis the standardized data of data i of model j,and Xijis the data of data i of model j.After being standardized,each indicator of the coefficient of variation of model j is calculated as follows:

The weights of indicator i are then calculated as follows:

where δijis the coefficient of variation of indicator i,σijis the standard deviation of indicator i,x-ijis the average value of indicator i,and wijis the weight of indicator i.
The preceding equation shows that the role of the indicators in the comprehensive evaluation is large.Moreover,the weight should be high when the coefficient of variation of some indicators is great.Conversely,the role of the index in the comprehensive evaluation and the weight are small when the coefficient of variation of an index is small.The coefficient of variation is used to determine the weight of each evaluation index according to the differences between each evaluation index.The model weight is determined according to the weight of each evaluation index.The specific equation is presented as follows:

Equation (4)is combined with Eq.(1)to obtain the predictive value of the combination model.This study analyzes the fitting results of each model;calculates the CC,maximum error absolute value,absolute error percentage,and other fitting accuracy numerical values;and combines the obtained values with the preceding numerical values to calculate the weight of a single model.
2 Engineering General Situation
2.1 Study area
The soil samples used for the test are reclamation soil mostly collected from the third-phase surface of muddy ponds at the Dayaowan port area of city of Dalian,China.The specific parameters of the dredger fill are shown in Table 1.The dredger fill has high moisture content and compressibility,low strength,and permeability.These characteristics make the dredger fill extremely unfavorable for engineering[16-18].When the dredger fill is used as a foundation material,the deflection increases for a long time.Therefore,research on settlement has become very urgent.

Table 1Basic properties of the dredger fill
2.2 Settlement monitoring data
The measured settlement-time curve is presented in Fig.1.The change trend of the measured settlement curve is an“S”type.The whole analysis process is performed following the procedures described in paragraphs that follow.
The settlement is not zero at the beginning of the preloading because the dredger fill immediately settles with the discharge of a large amount of water,and the consolidation rate is faster.The water held by the soil in the model box decreases with time.The solid particles move and block some of the original drainage channels,resulting in drainage reduction and low consolidation rate.Subsequently, vacuum preloading consolidation occurs.The soil pore then gradually cuts through,and new drainage channels are formed.Consequently,the water discharge velocity starts to accelerate,and the sedimentation rate increases.The pore water pressure in soil is largely dissipated in the late settlement.The change amount of the settlement gradually slows and stabilizes,thereafter.However,due to the influence of soil skeleton creep and other factors,the settlement still slowly grew over time.In this stage,the deformation is mainly creep settlement of dredger fill.

Fig.1 Measured settlement curve
Because of the structure viscosity in the soil,instantaneous, primary consolidation, and secondary consolidation settlement exist in the whole process,which produces a certain degree of difficulty in dividing the primary and secondary consolidation settlements[19].The primary and secondary consolidation processes of the dredger fill are analyzed based on the s-lg t curve (Fig.2).It can be known that when the settlement do not reach 190 mm,the soil deformation is given priority in the primary consolidation through water discharge and particle diastrophism.This process reduces the soil pore, thereby making the soil denser.Subsequently,the sedimentation rate slowly decreases;and the soil settlement enters the stage, where the secondary consolidation becomes a priority.Because of the creep properties of the dredger fill,it still allows for settlement growth.The accurate prediction of this deformation is extremely important in estimating the final settlement.

Fig.2 s-lg t curve
The exponential curve method is used to calculate the final settlement for the settlement monitoring data through the preceding analysis.The specific process is explained in the discussions that follow.Three points(Si,ti)from the measured settlement curve after loading are considered.These three points are obtained from the settlement stabilization stage as far as possible and require that t2- t1is equal to t3- t2.The final settlement at this moment is as follows:

Considering the three points in Fig.1,the final settlement in the calculation is 209.88 mm.
3 Fitting and Predicting of Post-Construction Settlement
3.1 Fitting and predicting of single model
The Logistic, Gompertz, Weibull, Hyperbolic,Exponential,and Logarithm models are used to simulate and predict the fitting curve according to the settlement monitoring data of 85 d from the indoor simulation test of the vacuum preloading consolidation (Fig.3).
The CC,maximum relative error (MARE),minimum relative error (MRE),mean squared error (MSE),mean absolute percentage error (MAPE),and MAE evaluate the results according to the principle of fitting the predictive effect evaluation (Table 2).The final settlement prediction of each model is also presented in Table 2.

Fig.3 Original monitoring data and other model fitting curves
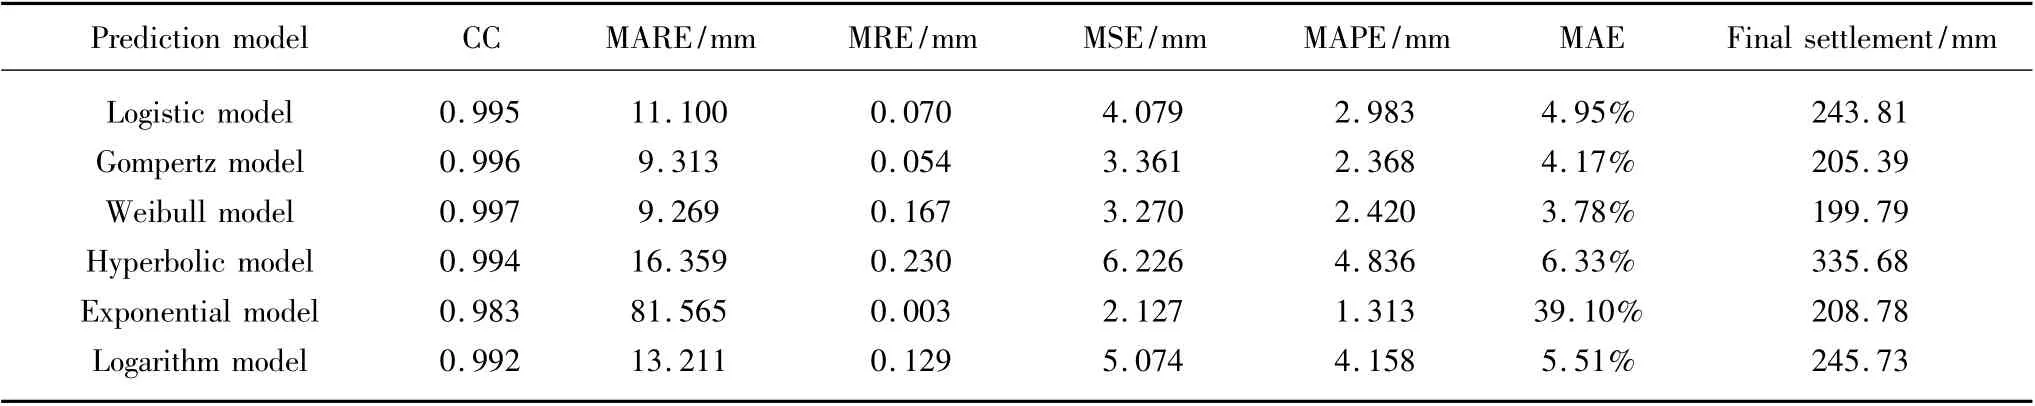
Table 2 Predictive effect evaluation indexes and final settlement of prediction models
The following results are obtained by analyzing the data in Table 2.
(1)The six models are sorted according to the fitting effect:Weibull model > Gompertz model > Logistic model >Logarithm model >Hyperbola model >Exponential model.The fitting effect of the Exponential model is the worst even though the CC reaches 0.983.The fitting effect of the Weibull model is the best,in which the fitting curve is consistent with the original monitoring settlement curve.
(2)The prior part error of the Exponential model is large,and even settlement appears negative for a single model.Therefore,this model should be removed in the combination model.The CC of other models reaches more than 0.9.Considering the fitting effect evaluation indexes,the part of the MARE reaches more than 10 mm but does not reach 10% of the settlement.The average absolute error does not also reach 5 mm,so the fitting accuracy of the five models is required.
(3)Compared with the final settlement calculation of the monitoring data,the predicting data of the Exponential model is closest,followed by Gompertz model.The prediction of the remaining models is large.The model with the largest error is the Hyperbolic model.
Therefore,to obtain a reasonable and reliable combination model,using the different fitting effect evaluation indexes to calculate the weight,it improves the precision of the combination model.
3.2 Fitting and predicting steps and principles of the combination model
Based on the preceding analysis and summary,the specific flow charts (Fig.4)and analysis in using the optimal combination model to predict the dredger fill settlement are as follows.

Fig.4 Flow chart of the optimized settlement prediction of the combination model
(1)Analyze the settlement monitoring data of the indoor simulation test,remove the outliers,and divide the data into two parts:the first data of 85 d are used for fitting,and the remaining data are employed to validate the predicted effect of the combination model.
(2)Use each selected model to fit and predict the dredger fill settlement and obtain the fitting effect evaluation indexes.
(3) Analyze the relevant indicators obtained in the previous step,eliminate the Exponential model,and use the remaining five models for the combination model (i.e.,M1,M2,M3,M4,and M5),where the corresponding settlement of fitting is Sj(t),j = 1,2,…,5.
(4)Obtain the weight (wij,i = 1,2,…,6)of each index according to Eq.(2)to calculate the coefficient of variation of each index (i = 1,2,…,6;j = 1,2,…,5).
(5)Combine the weights of the indicators and the single parameter numerical value of each model;the weight of each model wjis calculated according to Eq.(4).
(6)Use Eq.(1)to determine the optimized combination model and fit the settlement of each time point according to the weight of each model.The CC,MSE,and other indicators are used to inspect and evaluate the fitting effect.
(7)Predict the final settlement according to the fitting subsidence,and adopt the remaining data to evaluate the predicted result.
3.3 Inspection,evaluation,and prediction of the combination model
The optimal combination model is used to fit the monitoring data and calculate the late settlement according to the law of the fitting data.The predicting settlement curve is then obtained (Fig.5).The remaining data of 40 d are utilized to verify the predicted results.

Fig.5 Contrast figure of the combination model fitting data and the settlement monitoring data
The fitting effect evaluation indexes and the final settlement prediction of the combination model are shown in Table 3.

Table 3 Predictive effect of the evaluation indexes and the final settlement of the combination model
The analysis of the fitting data and the predictive effect evaluation indexes of the optimal combination model obtain the following conclusions.
(1) Using the combined model for settlement fitting produces a CC of 0.997 and accuracy higher than that of each single model.
(2)Using the coefficient of variation to determine the weight of the single model reduces the error of the combination model,which leads to a better fitting effect.The combination model comprehensively improves the fitting precision.Therefore,introducing the coefficient of variation method to optimize the combination model and improve the fitting accuracy is effective.
(3)The predictive settlement curve is slightly higher than the monitoring curve (Fig.4)and specifies that the predictive data are slightly greater than the monitoring data and good for project safety.
(4)The curve is extended according to the settlement law of the combination model obtained by the previous data fitting.The sedimentation variation becomes smaller when data of up to 250 d or more are utilized.The settlement change is about 0.1 mm or smaller.Subsequently,the settlement gradually stabilizes.The final settlement predicted by the combination model is 205.9 mm,which has a slight difference between the calculated value and the settlement monitoring data.
The fitting effect of the optimal combination model and the predictive accuracy of the post-construction settlement have improved compared with those of the single model.
4 Conclusions
The following conclusions are drawn.
(1)The basic property tests of the dredger fill used in the simulation test indicate that the organic matter and clay contents of the dredger fill are high.The most detailed information for the study of the settlement mechanism and the development regular are obtained by analyzing the settlement monitoring data and summarizing the subsidence regularity and characteristics.
(2)The analysis of the subsidence data of the test shows that the overall change trend of the measured settlement curve is an“S”type.The deformation curve of the soil is divided into three stages (i.e.,instantaneous,primary consolidation,and secondary consolidation settlement)using the time logarithmic method.
(3) Six model accuracy evaluation indicators are considered to overcome the problem of selecting a single factor from the traditional combination model when determining the weight.The coefficient of variation method is also introduced to optimize the combination model.The optimal combination model is used to fit and predict the subsidence data of the simulating test.The fitting effect evaluation indexes and the prediction of the final settlement are analyzed by comparing the relevant numerical values of the single model.This comparison confirms that the optimal combination model has a more accurate fitting predictive effect and is more reasonable than a single model.
(4)The combination model does not require the interval data of settlement and restrict the model number.Moreover,this model is applicable for the engineering field because of its high fitting and predicting precision.
[1]Wang Q,Xiao S F.A Review on the Engineering Geology of Marine Soft Soil[J].World Geology,2000,19(3):253-257.(in Chinese)
[2]Song J.Laboratory Simulation Test and PFC3D Numerical Analysis of High Clay Dredger Fill in the Consolidation Process of Step Vacuum Preloading [D].Changchun:Jilin University,2011.(in Chinese)
[3]Indraratna B,Rujikiatkamjorn C,Sathananthan I,et al.Radial Consolidation of Clay Using Compressibility Indices and Varying Horizontal Permeability [J].Canadian Geotechnical Journal,2005,42(5):1330-1341.
[4]Chu J,Yan S W,Yang H.Soil Improvement by the Vacuum Preloading Method for an Oil Storage Station[J].Geotechnique,2000,50(6):625-632.
[5]Hu Y Y,Zhou W H,Cai Y Q.Large-strain Elastic Viscoplastic Consolidation Analysis of Very Soft Clay Layers with Vertical Drains under Preloading [J].Canadian Geotechnical Journal,2014,51(2):144-157.
[6]Yan S W,Liu K J,Li W,et al.Study of Creep Properties of Soft Clay in Tianjin Binhai New Area and No-Yield-Surface Constitutive Model [J].Rock and Soil Mechanics,2010,31(5):1431-1436.(in Chinese)
[7]Zhang Z Q,Wang Q,Qin Y,et al.Indoor Simulation Test of Quick Consolidation for Dredger Fill [J].Journal of Jilin University:Earth Science Edition,2010,40(3):645-650.(in Chinese)
[8]Xue X,Song L L,Jia L,et al.New Prediction Method for Post-Construction Settlement of Soft-Soil Roadbed of Expressway[J].Chinese Journal of Geotechnical Engineering, 2011, 33(Supp 1):125-130.(in Chinese)
[9]Leng W M,Yang Q,Nie R S,et al.Study of Post-Construction Settlement Combination Forecast Method of High-Speed Railway Bridge Pile Foundation [J].Chinese Journal of Geotechnical Engineering,2011,32(11):3341-3348.(in Chinese)
[10]Bates J M,Granger C W J.Combination of Forecasts [J].Operations Research Quarterly,1969,20(4):451-468.
[11]Li T,Zhang Y P,Zhang T Q.Superior Combination Forecasting Settlement of Soft Clay Embankments[J].Chinese Journal of Rock Mechanics and Engineering,2005,24(18):3283-3286.(in Chinese)
[12]Wu Q H,Li H F.Application of the Changeable Weight Combination Model in Building Settlement Predicting [J].Journal of Geomatics Science and Technology,2009,26(2):118-124.(in Chinese)
[13]Zhao M H,Liu Y,Cao W G.Study on Variable-Weight Combination Forecasting Method of S-type Curves for Soft Clay Embankment Settlement[J].Rock and Soil Mechanics,2005,26(9):1447-1443.(in Chinese)
[14]Chen H Y,Hou D P.Research on Superior Combination Forecasting Model Based on Forecasting Effective Measure[J].Journal of University of Science and Technology of China,2002,32(2):172-180.(in Chinese)
[15]Jiang J P,Lu Z,Gao G Y,et al.Usher-Spillman Model in the Forecast of Architecture Groundsill Settlement [J].Journal of Beijing University of Technology,2011,37(4):507-514.(in Chinese)
[16]Yuan X Q.The Laboratory Simulation Tests of the New Vacuum Preloading Methods and Research on Settlement Prediction[D].Changchun:Jilin University,2012.(in Chinese)
[17]Sun H Y.A Research on Prediction Settlement of Soft Soil Foundation Consolidated by Means of Preloading [D].Changchun:Jilin University,2010.(in Chinese)
[18]Sun M Q.Engineering Characteristics and Post-construction Subsidence Prediction of Soft Soil in Tianjin Binhai New Area[D].Changchun:Jilin University,2013.(in Chinese)
[19]Wang Z L,Huang J Z,Yang X H.Study on Settlement Prediction Model Considering Rheological Properties of Soft Soils[J].Rock and Soil Mechanics,2006,27(9):1567-1570.(in Chinese)
杂志排行

Journal of Donghua University(English Edition)的其它文章
- Stress-Strength Structural Reliability Model with a Stochastic Strength Aging Deterioration Process
- Condition-Based Maintenance Decision-Making for Equipment
- Identification of the Credit Guarantee Network of Steel Trade Enterprises in China
- Methods for Reliability Assessment under Irregular Time-Varying-Stress Degradation Testing
- Efficient Method for Accelerated Reliability Qualification Testing
- Selection of Support System Type with Dectecting Mismatches between Traffic Situation and Driver Behavior