Genetic analysis of biomass and photosynthetic parameters in wheat grown in different light intensities
2014-11-22HongweiLiGuiWangQiZhengBinLiRuilianJingandZhenshengLi
Hongwei Li,Gui Wang,Qi Zheng,Bin Li,Ruilian Jing and Zhensheng Li*
1State Key Laboratory of Plant Cell and Chromosome Engineering,Institute of Genetics and Developmental Biology,the Chinese Academy of Sciences,Beijing 100101,China,2Institute of Crop Sciences,the Chinese Academy of Agricultural Sciences,Beijing 100081,China.*Correspondence:zsli@genetics.ac.cn
INTRODUCTION
Accumulation of more biomass at seedling stage is crucial for the ultimate yield formation of agriculturally important crops including common wheat(Triticum aestivum L.,Whan et al.1991;Botwright et al.2002;Rebetzke et al.2004;Kandić et al.2009;Ludwig and Asseng 2010).The growth rate of wheat seedling is largely determined by leaf development.For example,seedling plants of early vigor varieties have a higher specific leaf area(Richards 1996;Sloane et al.2004).In addition,biomass is largely derived from carbon assimilates(Robson 1973);therefore,the rate of photosynthesis and/or radiance use efficiency can lead to variation of growth rate and biomass accumulation.
Under natural condition,a plant’s light environment exhibiting considerable changes in both intensity and spectral quality largely determines its photosynthetic rate,radiance use efficiency,and biomass(Murchie and Horton 1997;Bailey et al.2001;Evans and Poorter 2001;Murchie et al.2002;Flood et al.2011;Mishra et al.2012).With the increase of growth light intensities,the light-and CO2-saturated rate of photosynthesis and the ratio of chlorophyll a to chlorophyll b increase at lowlight(LL)and high-light(HL)intensities but show a plateau at intermediate light(Bailey et al.2001).Plants have evolved a variety of mechanisms responding to the changing light environments including both LL and HL response(Murchie and Horton 1997;Bailey et al.2001,2004;Murchie et al.2002).Chlorophyll serves as light energy harvesting while carotenoids(Car)serve both as light energy harvesting and photoprotection during photosynthesis.Chlorophyll fluorescence was used to measure the photosynthetic efficiency of photosystem II(Fv/Fm),electron transport,and the redox state of photosystem II.For plants grown in LL,there may be an increase in foliar chlorophyll content(Chl)and lightharvesting complexes to harvest more light energy for photosynthesis(Bailey et al.2001).Meanwhile,growth in HL results in a progressive loss of light harvesting pigment-binding proteins and a synthesis of electron transport and carbon assimilation components,compared with leaves exposed to LL(Anderson and Osmond 1987;Anderson et al.1995).High light causes significant loss of chlorophyll and Car(Behera and Choudhury 2002)as well as Fv/Fm in wheat(Behera and Choudhury 2003).Further,HL together with high temperature,frequently occurs during the grain filling stage,can result in significant reduction of photosynthesis and strong injury in wheat(Al-Khatib and Paulsen 1989).The decrease in electron transport activity was accompanied by an increase in peroxidation of thylakoid lipids in wheat under high temperature together with HL stress(Mishra and Singhal 1992).It is generally concluded that these adjustments in photosynthetic components,often termed photosynthetic acclimation,improve the photosynthetic performance through reallocation and more efficient utilization of available light resources(Anderson et al.1995;Walters 2005).
The acclimation of plants to the growth light conditions is a very complex process involved in the biochemical,physiological,and morphological changes(Murchie and Horton 1997;Bailey et al.2001,2004;Murchie et al.2002)as well as gene expression changes simultaneously(Murchie et al.2005).In addition,it was dependent upon species(Murchie and Horton 1997)and genotypes in rice(Murchie et al.2002),common bean(Wentworth et al.2006),and wheat(Li et al.2010).Quantitative trait locus(QTL)analysis can dissect genetic loci underling a complex trait at whole genome scale(Parry and Hawkesford 2012).Many QTLs controlling Chl,photosynthesis,and chlorophyll fluorescence were identified in Arabidopsis,rice,maize,wheat,soybean,barley,cabbage,cotton,and sunflower(for review see Flood et al.2011).However,there are no reports on the genetic analysis of the responses of biomass and photosynthetic parameters to growth light intensities in plants.The object in the present research was to identify the genetic loci,chromosomal region,and related molecular markers associated with the responses of biomass and photosynthetic efficiency to growth light intensities in wheat by QTL analysis.
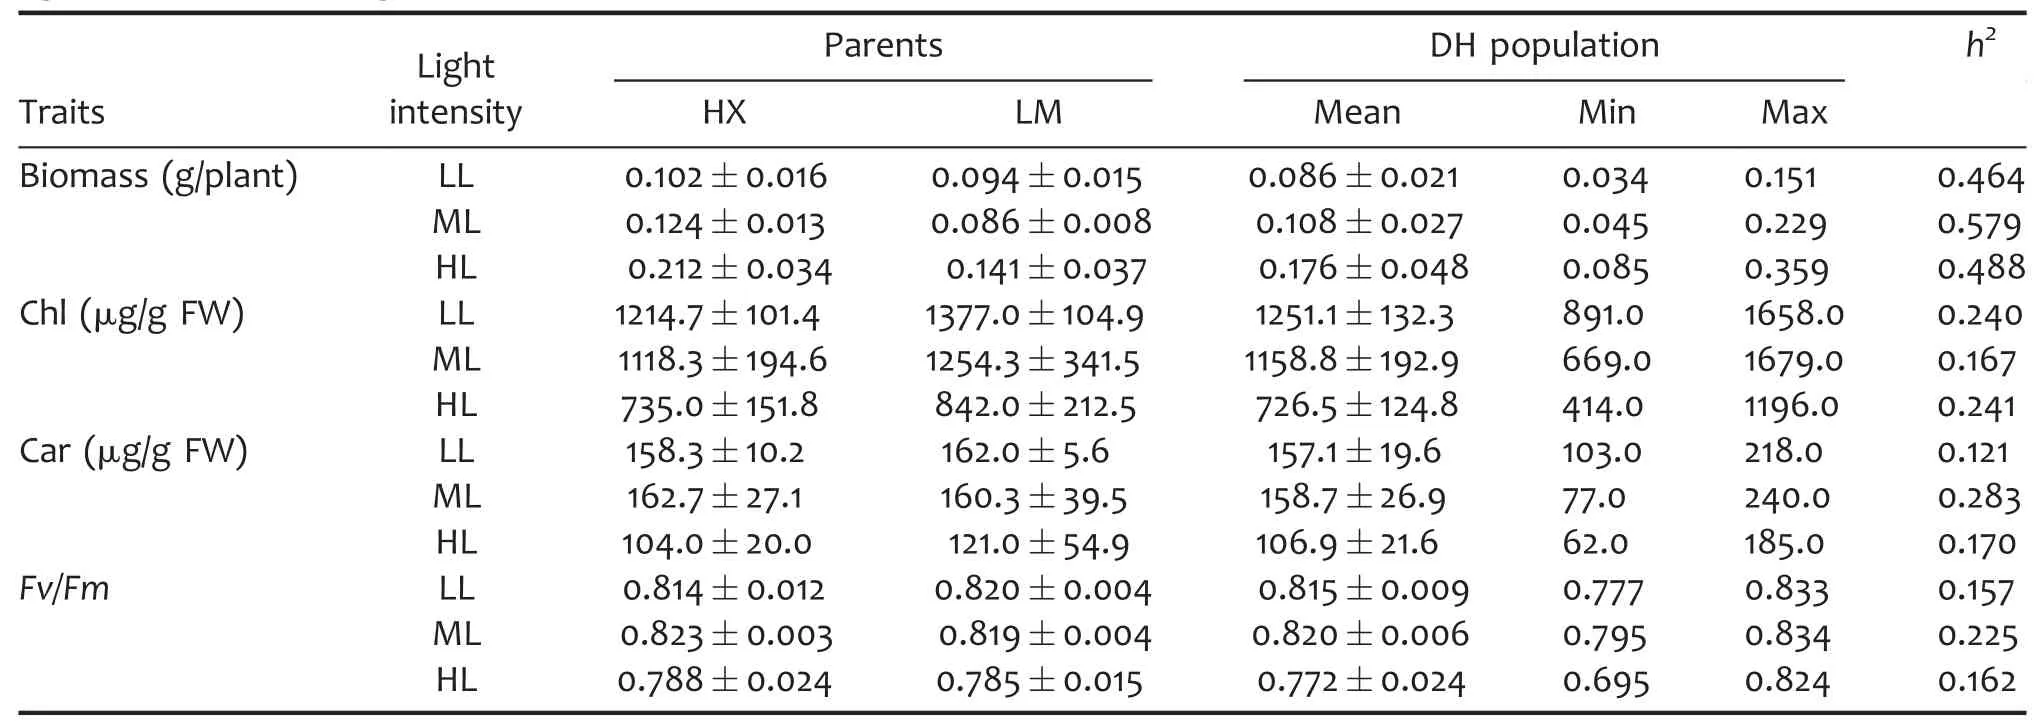
Table 1.Mean values of biomass and photosynthetic parameters in a doubled haploid(DH)population grown under different light intensities,averaged across three independent trials
RESULTS
Response of biomass and photosynthetic parameters to growth light intensities
A doubled haploid(DH)population,developed from a cross between two winter wheat varieties Hanxuan 10(HX,the female parent)and Lumai 14(LM,the male parent),were used to survey the genetic responses of biomass and photosynthetic parameters to growth light intensities in wheat seedlings.The biomass per plant,Chl and Car,and maximum photochemical efficiency of photosystem II(Fv/Fm)in fully expanded leaves were evaluated after 7 d of HL(1,000 μmol/m2per s),ML(400 μmol/m2per s),and LL(100 μmol/m2per s).The statistics of phenotypic data obtained from different light intensities are shown in Table 1.The wheat seedlings grown in HL accumulated more biomass with lower Chl,Car,and Fv/Fm in fully developed leaves in comparison with those grown in ML,suggesting that HL can promote biomass accumulation even though may cause photoinhibition to some extent.On the contrary,the wheat seedlings grown in LL produced less biomass with higher Chl compared with those planted in ML.The h2of biomass was higher than the photosynthetic parameters,indicating that the photosynthetic parameters were more easily influenced by growth light intensities than biomass.As illustrated in Table 2,the biomass and Car showed significant difference among light intensities,genotypes,and the interaction of light intensities and genotypes.Also,Chl showed significant difference among light intensities and genotypes while Fv/Fm showed significant difference only among light intensities.All the assayed parameters obtained from different light intensities showed continuous variation and near-normal distribution(Figure 1).
Relationship among the investigated traits under different light intensities
As shown in Table 3,most of the studied parameters showed strong and positive relation among the three independent measurements in different growth light intensities except for Fv/Fm in LL and HL.Under LL condition,biomass was negatively and significantly related with Chl,Car,and Fv/Fm,respectively,and the correlation coefficients decreased according to Car,Chl,and Fv/Fm.Also,in HL,significant and negative relation between biomass and Chl or Car were observed although the correlation coefficients were lower in HL than in LL.However,no significant relations between biomass and the photosynthetic parameters were observed in ML.Chlorophyll content was positively and significantly related with Car and Fv/Fm,and the correlation coefficients of Chl and Car were higher than those of Chl and Fv/Fm in various light intensities.The relation between Chl and Fv/Fm was the strongest in LL and the weakest in ML.The correlation analysis demonstrated that Fv/Fm was rather determined by Chl than Car.

Table 2.ANOVA of biomass and photosynthetic parameters in a doubled haploid(DH)population grown under different light intensities
QTL identification
Mean values of the investigated parameters from three light intensities with three independent biological repeats were separately used for QTL analysis.The QTL characteristics and chromosomal distributions were shown in Tables 4–7 and Figure 2.In total,48 QTLs were identified for all the investigated parameters under different growth light conditions,of which 14,15,9,and 10 QTLs were associated with biomass,Chl,Car,and Fv/Fm,respectively,as well as 19,13,and 16 QTLs were detected in LL,ML,and HL,respectively.These QTLs distributed across 15 chromosomes except 2A,3D,4A,4D,6D,and 7D,and they each exhibited 6.3%–36.0%of the phenotypic variance.
QTLs for biomass identified under different light conditions
In LL,five QTLs were identified to regulate biomass and they were mapped to chromosomes 1B,2D,and 3B which individually explained 9.2%–23.2%of the phenotypic variance.Of these,two,two,and one QTL were detected in trials 1,2,and 3,accordingly.In ML,three QTLs were found to be associated with biomass and they were detected in trials 2 and 3.These QTLs were located on 3B,6A,and 7B,individually accounting for 11.6%–14.4%of the phenotypic variance.QBiomassM.igdb-7B was detected in both trial 2 and trial 3.In HL,six biomass QTLs were identified which explained 9.4%–15.3%of the phenotypic variance.Of these HL-responsive QTLs,four QTLs were identified in trial 2 while one was detected in trial 1 and trial 3,respectively.Three biomass QTLs at P2449.1 on 1B,P4233.2 on 2D,and Xgwm247 on 3B were both LL-and HL-responsive.For the above 14 biomass QTLs,HX conferred the increasing alleles for nine QTLs while LM conferred the increasing ones for the other six QTLs(Table 4).
QTLs for Chl identified under different light conditions
In LL,eight QTLs were found to be associated with Chl and they were mapped to five chromosomes:2B,3A,5B,6A,and 6B.Of these,three,one,and four QTLs were detected in trials 1,2,and 3,respectively.These QTLs explained 8.0%–23.3%of the Chl variance under LL condition.In ML,three Chl QTLs were detected and mapped to 1A,5D,and 6A,accounting for 14.0%,11.2%,and 10.7%of the phenotypic variance,respectively.In HL,four QTLs were found to be associated with Chl which individually explained 8.5%–15.3%of the phenotypic variance.These HL-induced QTLs were mapped to 2B,5A,and 7B,of which QChlH.igdb-2B was detected in both trial 1 and trial 2.For the 15 Chl QTLs expressed in different light intensities,HX carried positive alleles to increase Chl for seven QTLs while LM had positive ones for the other eight QTLs(Table 5).
QTLs for Car identified under different light conditions
A total of nine QTLs controlling Car were identified and three of which were detected in LL,ML,and HL,respectively.Of these,three,one,and five QTLs were found in trial 1,trial 2,and trial 3,respectively.In LL,the Car QTLs were separately mapped to 2B,5B,and 6A and the phenotypic variance explained by these QTLs ranged 7.7%–11.9%.In ML,the Car QTLs were located on 1A,5A,and 6A and they accounted for 14.0%–18.0%of the phenotypic variance.In HL,the QTLs controlling Car were mapped to 2B,4B,and 6A,accounting for 9.9%–13.5%of the phenotypic variance.For the nine Car QTLs,HX conferred increasing alleles for six QTLs while LM had favorable ones for the other three QTLs(Table 6).
QTLs for Fv/Fm identified under different light conditions
Three QTLs were identified to control Fv/Fm in LL and they were mapped to 1A,1D,and 3B,respectively.The phenotypic variance explained by each QTL ranged 11.5%–25.0%.In ML,four QTLs were found for Fv/Fm and they were located on three chromosomes:2B,5B,and 7A.These QTLs explained 6.3%–28.0%of the Fv/Fm variance,of which QFv/FmM.igdb-5B was detected both in trial 2 and trial 3.In HL,three QTLs were identified to be associated with Fv/Fm,of which one was detected in trial 1 and the other two were detected in trial 3.These HL-induced Fv/Fm QTLs could explain 9.2%–12.9%of the phenotypic variance.Hanxuan 10 conferred favorite alleles to increase Fv/Fm for half of the detected Fv/Fm QTLs while LM carried favorable ones for the other halves under different light environments(Table 7).
DISCUSSION
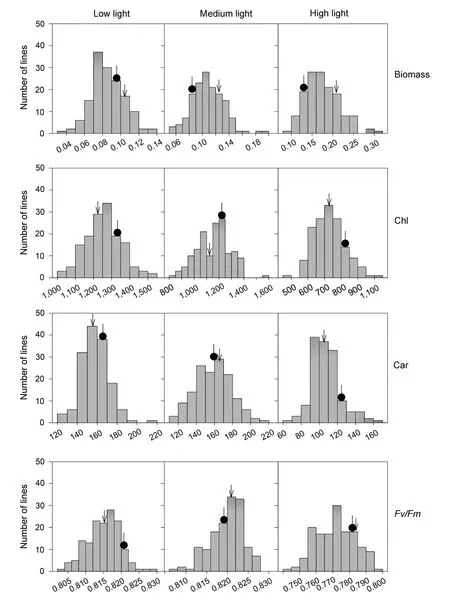
Figure 1.Frequency distributions of biomass and photosynthetic parameters in a doubled haploid(DH)population grown in low light(100 μmol/m2 per s),medium light(400 μmol/m2 per s),and high light(1,000 μmol/m2 per s),respectively,averaged across three independent trialsBiomass,dry weight of whole plant;Chl,total chlorophyll content;Car,carotenoid content;Fv/Fm,maximum photochemical efficiency of photosystem II.Arrow indicates Hanxuan 10(HX),the female parent,while black circle indicates Lumai14(LM),the male parent.
Understanding the genetic control of biomass and photosynthetic parameters in response to growth light intensities may provide a new approach for wheat improvement because light intensities largely determine photosynthetic efficiency,biomass,and ultimate grain yield of wheat.For wheat grown under non-stress condition,consistent LL usually leads to a reduction of yield as a result of reduced tillering,grain number per spike,and grain weight(Fischer and Stockman 1980).Meanwhile,HL can lead to photo-oxidative stress and premature senescence(Noodén et al.1996;Li et al.2010)and eventually causes significant yield loss.The response of biomass and photosynthetic parameters to growth light intensities observed in this study was consistent with previous researches(Bailey et al.2001;Behera and Choudhury 2002,2003).

Table 3.Correlation of biomass and photosynthetic parameters in a doubled haploid(DH)population grown under different light intensities,averaged across three independent trials
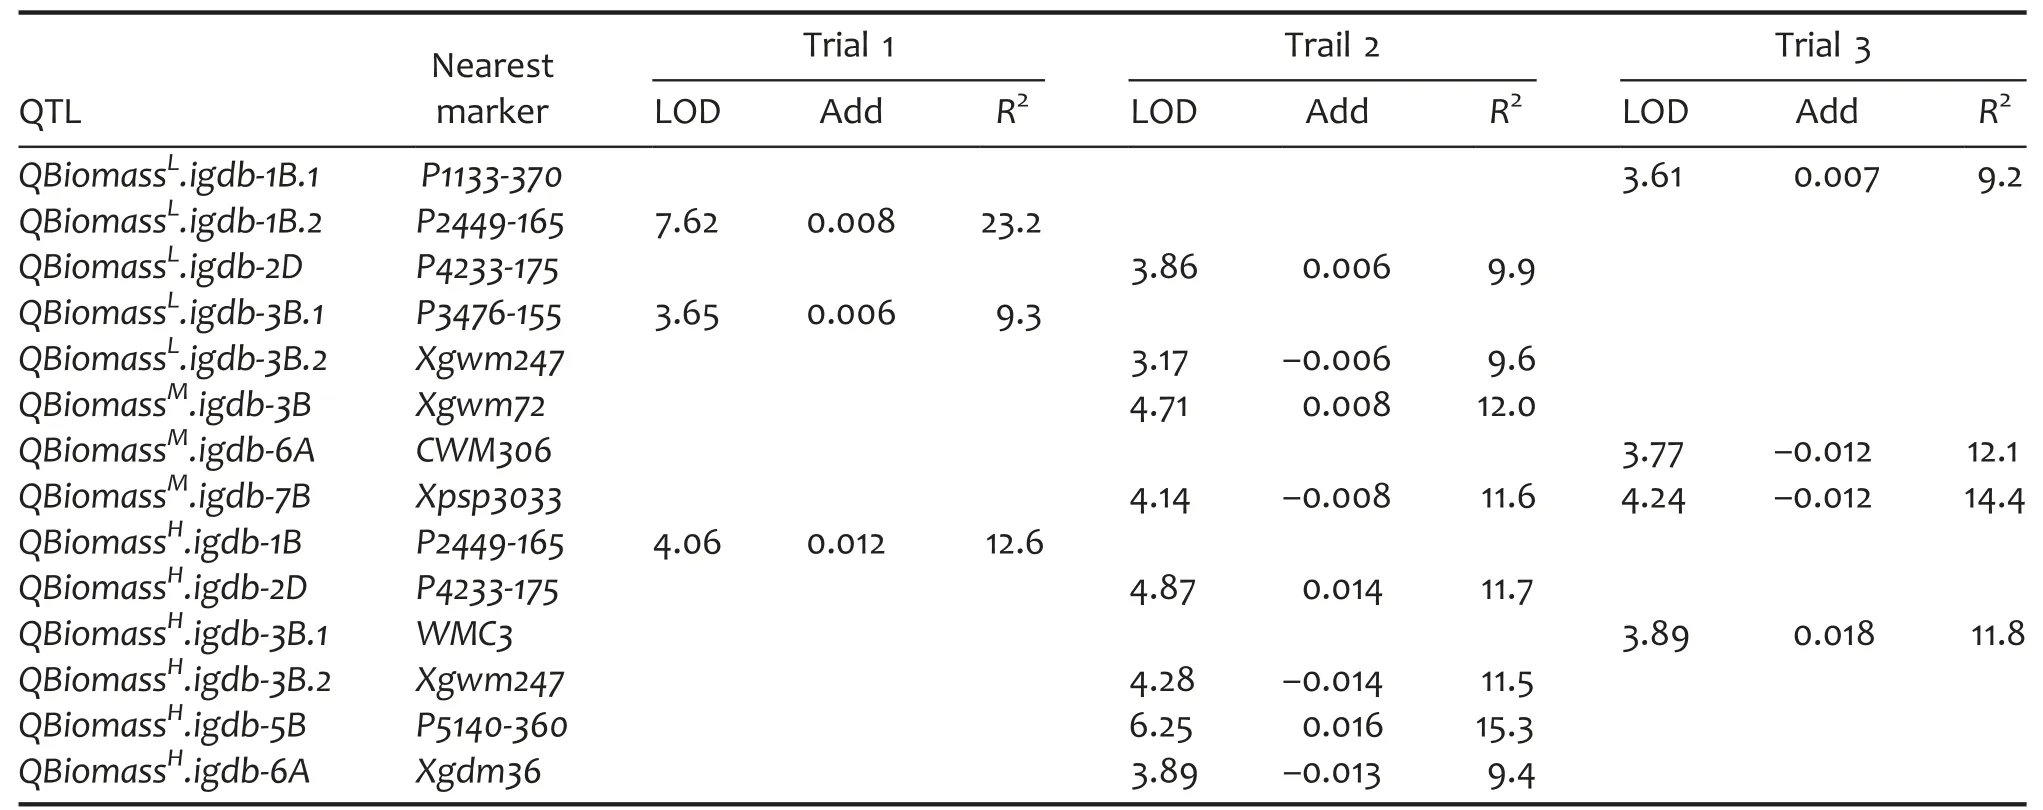
Table 4.QTL characteristics of biomass in a doubled haploid(DH)population grown under different light intensities
Furthermore,the relationship between biomass and photosynthetic parameters was also influenced by growth light intensities.For instance,in this study,biomass was significantly and negatively related with Chl and Car in both LL and HL while such relations were not observed in ML.Therefore,it seemed that biomass was negatively determined by the content of photosynthetic pigments(Chl and Car)in both LL and HL,suggesting that the photosynthetic facilities may be acclimated to the variation of growth light intensity(Bailey et al.2001).However,less variation of pigments content and photosynthetic rate were observed in ML,which may result in the lack of correlation between biomass and pigment content(Chl and Car)in ML(Bailey et al.2001).Chl was positively and significantly related with Car and Fv/Fm in different light intensities.The correlation coefficients of Chl and Car increased according to HL,LL,and ML while those of Chl and Fv/Fm increased according to ML,HL,and LL.The correlation coefficients of Chl and Car were higher than those of Chl and Fv/Fm,suggesting that Car was more determined by Chl than Fv/Fm did.During photosynthesis,chlorophyll and carotenoids may both serve as light energy harvesting molecular and share similar metabolic pathways while Fv/Fm may be determined by other factors besides Chl.
The LL and HL response of biomass and photosynthetic parameters in wheat is largely dependent upon genotypes or varieties(Li et al.2010).In the present work,for instance,HX produced more biomass than LM in different light intensities,consistent with its higher root and shoot dry weight in hydroponic culture(An et al.2006).Additionally,HX conferred less Chl than LM in various light intensities at seedling stage,which was consistent with Chl in flag leaves during the grain filling stage(Li et al.2010).The phenotypic variation of biomass and photosynthetic parameters in the DH population under different light conditions showed continuous and near-normal distribution,indicating that the LL and HL response of biomass and photosynthetic parameters in wheat were under polygene control.
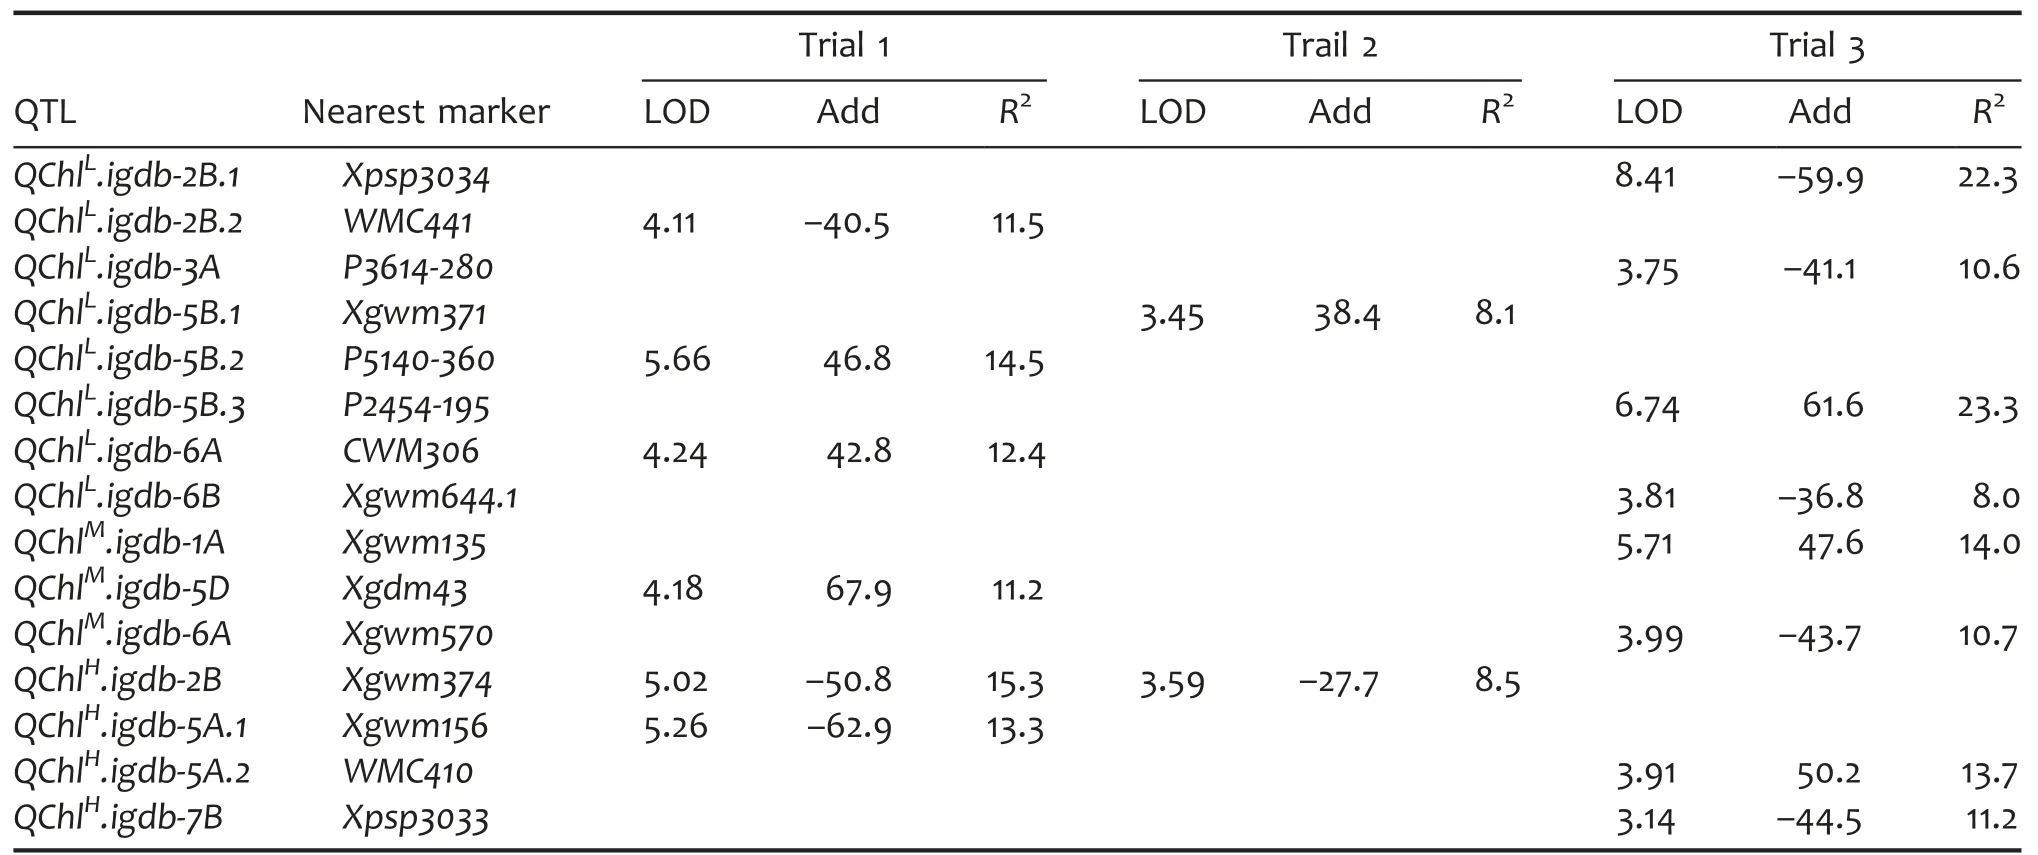
Table 5.QTL characteristics of total chlorophyll content(Chl)in a doubled haploid(DH)population grown under different light intensities

Table 6.QTL characteristics of carotenoid content(Car)in a doubled haploid(DH)population grown under different growth light intensities
In the present work,three QTLs QBiomassM.igdb-7B,QChlH.igdb-2B,and QFv/FmM.igdb-5B detected in two of the three independent trials seemed to be reproducible.The less reproducible QTLs identified in this work may be due to the high log-likelihood(LOD)threshold values and environmental factors.Actually,more QTLs were found in two or more trials if the LOD threshold values were set at lower levels(data not shown).It seemed that more QTLs were identified in LL and HL than in ML,indicating that the genetic response of biomass and photosynthetic parameters to LL and HL was more complex than to ML.These LL-and HL-induced QTLs may be associated with genetic acclimation of wheat seedlings to the varying light intensities.All these QTLs were mapped to 15 chromosomes,of which 3A,1D,and 6B were specifically involved in LL response,5D and 7A specifically involved in ML response,and 4B specifically involved in HL response.The phenotypic variance explained by the QTLs individually ranged 7.7%–25.0%in LL,6.3%–36.0%in ML,and 8.5%–15.3%in HL,respectively.Hanxuan 10 carried the increasing alleles for 12,seven,and eight QTLs while LM conferred favorable ones for seven,six,and eight QTLs in LL,ML,and HL,respectively.Interestingly,HX had more positive alleles than LM in response to LL,suggesting that HX may confer a more complex LL-acclimation mechanism than LM.Because the two parents both conferred favorable alleles,the optimal DH line,for example,DHL45,with better acclimation ability to LL and HL should combine favorable alleles from both parents.

Table 7.QTL characteristics of maximum quantum photochemical quenching efficiency of photosystem II(Fv/Fm)in a doubled haploid(DH)population grown under different light intensities
Of a total of 13 QTL clusters,two or more QTLs mapped to the same or nearby chromosome region were observed in the present study.Three biomass QTLs,QBiomassL.igdb-1B.2,QBiomassL.igdb-2D,and QBiomassL.igdb-3B.2,identified in LL still expressed in HL but did not in ML,indicating that the response of biomass in wheat to LL and HL was under similar genetic control to some extent.The correlation between two different traits also may be reflected as the coincidence or linkage of the corresponding QTLs.For example,in accordance with the negative relation between biomass and Fv/Fm in LL,QBiomassL.igdb-3B.1 was negatively linked with QFv/FmL.igdb-3B,suggesting that this locus selection for high biomass plants may accompany lower photosynthetic efficiency in LL.Additionally,six pairs of QTLs for Chl and Car:QChlM.igdb-1A and QCarM.igdb-1A,QChlL.igdb-2B.1 and QCarL.igdb-2B,QChlH.igdb-2B and QCarH.igdb-2B,QChlL.igdb-5B.2 and QCarL.igdb-5B,QChlL.igdb-6A and QCarL.igdb-6A,and QChlM.igdb-6A and QCarM.igdb-6A were collocated,indicating that Chl and Car are genetically related in various growth light intensities.Also,QCarH.igdb-4B and QFv/FmH.igdb-4B as well as QCarH.igdb-6A and QFv/FmH.igdb-6A were mapped to the same chromosome regions on 4B and 6A,respectively.According to the additive effects,Car and Fv/Fm were positively related at the 4B locus but were negatively related at the 6A locus.Hence,the HX allele at the 4B locus along with the LM allele at the 6A locus may allow us to breed wheat varieties with higher Chl and Fv/Fm in HL.In addition,four QTL clusters on 2B(QChlL.igdb-2B.2 and QFv/FmM.igdb-2B.2),5B.1(QChlL.igdb-5B.1 and QFv/FmM.igdb-5B),5B.2(QBiomassH.igdb-5B,QChlL.igdb-5B.2,and QCarL.igdb-5B),and 7B(QBiomassM.igdb-7B and QChlH.igdb-7B)were found to determine different parameters under different light environments,demonstrating that the genetic responses of biomass and photosynthetic parameters in wheat seedlings to growth light were complex.Finally,the chromosome region flanked between P4232.4 and WMC179.3 on 6A was mapped for seven QTLs:QBiomassM.igdb-6A,QChlL.igdb-6A,QChlM.igdb-6A,QCarL.igdb-6A,QCarM.igdb-6A,QCarH.igdb-6A,and QFv/FmH.igdb-6A expressed under various light conditions.Further research is needed for these QTL clusters to uncover the genetic mechanism of light responses of biomass and photosynthetic parameters.
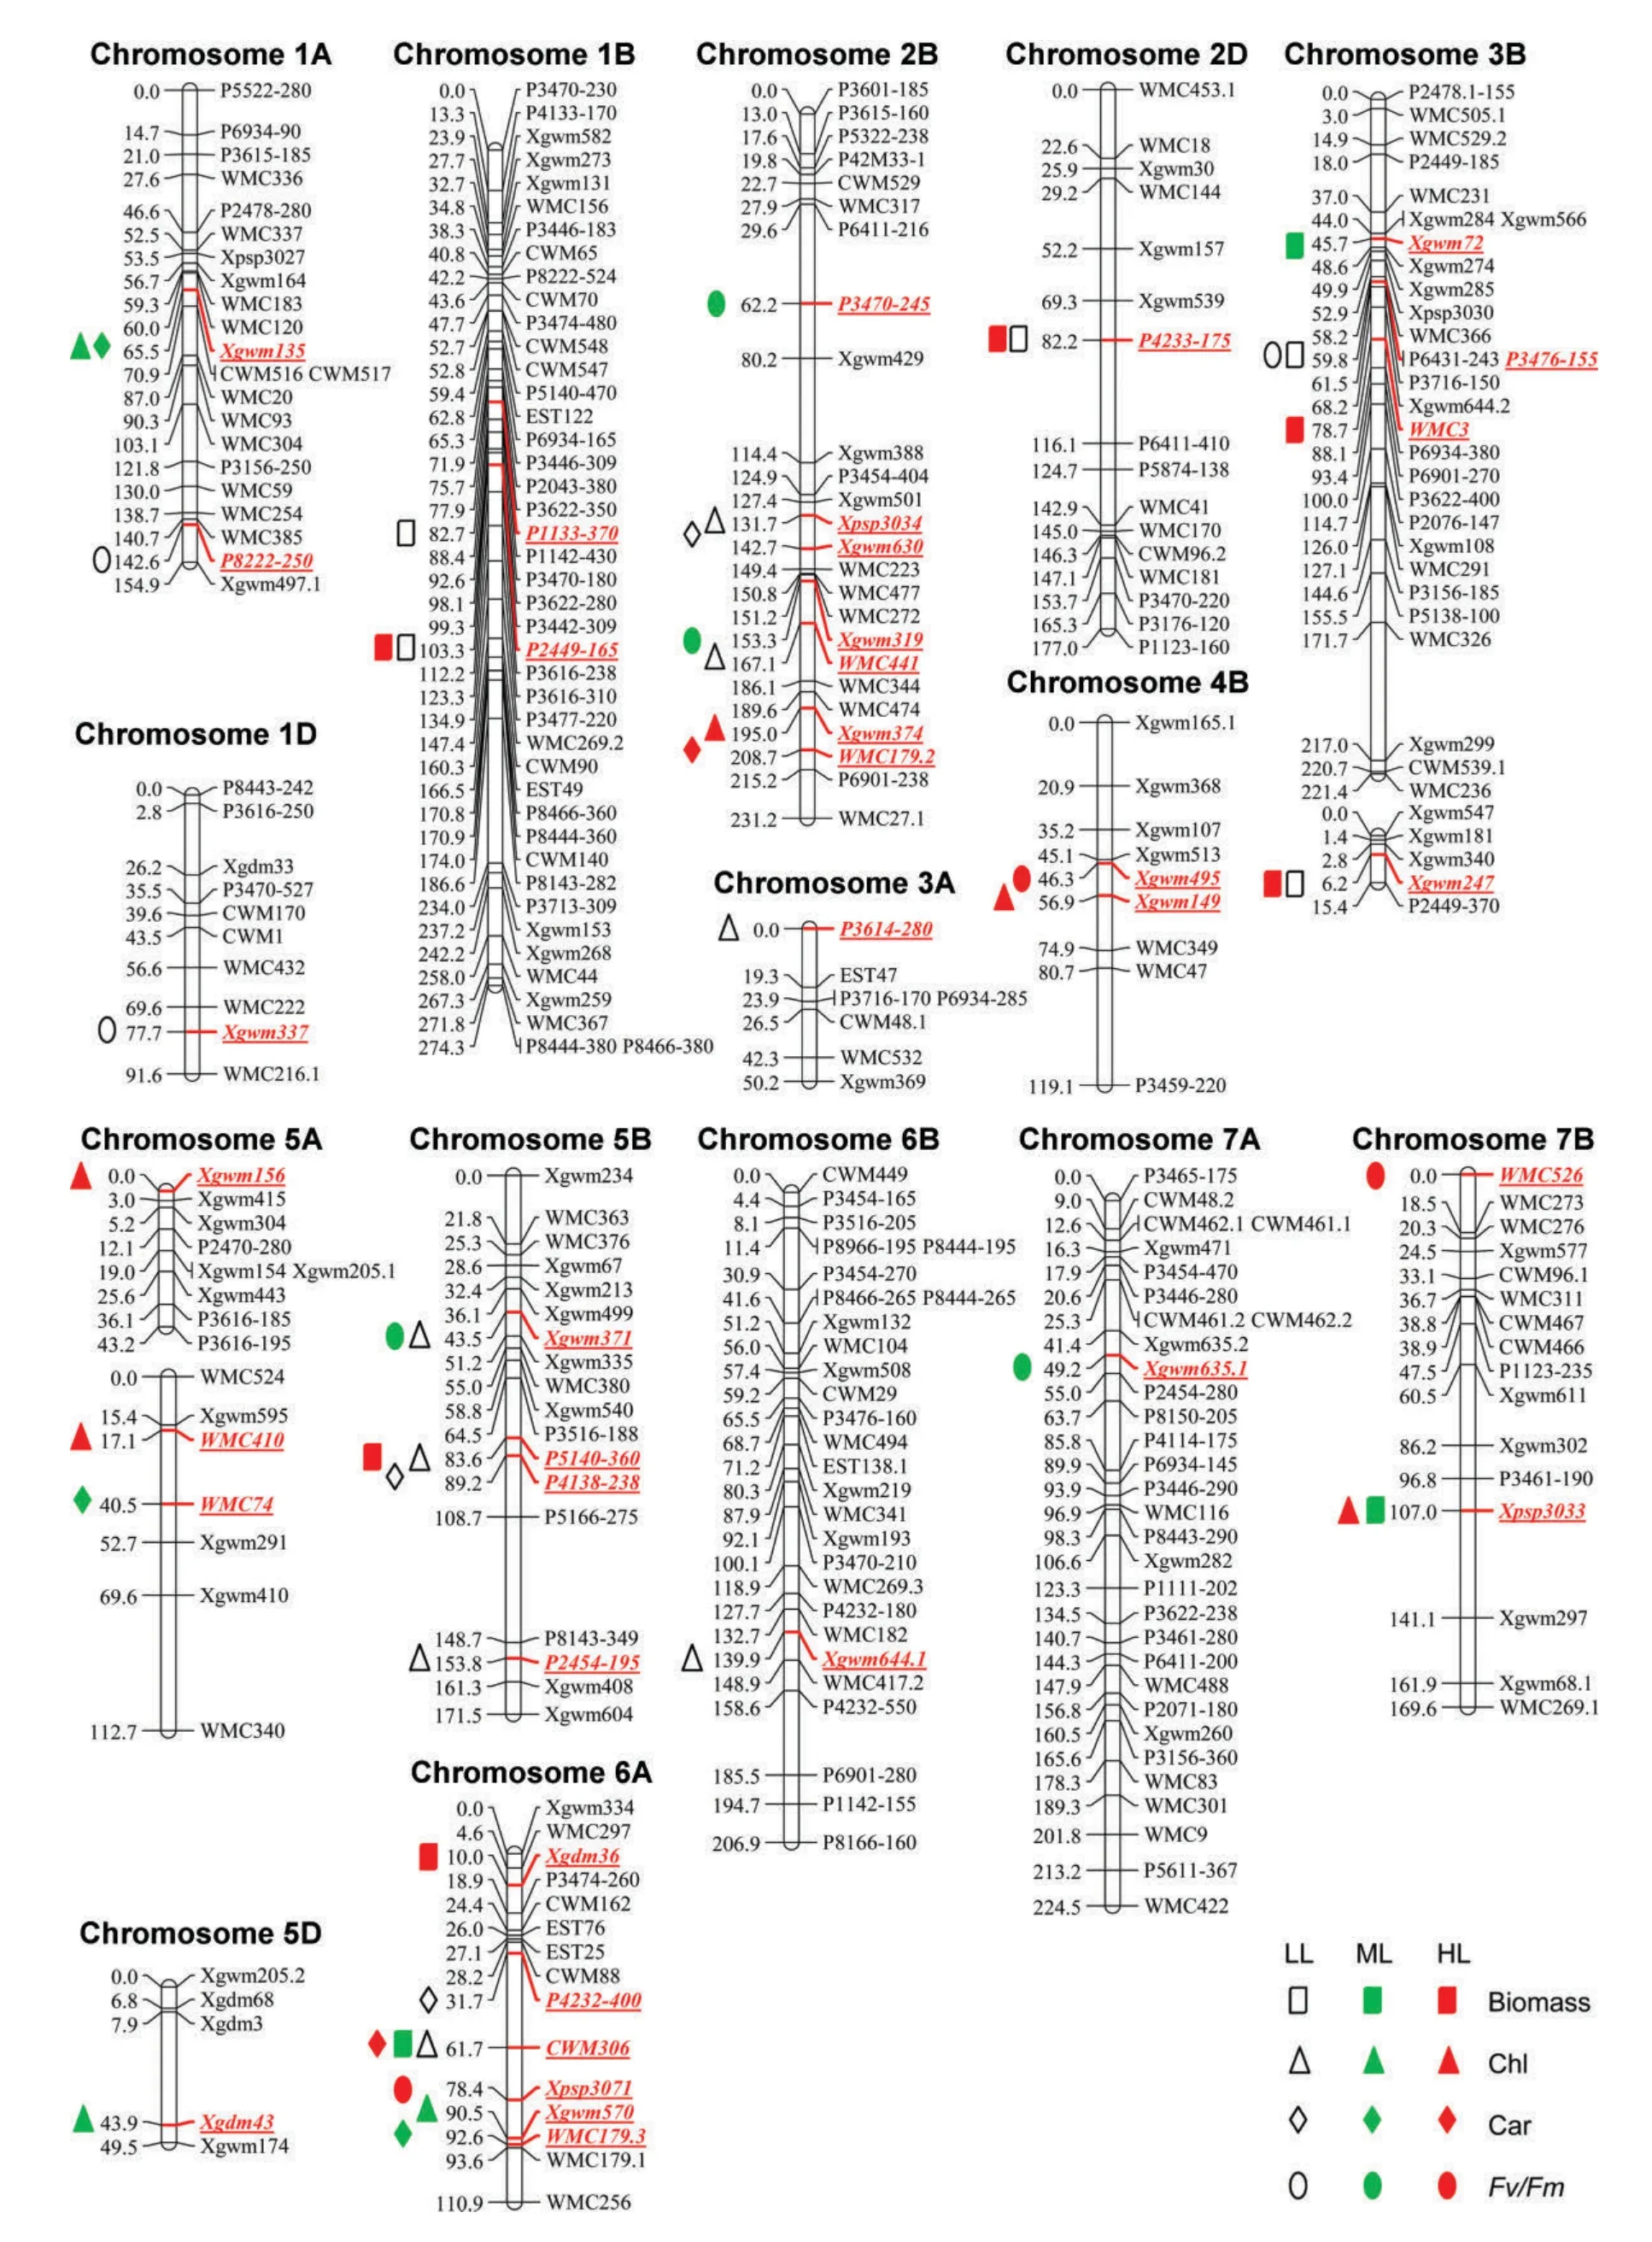
Figure 2.Distribution of quantitative trait loci(QTLs)for biomass and photosynthetic parameters in response to different growth light intensities on wheat genetic linkage groups constructed on the“Lumai 14×Hanxuan 10”doubled haploid populationLL,low light(100 μmol/m2 per s);ML,medium light(400 μmol/m2 per s);HL,high light(1,000 μmol/m2 per s);Chl,the total chlorophyll content;Car,carotenoid content;Fv/Fm,maximum photochemical efficiency of photosystem II.
Several QTLs identified in the current work were consistent with the previously reported QTLs controlling photosynthetic parameters under various conditions.Recently,we had performed a QTL analysis of tolerance to HL-induced photooxidation(HLIP)in flag leaves at the grain filling stage by using the same population as the present work(Li et al.2010).By comparison,we found that five loci involved in light response were also associated with tolerance to HLIP as follows:QChlM.igdb-1A/QCarM.igdb-1A with qChlH-1A/qFmH-1A-2;QChlL.igdb-2B.1/QCarL.igdb-2B with qChlH-2B/qFmH-2B/qFv/FmH-2B;QChlL.igdb-5B.1/QFv/FmM.igdb-5B with qChlN-5B/qChlH-5B;QBiomassH.igdb-6A with qFv/FmH-6A;and QFv/FmM.igdb-7A with qFmH-7A.It seems that the LL-and ML-response QTLs rather than HL-response QTLs for the surveyed photosynthetic parameters in wheat seedlings also play a role in flag leaves under HLIP condition.The inconsistency of HL-response QTLs and HLIP-related QTLs may be due to the difference in phenotyping methods,developmental stage,or the intrinsic genetic control.Additionally,six loci detected in the present study had been previously mapped as follows:QBiomassL.igdb-1B.1 as qFoN-1B-2/qFmN-1B-2/qFv/FmN-1B;QFv/FmL.igdb-1D as qFmN-1D;QFv/FmM.igdb-2B.2/QChlL.igdb-2B.2 as qChlN-2B;QBiomassM.igdb-3B as qChlN-3B;QChlH.igdb-5A.1 as qChlN(Li et al.2010);QBiomassL.igdb-1B.2/QBiomassH.igdb-1B as QTLs for Fv/Fo,Fm,and Fv(Yang et al.2007b);and QCarM.igdb-5A as a Chl QTL(Yang et al.2007b)in flag leaves at the grain-filling stage under non-stress condition.In addition,four loci also were found to regulate the photosynthetic parameters during dark-induced senescence process.For instance,QChlL.igdb-2B.1/QCarL.igdb-2B coincided with QFm.igdb-2B/QFv/Fm.igdb-2B/QFv/Fo.igdb-2B;QChlM.igdb-5D coincided with QFv/Fm.igdb-5D;QBiomassH.igdb-6A coincided with QChl a.igdb-6A,and QFv/FmH.igdb-6A co-located with QFm.igdb-6A/QFv/Fm.igdb-6A at seedling stage during darkinduced senescence(Li et al.2012).
Interestingly,some loci in response to growth light intensity also regulated biomass or grain weight-related traits,which may provide potentially useful information for wheat improvement.For example,QFv/FmM.igdb-2B.2/QChlL.igdb-2B.2 as well as QChlM.igdb-5D coincided with a QTL for shoot dry weight per plant(SDW)while QBiomassL.igdb-2D/QBiomassH.igdb-2D and QFv/FmH.igdb-6A collocated with a QTL for root dry weight per plant(An et al.2006).Additionally,QBiomassM.igdb-3B was nearly linked with QTLs for SDW and biomass as well as QCarH.igdb-4B/QFv/FmH.igdb-4B was linked with a biomass QTL at maturity detected by Su et al.(2009).Also,QChlH.igdb-5A.1 nearly linked with QTLs for flag greenness,dry matter accumulation(DMA),and grain weight per ear(GWE)(Su et al.2006),and biomass at maturity(Su et al.2009)as well as QChlH.igdb-5A.2 was nearly linked with an SDW QTL(Su et al.2009).In addition,QBiomassH.igdb-5B/QChlL.igdb-5B.2/QCarM.igdb-5B was previously detected for DMA(Su et al.2006)while QBiomassM.igdb-7B/QChlH.igdb-7B co-located with QTL for SDW(Su et al.2009)and GWE(Su et al.2006).Also,QTLs for thousand grain weight were co-located with seven light-responsive loci:QBiomassL.igdb-1B.1(Su et al.2009),QChlL.igdb-2B.1/QCarL.igdb-2B(Groos et al.2003),QChlL.igdb-3A(Yang et al.2007b),QChlL.igdb-5B.1/QFv/FmM.igdb-5B(Su et al.2009),QChlL.igdb-6A/QCarH.igdb-6A/QBiomassM.igdb-6A(Yang et al.2007a;Su et al.2009;Wu et al.2011),QFv/FmH.igdb-6A(Zhang et al.2010;Wu et al.2011),QBiomassH.igdb-6A(Yang et al.2007a),and QChlL.igdb-5B.1/QFv/FmM.igdb-5B(Su et al.2009).These above co-locations or QTL clusters may provide valuable information to uncover the genetic mechanism of photosynthetic efficiency and biomass/grain yield improvement in response to growth irradiance.
MATERIALS AND METHODS
Plant growth
Seeds of 150 DH lines(DHLs)and their parents HX(the female parent)and LM(the male parent)were germinated at 22°C in 24 h of darkness,then the germinating seeds were grown in a growth chamber with a 14 h photoperiod and 22°C light and 20 °C night in 100 μmol/m2per s of light provided by fluorescence lamps with relative humidity between 40%and 60%.Until the first leaf was fully expanded,the seedling plants were transplanted in a plate and then hydroponically cultured with nutrient medium renewed every 3 d(An et al.2006).At the third leaf stage,three plants of each line were subjected to 7 d of 100 μmol/m2per s(LL),400 μmol/m2per s(ML),and 1,000 μmol/m2per s(HL)with a 14 h photoperiod,respectively.Low light was provided by fluorescence lamps while ML and HL was provided by metal halide lamps(HQI-TS 150 W/D;OSRAM,Munich,German)(Li et al.2010).Under LL,ML,and HL conditions,the light/dark temperature was kept at 22–25°C/15–18°C,respectively,and the relative humidity was kept between 40%and 60%.Three independent trials for each light treatment were conducted.
Biomass determination
The second leaves were collected and measured for photosynthetic parameters.Then,the remaining parts including both shoots and roots were collected for biomass determination.The fresh samples were incubated in an oven at 105 °C for 15 min,and then at 80 °C for 3 d continuously before the dry weights were recorded.
Fv/Fm and pigment content evaluation
The maximum photochemical efficiency of photosystem II(Fv/Fm)was evaluated via Handy PEA chlorophyll fluorometer(Hansatech,Poole,Dorset,UK)after 1 h of dark adaptation.The saturated flash light intensity was set at 3,000 μmol/m2per s and the flash light duration was 1 s.The Chl was determined according to Arnon(1949)with some modifications while carotenoid content was assayed as suggested by Lichtenthaler and Wellburn(1983).An approximately 0.03 g leaf sample was extracted in 80%acetone in darkness at room temperature for approximately 3 d until the leaf sample turned white completely.Then,the extracts were measured spectrophotometrically using a Multiskan MK3 Spectrum(Thermo Scientific,Waltham,MA,USA)at 663,645,and 470 nm of the wavelength,respectively.
QTL identification and statistical analysis
The“HX×LM”genetic linkage map contains 395 markers including simple sequence repeats(SSRs),amplified fragment length polymorphism(AFLP),expressed sequence tag SSRs.It consists of 30 linkage groups and totally covers 3,904 cM with an average of 9.9 cM per marker(Hao et al.2003;Su et al.2006).The mean values of the investigated parameters from each trial were used for QTL analysis following composite interval mapping method with Windows QTL Cartographer version 2.5(Zeng 1994).Model 6 was taken using forward and backward regression on a window size of 10 cM and the walk speed was 1 cM.The threshold LOD scores were calculated for each trait using 1,000 random permutations at P<0.05(Churchill and Doerge 1994;Doerge and Churchill 1996).A significant QTL was declared when its LOD peak score was above the threshold values that ranged 2.95–7.59 with an average of 3.43 depending on parameters and trials.Additive effects and R2value,the percentage of phenotypic variance explained by the QTL,of each QTL were obtained directly from the output of this software.ANOVA,significance determination,and Pearson’s correlation coefficients were conducted by using SPSS version 13.0 for Windows(SPSS,Chicago,IL,USA).Narrow sense heritability(h2)estimates were calculated for each trait using the formula,where σA2and σP2are the additive and phenotypic variances,respectively.
ACKNOWLEDGEMENTS
The project was supported by the National Key Basic Research Program(2009CB118506),the Knowledge Innovation Program(KIP)key project from the Chinese Academy of Sciences(KSCX2-EW-N-02),and the Natural Science Foundation of China(31371609).
Al-Khatib K,Paulsen GM(1989)Enhancement of thermal injury to photosynthesis in wheat plants and thylakoids by high light intensity.Plant Physiol 90:1041–1048
An DG,Su JY,Liu QY,Zhu YG,Tong YP,Li JM,Jing RL,Li B,Li ZS(2006)Mapping QTLs for nitrogen uptake in relation to the early growth of wheat(Triticum aestivum L.).Plant Soil 284:73–84
Anderson JM,Chow WS,Park YI(1995)The grand design of photosynthesis:Acclimation of the photosynthetic apparatus to environmental cues.Photosynth Res 46:129–139
Anderson JM,Osmond CB(1987)Shade–sun responses:Compromises between acclimation and photoinhibition.In:Kyle DJ,Osmond CB,Arntzen CJ,eds.Photoinhibition.Elsevier Science Publishers,Amsterdam.pp.1–36
Arnon DI(1949)Copper enzymes in isolated chloroplasts polyphenoxidase in Beta vulgaris.Plant Physiol 24:1–5
Bailey S,Horton P,Walters RG(2004)Acclimation of Arabidopsis thaliana to the light environment:The relationship between photosynthetic function and chloroplast composition.Planta 218:793–802
Bailey S,Walters RG,Jansson S,Horton P(2001)Acclimation of Arabidopsis thaliana to the light environment:The existence of separate low light and high light responses.Planta 213:794–801
Behera RK,Choudhury NK(2002)High irradiance induced pigment degradation and loss of photochemical activity of wheat chloroplasts.Biol Plant 45:45–49
Behera RK,Choudhury NK(2003)High irradiance-induced changes in carotenoid composition and increase in non-photochemical quenching of Chl a fluorescence in primary wheat leaves.J Plant Physiol 160:1141–1146
Botwright TL,Condon AG,Rebetzke GJ,Richards RA(2002)Field evaluation of early vigour for genetic improvement of grain yield in wheat.Aust J Agr Res 53:1137–1145
Churchill GA,Doerge RW(1994)Empirical threshold values for quantitative trait mapping.Genetics 138:963–971
Doerge RW,Churchill GA(1996)Permutation tests for multiple loci affecting a quantitative character.Genetics 142:285–294
Evans JR,Poorter H(2001)Photosynthetic acclimation of plants to growth irradiance:The relative importance of specific leaf area and nitrogen partitioning in maximizing carbon gain.Plant Cell Environ 24:755–767
Fischer RA,Stockman YM(1980)Kernel number per spike in wheat(Triticum aestivum L.):Responses to preanthesis shading.Aust J Plant Physiol 7:169–180
Flood PJ,Harbinson J,Aarts MGM(2011)Natural genetic variation in plant photosynthesis.Trends Plant Sci 16:327–335
Groos C,Robert N,Bervas E,Charmet G(2003)Genetic analysis of grain protein-content,grain yield and thousand-kernel weight in bread wheat.Theor Appl Genet 106:1032–1040
Hao ZF,Chang XP,Guo XJ,Jing RL,Li RZ,Jia JZ(2003)QTL mapping for drought tolerance at stage of germination and seedling in wheat(Triticum aestivum L.)using a DH population.Sci Agr Sin 2:943–949
Kandić V,Dodig D,Jović M,Nikolic B,Prodanović S(2009)The importance of physiological traits in wheat breeding under irrigation and drought stress.Genetika 41:11–20
Li HW,Lin FY,Wang G,Jing RL,Zheng Q,Li B,Li ZS(2012)Quantitative trait loci mapping of dark-induced senescence in winter wheat(Triticum aestivum).J Integr Plant Biol 54:33–44
Li HW,Tong YP,Li B,Jing RL,Lu CM,Li ZS(2010)Genetic analysis of tolerance to photo-oxidative stress induced by high light in winter wheat(Triticum aestivum L.).J Genet Genomics 37:399–412
Lichtenthaler HK,Wellburn AR (1983)Determinations of total carotenoids and chlorophylls a and b of leaf extracts in different solvents.Biochem Soc Trans 11:591–592
Ludwig F,Asseng S(2010)Potential benefits of early vigor and changes in phenology in wheat to adapt to warmer and drier climates.Agr Syst 103:127–136
Mishra RK,Singhal GS(1992)Function of photosynthetic apparatus of intact wheat leaves under high light and heat–stress and its relationship with peroxidation of thylakoid lipids.Plant Physiol 98:1–6
Mishra Y,Jänkänpää HJ,Kiss AZ,Funk C,Schröder WP,Jansson S(2012)Arabidopsis plants grown in the field and climate chambers significantly differ in leaf morphology and photosystem components.BMC Plant Biol 12:6
Murchie EH,Horton P(1997)Acclimation of photosynthesis to irradiance and spectral quality in British plant species:Chlorophyll content,photosynthetic capacity and habitat preference.Plant Cell Environ 20:438–448
Murchie EH,Hubbart S,Chen YZ,Peng SB,Horton P(2002)Acclimation of rice photosynthesis to irradiance under field conditions.Plant Physiol 130:1999–2010
Murchie EH,Hubbart S,Peng S,Horton P(2005)Acclimation of photosynthesis to high irradiance in rice:Gene expression and interactions with leaf development.J Exp Bot 56:449–460
Noodén LD,Hillsberg JW,Schneider MJ(1996)Induction of leaf senescence in Arabidopsis thaliana by long days through a lightdosage effect.Physiol Plant 96:491–495
Parry MAJ,Hawkesford MJ(2012)An integrated approach to crop genetic improvement.J Integr Plant Biol 54:250–259
Rebetzke GJ,Botwright TL,Moore CS,Richards RA,Condon AG(2004)Genotypic variation in specific leaf area for genetic improvement of early vigour in wheat.Field Crop Res 88:179–189
Richards RA(1996)Defining selection criteria to improve yield under drought.Plant Growth Regul 20:157–166
Robson MJ(1973)The growth and development of simulated swards of perennial ryegrass:II.Carbon assimilation and respiration in a seedling sward.Ann Bot 37:501–518
Sloane DHG,Gill GS,McDonald GK(2004)The impact of agronomic manipulation of early vigour in wheat on growth and yield in South Australia.Aust J Agr Res 55:645–654
Su JY,Tong YP,Liu QY,Li B,Jing RL,Li JY,Li ZS(2006)Mapping quantitative trait loci for post-anthesis dry matter accumulation in wheat.J Integr Plant Biol 48:938–944
Su JY,Zheng Q,Li HW,Li B,Jing RL,Tong YP,Li ZS(2009)Detection of QTLs for phosphorus use efficiency in relation to agronomic performance of wheat grown under phosphorus sufficient and limited conditions.Plant Sci 176:824–836
Walters RG(2005)Towards an understanding of photosynthetic acclimation.J Exp Bot 56:435–447
Wentworth M,Murchie EH,Gray JE,Villegas D,Pastenes C,Pinto M,Horton P(2006)Differential adaptation of two varieties of common bean to abiotic stress:II.Acclimation of photosynthesis.J Exp Bot 57:699–709
Whan BR,Carlton GP,Anderson WK(1991)Potential for increasing early vigor and total biomass in spring wheat.I.Identification of genetic improvements.Aust J Agr Res 42:347–361
Wu XS,Chang XP,Jing RL(2011)Genetic analysis of carbon isotope discrimination and its relation to yield in a wheat doubled haploid population.J Integr Plant Biol 53:719–730
Yang DL,Jing RL,Chang XP,Li W(2007a)Identification of quantitative trait loci and environmental interactions for accumulation and remobilization of water-soluble carbohydrates in wheat(Triticum aestivum L.)stems.Genetics 176:571–584
Yang DL,Jing RL,Chang XP,Li W(2007b)Quantitative trait loci mapping for chlorophyll fluorescence and associated traits in wheat(Triticum aestivum).J Integr Plant Biol 49:646–654
Zeng ZB(1994)Precision mapping of quantitative trait loci.Genetics 136:1457–1468
Zhang LY,Liu DC,Guo XL,Yang WL,Sun JZ,Wang DW,Zhang AM(2010)Genomic distribution of quantitative trait loci for yield and yieldrelated traits in common wheat.J Integr Plant Biol 52:996–1007
杂志排行
Journal of Integrative Plant Biology的其它文章
- A step-by-step protocol for formaldehyde-assisted isolation of regulatory elements from Arabidopsis thaliana
- A new loss-of-function allele 28y reveals a role of ARGONAUTE1 in limiting asymmetric division of stomatal lineage ground cell
- Polycomb-group histone methyltransferase CLF is required for proper somatic recombination in Arabidopsis
- Rice MtN3/saliva/SWEET gene family:Evolution,expression profiling,and sugar transport
- Molecular characterization and expression analysis of Triticum aestivum squamosa-promoter binding protein-box genes involved in ear development
- BnWRI1 coordinates fatty acid biosynthesis and photosynthesis pathways during oil accumulation in rapeseed
